Launch of JCI -aligned PRIME Program marks a milestone in standardizing infusion practices and strengthening patient safety in Vietnam’s Central Highlands Publish date: Dec 16, 2025 The event was attended by hospital leadership, representatives…
Launch of JCI -aligned PRIME Program marks a milestone in standardizing infusion practices and strengthening patient safety in Vietnam’s Central Highlands

Publish date: Dec 16, 2025
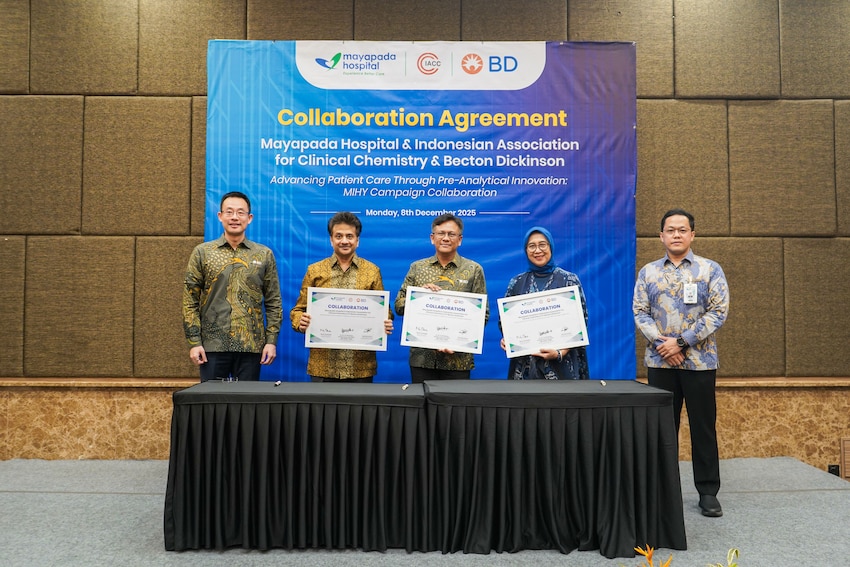
The event was attended by hospital leadership, representatives from JCI, senior executives from BD Southeast Asia and Vietnam, along with clinical department representatives, support teams, core PRIME group members, and program experts.
The PRIME program (Preventing Risks of Infections and Medication Errors in IV therapy) was developed by JCI experts in the United States with sponsorship from BD, aiming to prevent risks in infusion therapy and medication-related errors. The program is designed to standardize infusion processes through training, monitoring, evaluation, and continuous improvement, helping hospitals enhance patient safety in alignment with international standards.
For years, Thien Hanh General Hospital has focused on improving service quality and updating care protocols, particularly those related to intravenous therapy—a high-frequency procedure that directly impacts treatment outcomes. Alongside technical updates and clinical recommendations, the hospital is implementing a continuous training series in 2025 on “Safe IV Therapy”, combined with standardizing equipment, supplies, closed-system models, and safety-supporting factors. Adopting the PRIME program enables the hospital to establish a robust practice foundation, ensuring consistency and alignment with global standards.
The PRIME program, jointly implemented by BD, has been deployed in over 50 hospitals in Asia, becoming a benchmark model for standardizing infusion practices. Its structure tightly controls every step of the process: from device selection, vascular access techniques, skin preparation, catheter placement and securement, locking and line maintenance; to medication preparation under strict environmental conditions, reconstitution techniques, dose calculation, and handling of high-risk drugs.
Medication management is a key focus, involving pharmacists in prescription review, infusion rate guidance, and collaborative patient monitoring. The entire program emphasizes infection prevention and reduction of medication errors to improve safety and care quality.
Implementing PRIME requires close collaboration among nursing, infection control, pharmacy, quality management, and clinical departments. Each unit plays a specialized role while integrating into a unified practice chain to ensure sustainable process compliance.
The hospital has selected five key departments for the initial phase before scaling the model across the institution, once processes are standardized. PRIME experts will conduct on-site assessments, training, supervision, and process adjustments to ensure the program fits Thien Hanh’s clinical context.
**Dr. Tran Minh Dau, Chairman of the Board,**emphasized:
“The PRIME program under JCI international standards is not just a technical solution—it represents a systemic transformation. The program helps standardize workflows, strengthen staff competency, and build a safe, high-quality, and sustainable care environment. As the eighth hospital in Vietnam, the first in the Central Highlands, and one of the pioneers to adopt PRIME, Thien Hanh reaffirms its strong commitment to innovation and excellence in patient care.”
true
Request Documents Clear All

Privacy Preference Center
When you visit any website, it may store or retrieve information on your browser, mostly in the form of cookies. This information might be about you, your preferences or your device and is mostly used to make the site work as you expect it to. The information does not usually directly identify you, but it can give you a more personalized web experience. Because we respect your right to privacy, you can choose not to allow some types of cookies. Click on the different category headings to find out more and change our default settings. However, blocking some types of cookies may impact your experience of the site and the services we are able to offer.
Cookie Policy
Allow All
Manage Consent Preferences
Strictly Necessary Cookies
Always Active
These cookies are necessary for the website to function and cannot be switched off in our systems. They are usually only set in response to actions made by you which amount to a request for services, such as setting your privacy preferences, logging in or filling in forms. You can set your browser to block or alert you about these cookies, but some parts of the site will not then work. These cookies do not store any personally identifiable information.
Cookies Details
Performance Cookies
Performance Cookies
These cookies allow us to count visits and traffic sources so we can measure and improve the performance of our site. They help us to know which pages are the most and least popular and see how visitors move around the site. All information these cookies collect is aggregated and therefore anonymous. If you do not allow these cookies we will not know when you have visited our site, and will not be able to monitor its performance.
Cookies Details
Functional Cookies
Functional Cookies
These cookies enable the website to provide enhanced functionality and personalisation. They may be set by us or by third party providers whose services we have added to our pages. If you do not allow these cookies then some or all of these services may not function properly.
Cookies Details
Targeting Cookies
Targeting Cookies
These cookies may be set through our site by our advertising partners. They may be used by those companies to build a profile of your interests and show you relevant adverts on other sites. They do not store directly personal information, but are based on uniquely identifying your browser and internet device. If you do not allow these cookies, you will experience less targeted advertising.
Cookies Details
Social Media Cookies
Social Media Cookies
These cookies are set by a range of social media services that we have added to the site to enable you to share our content with your friends and networks. They are capable of tracking your browser across other sites and building up a profile of your interests. This may impact the content and messages you see on other websites you visit. If you do not allow these cookies you may not be able to use or see these sharing tools.
Cookies Details
Cookie List
Clear
Apply Cancel
Leg.Interest
checkbox label label
checkbox label label
checkbox label label