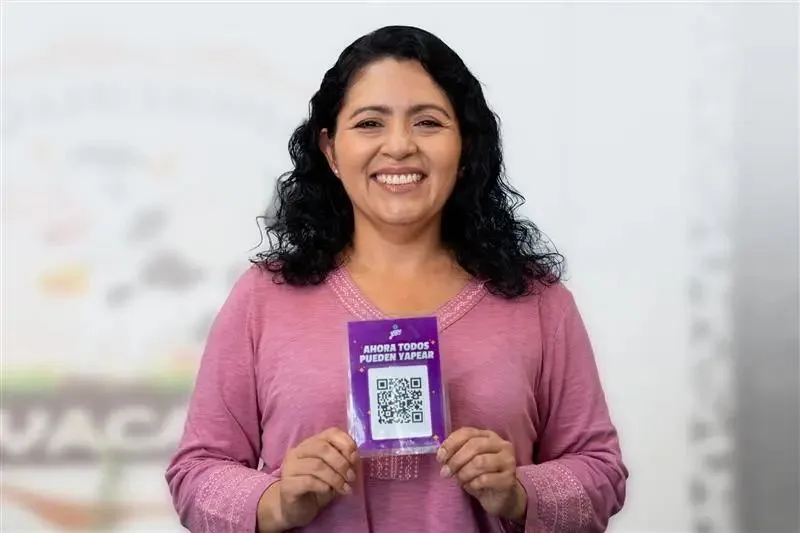
Yape alcanzó 15.9 millones de usuarios activos mensuales, que equivale al 84% de la PEA, afianzándose como la marca más valorada y reconocida del país. Durante el 4T25, entre BCP y Yape se incluyeron financieramente a 200 mil personas de 6.6 millones…
- Yape alcanzó 15.9 millones de usuarios activos mensuales, que equivale al 84% de la PEA, afianzándose como la marca más valorada y reconocida del país.
- Durante el 4T25, entre BCP y Yape se incluyeron financieramente a 200 mil personas de 6.6 millones desde 2020.
- Como parte de su estrategia para reforzar la creación de valor fronterizo, Credicorp suscribió un acuerdo para adquirir el 100% de participación de Helm Bank.
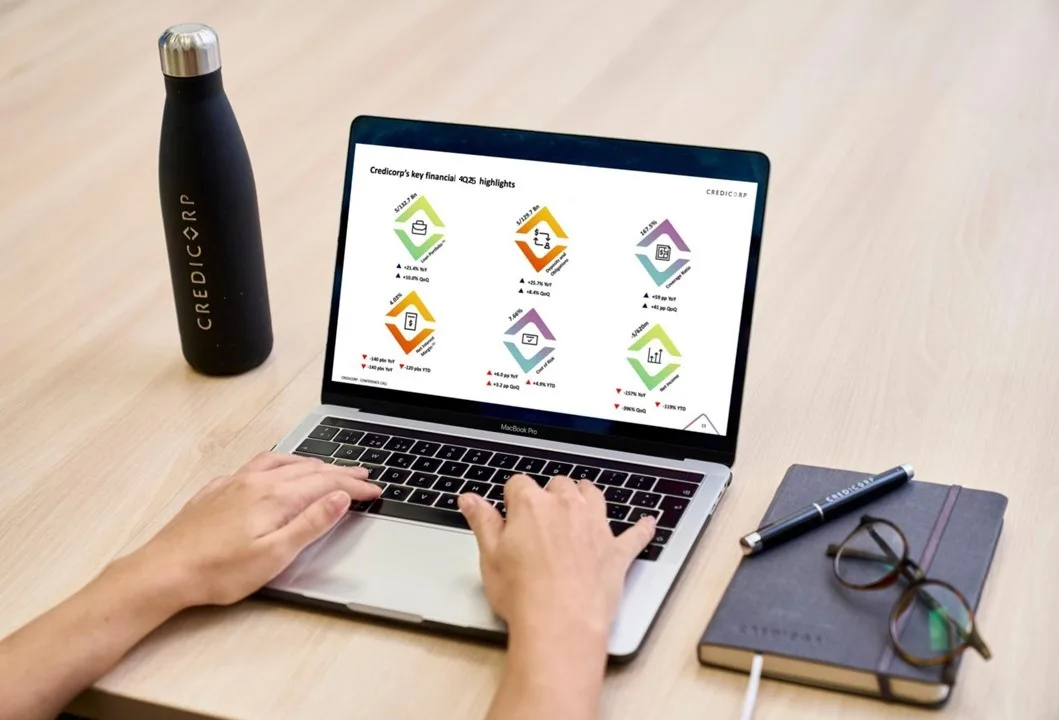
Lima, 13 de febrero de 2026.- Durante su presentación trimestral ante inversionistas, Credicorp, grupo financiero líder en el Perú con presencia en Colombia, Chile, Bolivia, Panamá y Estados Unidos, dio cuenta de sus resultados del cuarto trimestre del 2025.
El holding, conformado por BCP, BCP Bolivia, Mibanco, Mibanco Colombia, Grupo Pacífico, Prima AFP, Credicorp Capital y Krealo, reportó que la utilidad neta atribuible a Credicorp se incrementó en 25.9% respecto del 2024, alcanzando S/6,925.4 millones, lo que se traduce a un ROE de 19.0%. Estos resultados fueron impulsados por las contribuciones de las principales líneas de negocio, como Banca Universal (que incluye a Yape), Seguros y Pensiones, Microfinanzas, y Gestión y Asesoría de Inversiones.
Alejandro Pérez-Reyes, CFO de Credicorp, destacó los resultados financieros y el crecimiento a nivel regional. “Este desempeño refleja una ejecución disciplinada en nuestros negocios principales, el impacto de nuestras iniciativas de innovación y la creciente contribución del ecosistema Credicorp. Además, el margen neto de interés ajustado por riesgo alcanzó un sólido 5.3% para el año completo 2025”.
En el cuarto trimestre, la economía peruana registró un crecimiento del PBI cercano al 3,0% interanual, por debajo del crecimiento del 3T25. Los sectores primarios se desaceleraron por una caída en el sector pesca, un crecimiento bajo en el sector minero y una menor producción de cobre. La inflación se aceleró marginalmente y cerró el trimestre en 1,5% interanual (frente al 1,4% del 3T25), en el punto medio del rango meta (1%-3%) del banco central. Credicorp proyecta que el PBI crecerá 3.5% en 2026.
Adquisiciones
Como parte de su estrategia por fortalecer capacidades y potenciar su propuesta de valor, el holding ejecutó iniciativas clave durante 2025. Se completó la adquisición del 100% del joint venture mantenido con Banmédica, demostrando un sólido encaje estratégico y ejecución disciplinada que refuerzan el negocio de seguros. Más recientemente, se anunció un acuerdo para adquirir Helm Bank en EE. UU., reforzando las capacidades transfronterizas mediante un enfoque focalizado.
Transformación digital
Durante la presentación, el holding destacó que la innovación y la inclusión financiera siguen siendo fundamentales para su estrategia. “Nuestras plataformas digitales continúan escalando y ampliando el acceso a servicios financieros, al tiempo que profundizan el uso y la generación de valor. Iniciativas como Yape demuestran cómo el uso estratégico de datos, la tecnología y una gestión rigurosa del riesgo permiten impulsar un crecimiento sostenible y generar impacto”, afirmó Gianfranco Ferrari, CEO de Credicorp.
Prueba de ello es que, en el cuarto trimestre, Yape alcanzó 15.9 millones de usuarios activos mensuales, que equivale al 84% de la PEA, afianzándose como la marca más valorada y reconocida del país. Otro punto clave es la frecuencia de uso, que alcanzó un promedio de 66 transacciones mensuales por usuario activo (+30.4% interanual). Además, al cierre de 2025, más de 4.1 millones de personas accedieron a un crédito desembolsado a través de la super app.
Impacto Sostenible
En lo que respecta al despliegue de la Estrategia de Sostenibilidad 2025–2030, el holding alcanzó hitos relevantes en el periodo reportado. BCP y Yape incluyeron financieramente a 200 mil personas durante el 4T25. Así, desde el 2020, han alcanzado 6.6 millones. De la misma manera, Pacífico Seguros cerró el año con más de 3 millones de clientes protegidos con seguros inclusivos y Pacífico Salud aseguró a más de 504 mil personas con seguros de salud inclusivos durante el 2025.
Por su parte, Mibanco Perú lanzó “Mibanco por Whatsapp”, una plataforma que integra inteligencia artificial y acompañamiento humano para ampliar la inclusión financiera. Además, la subsidiaria desembolsó créditos a más de 880 mil clientes de la micro, pequeña y mediana empresa (MIPYMEs), por un monto total de S/16,256 millones al cierre del 4T25.
En cuanto a financiamientos sostenibles, BCP desembolsó US$3,440 millones, logrando que representen un tercio de su cartera. A esto se suma la ejecución del primer depósito sostenible realizado por un banco peruano, en colaboración con una empresa minera. Los recursos obtenidos se destinarán a financiar proyectos con impacto socioambiental positivo.
Volver a Noticias
* julio 15, 2026
Iniciativas de inclusión beneficiaron a millones de personas en los últimos cinco años
======================================================================================
Lima, junio de 2026.– Credicorp presentó los resultados de su Reporte de Sostenibilidad 2025, destacando el impacto de sus iniciativas para ampliar el acceso a y el uso de servicios financieros, de protección y de salud en la región durante
* mayo 19, 2026
Termómetro del Talento Credicorp: 6 de cada 10 jóvenes evalúa sus condiciones laborales como un punto de mejora
===============================================================================================================
Lima, 18 de mayo del 2026.- El Banco de Ideas Credicorp, think tank del holding financiero, presentó el Termómetro del Talento, una iniciativa que analiza las tendencias que están marcando las decisiones del talento joven y su vínculo con el
* mayo 15, 2026
Yape alcanzó 16.4 millones de usuarios activos mensuales consolidando su cobertura a nivel nacional
===================================================================================================
Lima, 15 de mayo de 2026.- Durante su presentación trimestral ante inversionistas, Credicorp, grupo financiero líder en el Perú con presencia en Colombia, Chile, Bolivia, Panamá y Estados Unidos, dio cuenta de sus resultados del primer trimestre del 2026. El holding, conformado
* abril 24, 2026
Más de 30 mil estudiantes serán beneficiados en tres regiones del Perú
======================================================================
Lima, 8 de abril de 2026– Como parte de su compromiso por reducir brechas educativas y digitales en el país, más de 30 mil estudiantes en Cusco, Cajamarca y Lima Sur-Este contarán con aulas de Innovación Pedagógica, implementadas por Credicorp
* abril 1, 2026
Dos de cada tres peruanos ya usan billeteras digitales y empujan la inclusión financiera a su máximo histórico
==============================================================================================================
Lima, 1 de abril de 2026–. La inclusión financiera en el Perú alcanzó en 2025 su nivel más alto desde el inicio de la medición del Índice de Inclusión Financiera (IIF), al llegar a 47.0 puntos. De acuerdo con el
* marzo 25, 2026
Mujeres en el nivel alcanzado de inclusión financiera se duplican en Latinoamérica desde el 2021
================================================================================================
Lima, marzo de 2026.- Por quinto año consecutivo, el Banco de Ideas Credicorp publicó el estudio Brechas de género en la inclusión financiera, elaborado en conjunto con Ipsos, el cual busca monitorear la evolución de este tema en 8 países de la región: Argentina, Bolivia, Chile, Colombia, Ecuador, México, Panamá y Perú. Los resultados demuestran que a pesar
* febrero 13, 2026
Economía peruana crecería 3,5% durante 2026
===========================================
Lima, 13 de febrero de 2026.- Durante su presentación trimestral ante inversionistas, Credicorp, grupo financiero líder en el Perú con presencia en Colombia, Chile, Bolivia, Panamá y Estados Unidos, dio cuenta de sus resultados del cuarto trimestre del 2025. El holding, conformado
* diciembre 29, 2025
Banco de Crédito del Perú adquirirá el 100% de Helm Bank USA
============================================================
Lima, Perú, 29 de diciembre de 2025 – Credicorp Ltd. (“Credicorp”) (NYSE: BAP | BVL: BAP), el holding líder de servicios financieros en el Perú con presencia en Chile, Colombia, Bolivia, Panamá y Estados Unidos, anunció hoy que su subsidiaria,
* octubre 27, 2025
Latinoamérica consolida cinco años consecutivos de avances en inclusión financiera
===================================================================================
Lima, 27 de octubre de 2025. Credicorp, holding de servicios financieros líder en el mercado peruano y con presencia en la región, presentó la quinta edición del Índice de Inclusión Financiera (IIF), que forma parte del Banco de Ideas de
* octubre 24, 2025
Agility Summit Credicorp 2025: la sexta edición del foro más importante sobre agilidad empresarial en Latinoamérica
===================================================================================================================
Lima, 24 de octubre de 2025. – Credicorp, holding financiero líder en la región, anuncia la sexta edición del Agility Summit Credicorp, el foro sobre agilidad empresarial más importante de Latinoamérica. Durante el evento, se abordarán temas como el modelo
* agosto 15, 2025
Presentamos nuestros resultados del segundo trimestre del 2025
==============================================================
Lima, 15 de agosto de 2025.- Durante su presentación trimestral ante inversionistas, Credicorp, grupo financiero líder en el Perú con presencia en Colombia, Chile, Bolivia, Panamá y Estados Unidos, dio cuenta de sus resultados del segundo trimestre del 2025. El
* mayo 16, 2025
Economía peruana creció 3.9% en el primer trimestre pese a tensiones comerciales
================================================================================
Lima, 16 de mayo de 2025.- Durante su presentación trimestral ante inversionistas, Credicorp, grupo financiero líder en el Perú con presencia en Colombia, Chile, Bolivia, Panamá y Estados Unidos, dio cuenta de sus resultados del primer trimestre del 2025. El
Otras noticias
Iniciativas de inclusión beneficiaron a millones de personas en los últimos cinco años
Termómetro del Talento Credicorp: 6 de cada 10 jóvenes evalúa sus condiciones laborales como un punto de mejora
Yape alcanzó 16.4 millones de usuarios activos mensuales consolidando su cobertura a nivel nacional
Más de 30 mil estudiantes serán beneficiados en tres regiones del Perú
Dos de cada tres peruanos ya usan billeteras digitales y empujan la inclusión financiera a su máximo histórico
Mujeres en el nivel alcanzado de inclusión financiera se duplican en Latinoamérica desde el 2021
Economía peruana crecería 3,5% durante 2026
Banco de Crédito del Perú adquirirá el 100% de Helm Bank USA
Latinoamérica consolida cinco años consecutivos de avances en inclusión financiera
Agility Summit Credicorp 2025: la sexta edición del foro más importante sobre agilidad empresarial en Latinoamérica




Contribuimos a mejorar vidas, acelerando los cambios que nuestros países necesitan.
© 2026 Grupo Credicorp. All rights reserved.
Links Útiles