July 28, 2026 ARLINGTON, Va., July 28, 2026 /PRNewswire/ -- Second Quarter 2026 Revenue increased to $24.6 billion primarily reflecting 171 commercial deliveries GAAP loss per share of ($0.67) and core loss per share (non-GAAP)* of ($0.76)…
July 28, 2026
ARLINGTON, Va., July 28, 2026 /PRNewswire/ --
Second Quarter 2026
-
Revenue increased to $24.6 billion primarily reflecting 171 commercial deliveries
-
GAAP loss per share of ($0.67) and core loss per share (non-GAAP)* of ($0.76)
-
Operating cash flow of $1.4 billion and free cash flow (non-GAAP)* of $0.6 billion
-
Total company backlog grew to a record $715 billion, including over 6,200 commercial airplanes
| --- | --- | --- | --- | --- | --- | --- | --- | --- | --- | --- | --- | --- |
| Table 1. Summary Financial Results | | Second Quarter | | | | | | First Half | | | | |
| (Dollars in Millions, except per share data) | | 2026 | | 2025 | | Change | | 2026 | | 2025 | | Change |
| | | | | | | | | | | | | |
| Revenues | | $24,560 | | $22,749 | | 8 % | | $46,777 | | $42,245 | | 11 % |
| | | | | | | | | | | | | |
| GAAP | | | | | | | | | | | | |
| Earnings/(loss) from operations | | $156 | | ($176) | | NM | | $604 | | $285 | | 112 % |
| Operating margins | | 0.6 % | | (0.8) % | | 1.4 Pts | | 1.3 % | | 0.7 % | | 0.6 Pts |
| Net loss | | ($428) | | ($612) | | NM | | ($435) | | ($643) | | NM |
| Diluted loss per share | | ($0.67) | | ($0.92) | | NM | | ($0.79) | | ($1.09) | | NM |
| Operating cash flow | | $1,364 | | $227 | | 501 % | | $1,185 | | ($1,389) | | NM |
| | | | | | | | | | | | | |
| Non-GAAP* | | | | | | | | | | | | |
| Core operating earnings/(loss) | | $1 | | ($433) | | NM | | $294 | | ($234) | | NM |
| Core operating margins | | 0.0 % | | (1.9) % | | 1.9 Pts | | 0.6 % | | (0.6) % | | 1.2 Pts |
| Core loss per share | | ($0.76) | | ($1.24) | | NM | | ($0.97) | | ($1.73) | | NM |
| | |
| --- | --- |
| | |
| _*_Non-GAAP measure; complete definitions of Boeing's non-GAAP measures are on page 5, "Non-GAAP Measures Disclosures." | |
The Boeing Company [NYSE: BA] recorded second quarter revenue of $24.6 billion, GAAP loss per share of ($0.67) and core loss per share (non-GAAP)* of ($0.76). The company reported operating cash flow of $1.4 billion and free cash flow (non-GAAP)* of $0.6 billion. Results primarily reflect higher commercial delivery volume and favorable working capital within the year. Total company backlog at quarter end grew to a record $715 billion.
"I'm very pleased with the progress our team is making as we execute our plan. Our operations are more stable and key certification programs remain on plan. Our focus has been on restoring trust and we are now building on that through a sustained focus on safety, quality, and on-time performance," said Kelly Ortberg, Boeing president and chief executive officer. "While there is more work ahead in the second half of the year, the momentum we are building continues to move Boeing in the right direction."
| | | | | | | | | |
| --- | --- | --- | --- | --- | --- | --- | --- | --- |
| Table 2. Cash Flow | | Second Quarter | | | | First Half | | |
| (Millions) | | 2026 | | 2025 | | 2026 | | 2025 |
| Operating cash flow | | $1,364 | | $227 | | $1,185 | | ($1,389) |
| Less additions to property, plant & equipment | | ($733) | | ($427) | | ($2,008) | | ($1,101) |
| Free cash flow* | | $631 | | ($200) | | ($823) | | ($2,490) |
| | |
| --- | --- |
| | |
| _*_Non-GAAP measure; complete definitions of Boeing's non-GAAP measures are on page 5, "Non-GAAP Measures Disclosures." | |
Operating cash flow was $1.4 billion in the quarter reflecting higher commercial deliveries and working capital timing. Additions to property, plant and equipment primarily reflects higher investments in Charleston and St. Louis sites.
| | | | | |
| --- | --- | --- | --- | --- |
| Table 3. Cash, Marketable Securities and Debt Balances | | Quarter End | | |
| (Billions) | | 2Q 2026 | | 1Q 2026 |
| Cash and investments in marketable securities1 | | $20.0 | | $20.9 |
| Consolidated debt | | $45.9 | | $47.2 |
| | |
| --- | --- |
| | |
| 1_Marketable securities consist primarily of time deposits due within one year classified as "short-term investments."_ | |
Cash and investments in marketable securities totaled $20.0 billion, compared to $20.9 billion at the beginning of the quarter, reflecting debt repayments partially offset by cash flow generated in the quarter. The company maintains access to credit facilities of $10.0 billion, which remain undrawn.
Segment Results
Commercial Airplanes
| | | | | | | | | | | | | |
| --- | --- | --- | --- | --- | --- | --- | --- | --- | --- | --- | --- | --- |
| Table 4. Commercial Airplanes | | Second Quarter | | | | | | First Half | | | | |
| (Dollars in Millions) | | 2026 | | 2025 | | Change | | 2026 | | 2025 | | Change |
| | | | | | | | | | | | | |
| Deliveries | | 171 | | 150 | | 14 % | | 314 | | 280 | | 12 % |
| | | | | | | | | | | | | |
| Revenues | | $11,751 | | $10,874 | | 8 % | | $20,954 | | $19,021 | | 10 % |
| Loss from operations | | ($322) | | ($557) | | NM | | ($885) | | ($1,094) | | NM |
| Operating margins | | (2.7) % | | (5.1) % | | 2.4 Pts | | (4.2) % | | (5.8) % | | 1.6 Pts |
Commercial Airplanes second quarter revenue of $11.8 billion and operating margin of (2.7) percent primarily reflects higher deliveries, favorable mix, improved performance, and other adjustments.
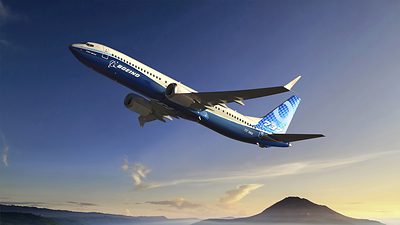
The 737 program began transitioning production to 47 per month rate in the quarter and activated low-rate initial production on the 737 North Line in July. As of July, certification flight testing has been completed on both the 737-7 and 737-10. The company continues to anticipate certification in 2026 and first delivery in 2027 for both variants. In the quarter, the 777X program received FAA approval to begin certification flight testing under Type Inspection Authorization 4B. The company continues to anticipate first delivery in 2027.
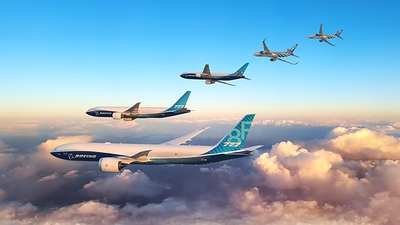
Commercial Airplanes booked 246 net orders including orders from Korean Air, Delta Air Lines, and SMBC Capital. Commercial Airplanes delivered 171 airplanes and backlog included over 6,200 airplanes valued at a record $597 billion.
Defense, Space & Security
| | | | | | | | | | | | | |
| --- | --- | --- | --- | --- | --- | --- | --- | --- | --- | --- | --- | --- |
| Table 5. Defense, Space & Security | | Second Quarter | | | | | | First Half | | | | |
| (Dollars in Millions) | | 2026 | | 2025 | | Change | | 2026 | | 2025 | | Change |
| | | | | | | | | | | | | |
| Revenues | | $7,483 | | $6,617 | | 13 % | | $15,082 | | $12,915 | | 17 % |
| Earnings/(loss) from operations | | ($15) | | $110 | | NM | | $218 | | $265 | | (18) % |
| Operating margins | | (0.2) % | | 1.7 % | | (1.9) Pts | | 1.4 % | | 2.1 % | | (0.7) Pts |
Defense, Space & Security second quarter revenue was $7.5 billion driven by higher volume. Operating margin was (0.2) percent in the quarter. Results include $280 million of losses on the VC-25B program primarily driven by an investment in additional production and certification resources. The company continues to anticipate first delivery in 2028.
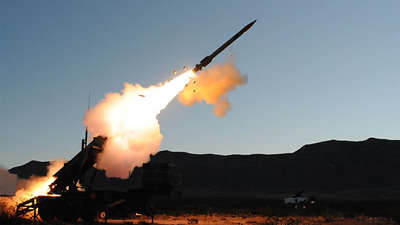
During the quarter, Defense, Space & Security secured an award from the U.S. Space Force to provide proprietary communications capabilities, successfully completed first flight and received Milestone C on the U.S. Navy MQ-25A Stingray, and began low-rate initial production of the U.S. Air Force T-7A Red Hawk. Backlog at Defense, Space & Security was $85 billion, with 27 percent representing orders from customers outside the U.S.
Global Services
| | | | | | | | | | | | | |
| --- | --- | --- | --- | --- | --- | --- | --- | --- | --- | --- | --- | --- |
| Table 6. Global Services | | Second Quarter | | | | | | First Half | | | | |
| (Dollars in Millions) | | 2026 | | 2025 | | Change | | 2026 | | 2025 | | Change |
| | | | | | | | | | | | | |
| Revenues | | $5,344 | | $5,281 | | 1 % | | $10,714 | | $10,344 | | 4 % |
| Earnings from operations | | $968 | | $1,049 | | (8) % | | $1,939 | | $1,992 | | (3) % |
| Operating margins | | 18.1 % | | 19.9 % | | (1.8) Pts | | 18.1 % | | 19.3 % | | (1.2) Pts |
Global Services second quarter revenue was $5.3 billion on higher volume. Operating margin of 18.1 percent reflects impacts from the Digital Aviation Solutions divestiture, higher costs, and unfavorable mix.
In the quarter, Global Services captured an award from the U.S. Navy to provide training systems for the P-8A and announced an agreement with Alaska Airlines to integrate the Boeing Virtual Airplane training solution. Global Services ended the quarter with backlog of $33 billion.
Additional Financial Information
| | | | | | | | | |
| --- | --- | --- | --- | --- | --- | --- | --- | --- |
| Table 7. Additional Financial Information | | Second Quarter | | | | First Half | | |
| (Dollars in Millions) | | 2026 | | 2025 | | 2026 | | 2025 |
| Revenues | | | | | | | | |
| Unallocated items, eliminations and other | | ($18) | | ($23) | | $27 | | ($35) |
| Earnings/(loss) from operations | | | | | | | | |
| Unallocated items, eliminations and other | | ($630) | | ($1,035) | | ($978) | | ($1,397) |
| FAS/CAS service cost adjustment | | $155 | | $257 | | $310 | | $519 |
| Other income, net | | $79 | | $325 | | $273 | | $648 |
| Interest and debt expense | | ($600) | | ($710) | | ($1,216) | | ($1,418) |
| Income Tax Expense | | ($63) | | ($51) | | ($96) | | ($158) |
Unallocated items, eliminations and other primarily reflects timing of allocations.
Non-GAAP Measures Disclosures
We supplement the reporting of our financial information determined under Generally Accepted Accounting Principles in the United States of America (GAAP) with certain non-GAAP financial information. The non-GAAP financial information presented excludes certain significant items that may not be indicative of, or are unrelated to, results from our ongoing business operations. We believe that these non-GAAP measures provide investors with additional insight into the company's ongoing business performance. These non-GAAP measures should not be considered in isolation or as a substitute for the related GAAP measures, and other companies may define such measures differently. We encourage investors to review our financial statements and publicly-filed reports in their entirety and not to rely on any single financial measure. The following definitions are provided:
Core Operating Earnings/(Loss), Core Operating Margins and Core Earnings/(Loss) Per Share
Core operating earnings/(loss) is defined as GAAP _Earnings/(l_oss) from operations excluding the FAS/CAS service cost adjustment. The FAS/CAS service cost adjustment represents the difference between the Financial Accounting Standards (FAS) pension and postretirement service costs calculated under GAAP and costs allocated to the business segments. Core operating margins is defined as Core operating earnings/(loss) expressed as a percentage of revenue. Core earnings/(loss) per share is defined as GAAP Diluted earnings/(loss) per share excluding the net earnings/(loss) per share impact of the FAS/CAS service cost adjustment and Non-operating pension and postretirement expenses. Non-operating pension and postretirement expenses represent the components of net periodic benefit costs other than service cost. Pension costs allocated to BDS and BGS businesses supporting government customers are computed in accordance with U.S. Government Cost Accounting Standards (CAS), which employ different actuarial assumptions and accounting conventions than GAAP. CAS costs are allocable to government contracts. Other postretirement benefit costs are allocated to all business segments based on CAS, which is generally based on benefits paid. Management uses core operating earnings/(loss), core operating margins and core earnings/(loss) per share for purposes of evaluating and forecasting underlying business performance. Management believes these core measures provide investors additional insights into operational performance as they exclude non-service pension and post-retirement costs, which primarily represent costs driven by market factors and costs not allocable to government contracts. A reconciliation of these non-GAAP measures to the most directly comparable GAAP measure is provided on page 12.
Free Cash Flow
Free cash flow is GAAP operating cash flow reduced by capital expenditures for property, plant and equipment. Management believes free cash flow provides investors with an important perspective on the cash available for shareholders, debt repayment, and acquisitions after making the capital investments required to support ongoing business operations and long term value creation. Free cash flow does not represent the residual cash flow available for discretionary expenditures as it excludes certain mandatory expenditures such as repayment of maturing debt. Management uses free cash flow as a measure to assess both business performance and overall liquidity. See Table 2 on page 2 for a reconciliation of free cash flow to the most directly comparable GAAP measure, operating cash flow.
Caution Concerning Forward-Looking Statements
This press release contains "forward-looking statements" within the meaning of the Private Securities Litigation Reform Act of 1995. Words such as "may," "will," "should," "expects," "intends," "projects," "plans," "believes," "estimates," "targets," "anticipates," and other similar words or expressions, or the negative thereof, generally can be used to help identify these forward-looking statements. Examples of forward-looking statements include statements relating to our future financial condition and operating results, industry projections and outlooks, plans, objectives and goals, as well as any other statement that does not directly relate to any historical or current fact. Forward-looking statements are based on expectations and assumptions that we believe to be reasonable when made, but that may not prove to be accurate.
These statements are not guarantees and are subject to risks, uncertainties, and changes in circumstances that are difficult to predict. Many factors could cause actual results to differ materially and adversely from these forward-looking statements. Among these factors are risks related to: (1) general conditions in the economy and our industry, including those due to regulatory changes and geopolitical developments; (2) our reliance on our commercial airline customers; (3) the overall health of our aircraft production system, production quality issues, commercial airplane production rates, our ability to successfully develop and certify new aircraft or new derivative aircraft, and the ability of our aircraft to meet stringent performance and reliability standards; (4) changing budget and appropriation levels and acquisition priorities of the U.S. government, as well as significant delays in U.S. government appropriations; (5) our dependence on our subcontractors and suppliers, as well as the availability of highly skilled labor and raw materials; (6) work stoppages or other labor disruptions; (7) competition within our markets; (8) our non-U.S. operations and sales to non-U.S. customers, including tariffs, trade restrictions and government actions; (9) changes in accounting estimates; (10) realizing the anticipated benefits of mergers, acquisitions, joint ventures/strategic alliances or divestitures, including anticipated synergies and quality improvements related to our acquisition of Spirit AeroSystems Holdings, Inc.; (11) our dependence on U.S. government contracts; (12) our reliance on fixed-price contracts; (13) our reliance on cost-type contracts; (14) contracts that include in-orbit incentive payments; (15) management of a complex, global IT infrastructure; (16) compromised or unauthorized access to our, our customers' and/or our suppliers' information and systems; (17) potential business disruptions, including threats to physical security or our information technology systems, extreme weather (including effects of climate change) or other acts of nature, and pandemics or other public health crises; (18) potential adverse developments in new or pending litigation and/or government inquiries or investigations; (19) potential environmental liabilities; (20) effects of climate change and legal, regulatory or market responses to such change; (21) credit rating agency actions and our ability to effectively manage our liquidity; (22) substantial pension and other postretirement benefit obligations; (23) the adequacy of our insurance coverage; (24) the dilutive effect of future issuances of our common stock; and (25) the preferential treatment of our 6.00% mandatory convertible preferred stock.
Additional information concerning these and other factors can be found in our filings with the Securities and Exchange Commission, including our most recent Annual Report on Form 10-K, Quarterly Reports on Form 10-Q and Current Reports on Form 8-K. Any forward-looking statement speaks only as of the date on which it is made, and we assume no obligation to update or revise any forward-looking statement, whether as a result of new information, future events, or otherwise, except as required by law.

 View original content: