On October 30, 2026, the Compensation and Human Resources Committee (the “Committee”) of the Board of Directors of Avantor, Inc. (the “Company”) approved a special long-term incentive award for the Company’s Executive Vice President, Chief Legal and Compliance Officer and Secretary, Claudius Sokenu, to recognize his overall performance and contributions to the Company, including his leadership in litigation and regulatory management, dispute resolution and corporate governance. The award was granted on October 31, 2026, and is a grant of 62,305 restricted stock units (“RSUs”) under the Company’s 2019 Equity Incentive Plan (the “Plan”). The RSUs will vest in equal installments on the first three anniversaries of the grant date, subject to Mr. Sokenu’s continued employment with the Company through each applicable vesting date.
|
Avantor, Inc. is a global provider of mission-critical products and services to customers in the biopharma & healthcare, education & government, and advanced technologies & applied materials end markets. The company operates through two primary business segments: Laboratory Solutions and Bioscience Production. Its portfolio includes ultra-high purity chemicals, reagents, lab supplies, filtration systems, analytical instruments, and high-purity silicone materials for medical implants. Avantor serves customers through its VWR distribution channel, which offers millions of SKUs from third-party suppliers and private label products, and through proprietary manufacturing capabilities. Key brands include J.T. Baker for high-purity chemicals, Masterflex for fluid handling systems, and NuSil for medical-grade silicones. The company serves customer locations across the Americas, Europe, and the AMEA region. Avantor was incorporated in 2017 following the acquisition of VWR, with its legacy tracing back to the founding of J.T. Baker Chemical Company in 1904. The company provides value-added services including procurement, logistics, inventory management, and biopharmaceutical material scale-up support. Summarised from the company's own disclosures, fiscal year ended Feb 2026 |
Industry Industrial Distribution | Homepage avantorsciences.com |
| Sector Industrials | IR page ir.avantorsciences.com/overview/default.aspx | |
|
Tags
life sciences, biopharmaceutical, laboratory supplies, high-purity chemicals, medical devices, fluid handling, silicone materials, scientific research, analytical instruments, distribution, VWR, J.T. Baker, Masterflex, NuSil, Avantor Business System, Inventory Manager
|
Press page — |
Metrics
| Valuation | |
|---|---|
| Market cap | $ 10.198B |
| Market cap (USD) | $ 10.198B |
| P/E | 30.10 |
| PEG | — |
| P/BV | 1.75 |
| P/S | 1.54 |
| P/OCF | 17.44 |
| P/FCF | 23.22 |
| Dividend yield | — |
| Turnover / mcap | — |
| Returns | |
|---|---|
| ROE | -9.2% |
| ROI | -5.6% |
| ROIC | -1.9% |
| Profit margin | -8.1% |
| Growth | |
|---|---|
| Revenue growing | No |
| Profits growing | No |
| Revenue up 3y | No |
| Revenue up 5y | No |
| Earnings growth 3y (net profit CAGR) | — |
| Quality | |
|---|---|
| Profitable | No |
| Margin expanding | No |
| Buying back stock | No |
| Diluting (TTM) | No |
| Debt/Equity | 63.1% |
| Podcast bulls (TTM) | Sign up |
| Podcast bears (TTM) | Sign up |
| Podcast sentiment (TTM) | Sign up |
| Podcast sentiment % (TTM) | Sign up |
| News sentiment (TTM) | 16 |
| Quality score | -52.9% |
| Insiders | |
|---|---|
| Buys, 1w | Sign up |
| Buys, 1m | Sign up |
| Buys, 1y | Sign up |
| Sells, 1w | Sign up |
| Sells, 1m | Sign up |
| Sells, 1y | Sign up |
Sign up to see this company's insider trades
Filed figures
Lines the statements and their notes report beside the headline figures, read from the filings' XBRL as filed (no restatement applied), with figures computed from one filing's own lines. Cash-flow lines carry their cash direction: an outflow is negative. Each period links to its filing; a figure's period, report date and tag are in its tooltip.
| Figure | Dec 2016 | Dec 2017 | Dec 2018 | Dec 2019 | Dec 2020 | Dec 2021 | Dec 2022 | Dec 2023 | Dec 2024 | Dec 2025 |
|---|---|---|---|---|---|---|---|---|---|---|
| Balance sheet detail | ||||||||||
| Trade receivables (USD) | — | — | 931M | 989M | 1.11B | 1.22B | 1.22B | 1.15B | 1.03B | 1.07B |
| ↳ YoY growth | +6.2% | +12.6% | +9.8% | -0.3% | -5.6% | -10.1% | +3.9% | |||
| ↳ 5y CAGR | +4.3% | +0.9% | -0.7% | |||||||
| Borrowings, current (USD) | — | — | 142M | 93.5M | 26.4M | 45.2M | 364M | 260M | 821M | 30.8M |
| Borrowings, non-current (USD) | — | — | 6.78B | 5.02B | 4.87B | 6.98B | 5.92B | 5.28B | 3.23B | 3.92B |
| Lease liabilities (USD) | — | — | — | 199M | 133M | 113M | 191M | 193M | 188M | 212M |
| Cash and deposits (USD) | 66M | 189M | 185M | 187M | 287M | 302M | 373M | 263M | 262M | 365M |
| Intangible assets (USD) | — | — | 4.47B | 4.13B | 3.96B | 5.05B | 4.04B | 3.68B | 3.27B | 3.1B |
| Right-of-use assets (USD) | — | — | — | 132M | — | 108M | 119M | 121M | 157M | 165M |
| Net debt (borrowings + leases - cash) (USD) | — | — | 6.74B | 5.13B | 4.74B | 6.83B | 6.11B | 5.47B | 3.98B | 3.79B |
| Cash flow detail | ||||||||||
| Operating cash flow (USD) | — | -168M | 201M | 354M | 930M | 954M | 844M | 870M | 841M | 624M |
| Purchases of property, plant and equipment (USD) | — | -25.2M | -37.7M | -51.6M | -61.6M | -111M | -133M | -146M | -149M | -129M |
| Change in receivables (cash effect) (USD) | — | 14.1M | -83.4M | -68.9M | -102M | -112M | -45.2M | 77M | 45.9M | 13.6M |
| Change in inventories (cash effect) (USD) | — | 19.7M | -41.1M | -71.1M | -69.7M | -130M | -113M | 30.3M | -18.5M | -109M |
| Share buybacks (cash effect) (USD) | — | — | — | — | — | — | — | 0.00 | 0.00 | -75.1M |
| Interest paid (cash effect) (USD) | — | -137M | -481M | -410M | -323M | -187M | -242M | -267M | -211M | -161M |
| Income taxes paid (cash effect) (USD) | — | -31.5M | -65.6M | -112M | -42.7M | -145M | -257M | -224M | -248M | -145M |
| Share-based compensation (USD) | — | 48.2M | 18.4M | 67.9M | 44.1M | 50.7M | 45.8M | 40.5M | 46.8M | 46.4M |
| Operating cash flow before change in receivables (USD) | — | -182M | 284M | 423M | 1.03B | 1.07B | 889M | 793M | 795M | 610M |
| Free cash flow (OCF - PPE - intangibles) (USD) | — | -193M | 163M | 302M | 868M | 843M | 710M | 724M | 692M | 495M |
| Income detail | ||||||||||
| Total comprehensive income (USD) | — | -74.8M | -180M | 18.4M | 224M | 508M | 629M | 352M | 597M | -363M |
| Comprehensive income to owners (USD) | — | -45.4M | -180M | 18.4M | 224M | 508M | 629M | 352M | 597M | -363M |
| Reported | Feb 14, 2020 | Feb 14, 2020 | Feb 14, 2020 | Feb 14, 2020 | Feb 16, 2021 | Feb 14, 2023 | Feb 14, 2023 | Feb 11, 2026 | Feb 11, 2026 | Feb 11, 2026 |
Sign up to see institutional holdings
Sign UpPodcast Mentions
Sign up to see podcast mentions and sentiment
Sign UpMaterial events reported to the SEC on Form 8-K or 6-K, newest first. The link opens the filing itself on EDGAR. Press releases from the company's own website, newest first.
October 28, 2026
-
Net sales of $1,698.3 million; increase of 4.6%; organic increase of 5.2%
-
Diluted GAAP EPS of $0.30; adjusted EPS of $0.22
-
Raised FY 2026 organic revenue growth, adjusted EPS and free cash flow guidance
RADNOR, Pa., Oct. 28, 2026 /PRNewswire/ -- Avantor, Inc. (NYSE: AVTR), a leading global provider of mission-critical products and services to customers in the life sciences and advanced technology industries, reports results that exceeded management's expectations for revenue and adjusted EPS for the third fiscal quarter of 2026.
Emmanuel Ligner, President and Chief Executive Officer, says: "We are delighted to return to year-over-year growth in the third quarter. We are not done with our Revival journey yet, but this achievement reflects the dedication of our associates and the progress we are making to sharpen our strategic focus and improve execution. Third quarter results exceeded our expectations across revenue and adjusted EPS, and we generated robust free cash flow that allowed us to further strengthen our balance sheet.
"VWR Distribution & Services delivered another quarter of improving revenue performance, with organic growth accelerating to 5.8%, and Bioscience & Medtech Products returned to organic growth as expected. We believe that improving execution and stronger end markets provide a foundation for sustained revenue growth, and we remain focused on execution to build on our positive momentum," Ligner concludes.
Third Quarter 2026
For the three months ended September 30, 2026, net sales were $1,698.3 million, which was up 4.6% compared to the third quarter of 2025. Foreign currency translation had a negative impact of 0.6%, resulting in a 5.2% increase in net sales on an organic basis.
Net income increased to $203.4 million from a net loss of $711.8 million in the third quarter of 2025, and net income margin was 12.0%; adjusted net income was $146.4 million compared to $151.1 million in the prior-year period. Adjusted EBITDA was $256.9 million, with an adjusted EBITDA margin of 15.1%.
Operating income was $139.5 million, with an operating income margin of 8.2%; adjusted operating income was $227.6 million, with an adjusted operating income margin of 13.4%.
Diluted earnings per share on a GAAP basis was $0.30, and adjusted diluted earnings per share was $0.22.
Third Quarter 2026 – Segment Results
VWR Distribution & Services
- Net sales were $1,233.8 million, a reported increase of 5.0%, as compared to $1,175.0 million in the third quarter of 2025. Foreign currency translation had a negative impact of 0.8%, resulting in a sales increase of 5.8% on an organic basis.
- Adjusted Operating Income was $119.4 million as compared to $132.0 million in the comparable prior period. Adjusted Operating Income margin was 9.7%. Adjusted Operating Income margin declined versus the prior year due to unfavorable product mix and higher SG&A expenses, partially offset by higher sales volume.
Bioscience & Medtech Products
- Net sales were $464.5 million, a reported increase of 3.5%, as compared to $448.8 million in the third quarter of 2025. Foreign currency translation had a negative impact of 0.1%, resulting in a 3.6% sales increase on an organic basis.
- Adjusted Operating Income was $123.4 million, as compared to $119.3 million in the comparable prior period. Adjusted Operating Income margin was 26.6%. Adjusted Operating Income margin was flat versus the prior year due to higher sales volume and commercial excellence, partially offset by higher SG&A expenses.
Adjusted Operating Income is Avantor's segment reporting profitability measure under generally accepted accounting principles and is used by management to measure and evaluate the performance of our Company's business segments.
Balance Sheet and Cash Flow
As of September 30, 2026, total debt, gross, was $3,699.7 million and cash and cash equivalents were $464.3 million.
GAAP net leverage was 9.6x, and adjusted net leverage was 3.1x, as of September 30, 2026.
For the three months ended September 30, 2026, operating cash flow was $195.1 million, while free cash flow was $156.2 million.
Updated 2026 Guidance
Avantor updates its fiscal 2026 financial guidance.
| Fiscal 2026 guidance(as of July 29, 2026) | Updated Fiscal 2026 guidance(as of October 28, 2026) | |
| Organic revenue growth (1) | -0.5% to +0.5% | +0.75% to +1.25% |
| Adjusted EBITDA margin (1) | 14.8% to 15.3% | 14.8% to 15.3% |
| Adjusted EPS (1) | $0.80 to $0.83 | $0.81 to $0.83 |
| Free cash flow (1)(2) | $500M to $550M | $525M to $550M |
(1) Non-GAAP measure (definitions and/or reconciliations below). We are unable to provide a reconciliation of the non-GAAP measures provided in our full-year 2026 guidance without unreasonable effort because of the difficulty in forecasting and quantifying certain amounts and adjustment items with a reasonable degree of certainty including net income, restructuring charges, foreign currency exchange gains and losses and income tax expense. These amounts are dependent upon future events and may be outside of our control. We note that these items could have a significant impact on our full-year results determined in accordance with GAAP.
(2) Excludes cash restructuring costs.
Fiscal 2026 Assumptions
- Reported revenue growth range is +1.5% to +2.0%, reflecting +0.75% foreign exchange tailwind
- Blended EUR/USD exchange rate of 1.15
- Net interest expense is expected to decline modestly when compared to Fiscal 2025
- Adjusted effective tax rate between 22.0% and 22.5%
- Fully diluted share count of 679M shares
Conference Call
We will host a conference call to discuss our results today, October 28, 2026 at 8:00 a.m. Eastern Time. The live webcast and presentation, as well as a replay, will be available on the investor section of Avantor's website .
About Avantor
Avantor is a leading life science tools company and global provider of mission-critical products and services to the life sciences and advanced technology industries. We work side-by-side with customers at every step of the scientific journey to enable breakthroughs in medicine, healthcare, and technology. Our portfolio is used in virtually every stage of the most important research, development and production activities at more than 300,000 customer locations in 180 countries. For more information, visit corporate.avantorsciences.com and find us on LinkedIn, X (Twitter) and Facebook.
Use of Non-GAAP Financial Measures
To evaluate our performance, we monitor a number of key indicators. As appropriate, we supplement our results of operations determined in accordance with U.S. generally accepted accounting principles ("GAAP") with certain non-GAAP financial measures that we believe are useful to investors, creditors and others in assessing our performance. These measures should not be considered in isolation or as a substitute for reported GAAP results because they may include or exclude certain items as compared to similar GAAP-based measures, and such measures may not be comparable to similarly titled measures reported by other companies. Rather, these measures should be considered as an additional way of viewing aspects of our operations that provide a more complete understanding of our business. We strongly encourage investors to review our consolidated financial statements included in reports filed with the SEC in their entirety and not rely solely on any one single financial measure or communication.
The non-GAAP financial measures used in this press release are sales growth (decline) on an organic basis, Adjusted Operating Income, Adjusted Operating Income margin, Adjusted EBITDA, Adjusted EBITDA margin, adjusted net income, adjusted EPS, adjusted net leverage, free cash flow and free cash flow conversion.
- Organic net sales growth (decline) eliminates from our reported net sales change the impacts of revenues from acquisitions and divestitures that occurred in the last year (as applicable) and changes in foreign currency exchange rates. We believe that this measurement is useful to investors as a way to measure and evaluate our underlying commercial operating performance consistently across our segments and the periods presented. This measure is used by our management for the same reason.
- Adjusted Operating Income is our operating income or loss adjusted for the following items: (i) amortization of acquired intangible assets, (ii) charges associated with the impairment of certain assets, (iii) gain or loss on sale of business, and (iv) certain other adjustments. Adjusted Operating Income margin is Adjusted Operating Income divided by net sales as determined under GAAP. We believe that these measures are useful to investors as ways to analyze the underlying trends in our business consistently across the periods presented. These measures are used by our management for the same reason. Additionally, Adjusted Operating Income is our segment reporting profitability measure under GAAP.
- Adjusted EBITDA is our net income or loss adjusted for the following items: (i) interest expense, (ii) income tax expense, (iii) amortization of acquired intangible assets, (iv) depreciation expense, (v) losses on extinguishment of debt, (vi) charges associated with the impairment of certain assets, (vii) gain or loss on sale of business, and (viii) certain other adjustments. Adjusted EBITDA margin is Adjusted EBITDA divided by net sales as determined under GAAP. We believe that these measures are useful to investors as ways to analyze the underlying trends in our business consistently across the periods presented. These measures are used by our management for the same reason.
- Adjusted net income is our net income or loss first adjusted for the following items: (i) amortization of acquired intangible assets, (ii) losses on extinguishment of debt, (iii) charges associated with the impairment of certain assets, (iv) gain or loss on sale of business, and (v) certain other adjustments. From this amount, we then add or subtract an assumed incremental income tax impact on the above-noted pre-tax adjustments, using estimated tax rates, to arrive at Adjusted Net Income. We believe that this measure is useful to investors as a way to analyze the business consistently across the periods presented. This measure is used by our management for the same reason.
- Adjusted EPS is our adjusted net income divided by our diluted GAAP weighted average share count adjusted for anti-dilutive instruments. We believe that this measure is useful to investors as an additional way to analyze the underlying trends in our business consistently across the periods presented. This measure is used by our management for the same reason.
- Adjusted net leverage is equal to our gross debt, reduced by our cash and cash equivalents, divided by our trailing 12-month Adjusted EBITDA (excluding stock-based compensation expense and including the expected run-rate effect of cost synergies and the incremental results of completed acquisitions and divestitures as if those acquisitions and divestitures had occurred on the first day of the trailing 12-month period). We believe that this measure is useful to investors as a way to evaluate and measure the Company's capital allocation strategies and the underlying trends in the business. This measure is used by our management for the same reason.
- Free cash flow is equal to our cash flows from operating activities, less capital expenditures, plus direct transaction costs and income taxes paid related to acquisitions and divestitures (as applicable) in the period. Free cash flow conversion is free cash flow divided by adjusted net income. We believe that these measures are useful to investors as they provide a view on the Company's ability to generate cash for use in financing or investing activities. These measures are used by our management for the same reason.
Reconciliations of these non-GAAP financial measures to the most directly comparable GAAP financial measures are included in the tables accompanying this release.
Forward-Looking and Cautionary Statements
This press release contains forward-looking statements within the meaning of Section 27A of the Securities Act of 1933 and Section 21E of the Securities Exchange Act of 1934, and are subject to the safe harbor created thereby under the Private Securities Litigation Reform Act of 1995. All statements other than statements of historical fact included in this press release are forward-looking statements. Forward-looking statements discuss our current expectations and projections relating to our financial condition, results of operations, plans, objectives, future performance and business. These statements may be preceded by, followed by or include the words "aim," "anticipate," "assumption," "believe," "continue," "estimate," "expect," "forecast," "goal," "guidance," "intend," "likely," "long-term," "near-term," "objective," "opportunity," "outlook," "plan," "potential," "project," "projection," "prospects," "seek," "target," "trend," "can," "could," "may," "should," "would," "will," the negatives thereof and other words and terms of similar meaning.
Forward-looking statements are inherently subject to risks, uncertainties and assumptions; they are not guarantees of performance. You should not place undue reliance on these statements. We have based these forward-looking statements on our current expectations and projections about future events. Although we believe that our assumptions made in connection with the forward-looking statements are reasonable, we cannot assure you that the assumptions and expectations will prove to be correct. Factors that could contribute to these risks, uncertainties and assumptions include, but are not limited to, the factors described in "Risk Factors" in our most recent Annual Report on Form 10-K, and subsequent quarterly reports on Form 10-Q, as such risk factors may be updated from time to time in our periodic filings with the SEC.
All forward-looking statements attributable to us or persons acting on our behalf are expressly qualified in their entirety by the foregoing cautionary statements. In addition, all forward-looking statements speak only as of the date of this press release. We undertake no obligations to update or revise publicly any forward-looking statements, whether as a result of new information, future events or otherwise other than as required under the federal securities laws.
Investor Relations Contact
Chris Fidyk
Vice President, Investor Relations
Avantor
[email protected]
Global Media Contact
Valerie Collado
Director, External Communications and Community Impact
Avantor
484-885-9338
[email protected]
| Avantor, Inc. and subsidiariesUnaudited condensed consolidated statements of operations | |||||||
| (in millions, except per share data) | Three months endedSeptember 30, | Nine months endedSeptember 30, | |||||
| 2026 | 2025 | 2026 | 2025 | ||||
| Net sales | $ 1,698.3 | $ 1,623.8 | $ 4,972.0 | $ 4,888.6 | |||
| Cost of sales | 1,163.5 | 1,097.3 | 3,399.5 | 3,273.1 | |||
| Gross profit | 534.8 | 526.5 | 1,572.5 | 1,615.5 | |||
| Selling, general and administrative expenses | 395.3 | 390.3 | 1,211.7 | 1,203.1 | |||
| Impairment charges | — | 785.0 | — | 785.0 | |||
| Operating income (loss) | 139.5 | (648.8) | 360.8 | (372.6) | |||
| Interest expense, net | (39.9) | (44.2) | (122.2) | (129.8) | |||
| Loss on extinguishment of debt | (0.8) | (0.2) | (2.0) | (0.2) | |||
| Other (expense) income, net | (0.8) | 3.7 | (1.9) | (19.5) | |||
| Income (loss) before income taxes | 98.0 | (689.5) | 234.7 | (522.1) | |||
| Income tax benefit (expense) | 105.4 | (22.3) | 50.1 | (60.5) | |||
| Net income (loss) | $ 203.4 | $ (711.8) | $ 284.8 | $ (582.6) | |||
| Earnings (loss) per share: | |||||||
| Basic | $ 0.30 | $ (1.04) | $ 0.42 | $ (0.86) | |||
| Diluted | $ 0.30 | $ (1.04) | $ 0.42 | $ (0.86) | |||
| Weighted average shares outstanding: | |||||||
| Basic | 677.1 | 681.7 | 676.3 | 681.4 | |||
| Diluted | 680.9 | 681.7 | 677.7 | 681.4 |
| Avantor, Inc. and subsidiariesUnaudited condensed consolidated balance sheets | |||
| (in millions) | September 30, 2026 | December 31, 2025 | |
| Assets | |||
| Current assets: | |||
| Cash and cash equivalents | $ 464.3 | $ 365.4 | |
| Accounts receivable, net | 1,122.9 | 1,074.6 | |
| Inventory | 854.8 | 818.2 | |
| Other current assets | 150.6 | 193.0 | |
| Total current assets | 2,592.6 | 2,451.2 | |
| Property, plant and equipment, net | 778.9 | 766.8 | |
| Other intangible assets, net | 2,932.3 | 3,193.8 | |
| Goodwill, net | 4,925.9 | 4,986.9 | |
| Other assets | 400.3 | 396.0 | |
| Total assets | $ 11,630.0 | $ 11,794.7 | |
| Liabilities and stockholders' equity | |||
| Current liabilities: | |||
| Current portion of debt | $ 35.0 | $ 30.8 | |
| Accounts payable | 735.4 | 741.7 | |
| Employee-related liabilities | 174.0 | 162.7 | |
| Accrued interest | 31.5 | 47.3 | |
| Other current liabilities | 393.1 | 396.4 | |
| Total current liabilities | 1,369.0 | 1,378.9 | |
| Debt, net of current portion | 3,648.8 | 3,915.5 | |
| Deferred income tax liabilities | 401.9 | 557.1 | |
| Other liabilities | 374.4 | 378.2 | |
| Total liabilities | 5,794.1 | 6,229.7 | |
| Stockholders' equity: | |||
| Common stock including paid-in capital | 4,030.5 | 3,984.8 | |
| Treasury stock at cost | (75.7) | (75.7) | |
| Accumulated earnings | 1,957.6 | 1,672.8 | |
| Accumulated other comprehensive loss | (76.5) | (16.9) | |
| Total stockholders' equity | 5,835.9 | 5,565.0 | |
| Total liabilities and stockholders' equity | $ 11,630.0 | $ 11,794.7 |
| Avantor, Inc. and subsidiariesUnaudited condensed consolidated statements of cash flows | |||||||
| (in millions) | Three months endedSeptember 30, | Nine months endedSeptember 30, | |||||
| 2026 | 2025 | 2026 | 2025 | ||||
| Cash flows from operating activities: | |||||||
| Net income (loss) | $ 203.4 | $ (711.8) | $ 284.8 | $ (582.6) | |||
| Reconciling adjustments: | |||||||
| Depreciation and amortization | 105.3 | 104.5 | 315.9 | 306.9 | |||
| Impairment charges | — | 785.0 | — | 785.0 | |||
| Stock-based compensation expense | 12.5 | 7.2 | 36.5 | 35.1 | |||
| Non-cash restructuring charges | — | — | 5.0 | — | |||
| Provision for accounts receivable and inventory | 19.0 | 16.5 | 46.2 | 43.4 | |||
| Deferred income tax benefit | (147.2) | (11.9) | (141.1) | (41.9) | |||
| Amortization of deferred financing costs | 1.8 | 2.1 | 5.3 | 6.6 | |||
| Loss on extinguishment of debt | 0.8 | 0.2 | 2.0 | 0.2 | |||
| Foreign currency remeasurement loss (gain) | 0.4 | (3.1) | (0.5) | 0.7 | |||
| Pension termination charges | — | — | — | 18.1 | |||
| Changes in assets and liabilities: | |||||||
| Accounts receivable | 12.4 | 66.2 | (68.3) | 10.5 | |||
| Inventory | (44.1) | (33.4) | (90.8) | (66.7) | |||
| Accounts payable | (10.2) | (23.5) | 7.5 | (4.4) | |||
| Accrued interest | (14.7) | (14.8) | (15.8) | (13.4) | |||
| Other assets and liabilities | 54.6 | 25.5 | 42.9 | (27.4) | |||
| Other | 1.1 | (1.3) | 2.4 | 1.0 | |||
| Net cash provided by operating activities | 195.1 | 207.4 | 432.0 | 471.1 | |||
| Cash flows from investing activities: | |||||||
| Capital expenditures | (38.9) | (35.7) | (110.0) | (93.3) | |||
| Other | 0.4 | 2.4 | 1.5 | 2.5 | |||
| Net cash used in investing activities | (38.5) | (33.3) | (108.5) | (90.8) | |||
| Cash flows from financing activities: | |||||||
| Debt borrowings | 54.0 | 67.7 | 54.0 | 67.7 | |||
| Debt repayments | (63.1) | (439.2) | (280.6) | (477.3) | |||
| Proceeds received from exercise of stock options | 12.7 | 2.3 | 14.6 | 4.9 | |||
| Shares repurchased to satisfy employee tax obligations for vested stock-based awards | (1.1) | (0.4) | (5.0) | (5.4) | |||
| Other | (0.7) | — | (0.8) | — | |||
| Net cash provided by (used in) financing activities | 1.8 | (369.6) | (217.8) | (410.1) | |||
| Effect of currency rate changes on cash and cash equivalents | (0.9) | (2.0) | (6.8) | 19.8 | |||
| Net change in cash, cash equivalents and restricted cash | 157.5 | (197.5) | 98.9 | (10.0) | |||
| Cash, cash equivalents and restricted cash, beginning of period | 309.7 | 452.2 | 368.3 | 264.7 | |||
| Cash, cash equivalents and restricted cash, end of period | $ 467.2 | $ 254.7 | $ 467.2 | $ 254.7 |
| Avantor, Inc. and subsidiariesReconciliations of non-GAAP measures | |||||||||||||||
| Adjusted EBITDA and Adjusted EBITDA Margin | |||||||||||||||
| (dollars in millions, % based on net sales) | Three months ended September 30, | Nine months ended September 30, | |||||||||||||
| 2026 | 2025 | 2026 | 2025 | ||||||||||||
| $ | % | $ | % | $ | % | $ | % | ||||||||
| Net income (loss) | $ 203.4 | 12.0 % | $ (711.8) | (43.8) % | $ 284.8 | 5.7 % | $ (582.6) | (11.9) % | |||||||
| Amortization | 75.5 | 4.4 % | 76.1 | 4.7 % | 227.1 | 4.6 % | 225.5 | 4.6 % | |||||||
| Loss on extinguishment of debt | 0.8 | — % | 0.2 | — % | 2.0 | — % | 0.2 | — % | |||||||
| Restructuring, severance, and related impairment charges1 | 8.1 | 0.5 % | 2.2 | 0.1 % | 47.2 | 0.9 % | 28.0 | 0.6 % | |||||||
| Transformation expenses2 | — | — % | 13.7 | 0.8 % | — | — % | 49.5 | 1.0 % | |||||||
| Reserve for certain legal matters, net3 | 1.3 | 0.1 % | 1.6 | 0.1 % | 4.7 | 0.1 % | 5.2 | 0.1 % | |||||||
| Other4 | 3.5 | 0.2 % | 7.8 | 0.5 % | 3.9 | 0.1 % | 18.5 | 0.4 % | |||||||
| Pension termination charges5 | — | — % | (1.8) | (0.1) % | — | — % | 16.3 | 0.3 % | |||||||
| Impairment charges6 | — | — % | 785.0 | 48.3 % | — | — % | 785.0 | 16.1 % | |||||||
| Income tax benefit applicable to pretax adjustments | (146.2) | (8.6) % | (21.9) | (1.3) % | (166.0) | (3.3) % | (78.0) | (1.6) % | |||||||
| Adjusted net income | 146.4 | 8.6 % | 151.1 | 9.3 % | 403.7 | 8.1 % | 467.6 | 9.6 % | |||||||
| Interest expense, net | 39.9 | 2.4 % | 44.2 | 2.7 % | 122.2 | 2.6 % | 129.8 | 2.7 % | |||||||
| Depreciation | 29.8 | 1.7 % | 28.4 | 1.8 % | 88.8 | 1.7 % | 81.4 | 1.7 % | |||||||
| Income tax provision applicable to Adjusted net income | 40.8 | 2.4 % | 44.2 | 2.7 % | 115.9 | 2.3 % | 138.5 | 2.7 % | |||||||
| Adjusted EBITDA | $ 256.9 | 15.1 % | $ 267.9 | 16.5 % | $ 730.6 | 14.7 % | $ 817.3 | 16.7 % |
| ____________________ | |
| 1. | Reflects charges incurred during the period related to restructuring initiatives to increase profitability and productivity. Costs included in this caption consist of employee severance, site-exit and contract termination costs, and non-cash impairment charges on long-lived assets associated with site exits. |
| 2. | Represents incremental expenses directly associated with the Company's former cost transformation initiative, which concluded in 2025. These expenses are primarily related to the cost of external advisors. |
| 3. | Represents charges and legal costs, net of recoveries, incurred in connection with certain litigation and other contingencies that management evaluates separately from core operating performance. |
| 4. | Represents net foreign currency (gain) loss from financing activities, other stock-based compensation expense (benefit) and certain other items that management evaluates separately from core operating performance. The 2025 periods also include a purchase price adjustment related to the 2024 sale of our Clinical Services business and $6.1 million of severance and transition costs associated with the replacement of our Chief Executive Officer. |
| 5. | Represents pension termination charges related to termination of our U.S. Pension Plan. |
| 6. | Represents the $785.0 million non-cash goodwill impairment charge recognized in the third quarter of 2025 related to the former Distribution reporting unit. |
| Avantor, Inc. and subsidiaries Reconciliations of non-GAAP measures (continued) | |||||||||||||||
| Adjusted Operating Income and Adjusted Operating Income Margin | |||||||||||||||
| (dollars in millions, % based on net sales) | Three months ended September 30, | Nine months ended September 30, | |||||||||||||
| 2026 | 2025 | 2026 | 2025 | ||||||||||||
| $ | % | $ | % | $ | % | $ | % | ||||||||
| Net income (loss) | $ 203.4 | 12.0 % | $ (711.8) | (43.8) % | $ 284.8 | 5.7 % | $ (582.6) | (11.9) % | |||||||
| Interest expense, net | 39.9 | 2.4 % | 44.2 | 2.7 % | 122.2 | 2.6 % | 129.8 | 2.7 % | |||||||
| Income tax (benefit) expense | (105.4) | (6.2) % | 22.3 | 1.4 % | (50.1) | (1.0) % | 60.5 | 1.1 % | |||||||
| Loss on extinguishment of debt | 0.8 | — % | 0.2 | — % | 2.0 | — % | 0.2 | — % | |||||||
| Other (expense) income, net | 0.8 | — % | (3.7) | (0.3) % | 1.9 | — % | 19.5 | 0.5 % | |||||||
| Operating income (loss) | 139.5 | 8.2 % | (648.8) | (40.0) % | 360.8 | 7.3 % | (372.6) | (7.6) % | |||||||
| Amortization | 75.5 | 4.4 % | 76.1 | 4.7 % | 227.1 | 4.6 % | 225.5 | 4.6 % | |||||||
| Restructuring, severance, and related impairment charges1 | 8.1 | 0.5 % | 2.2 | 0.1 % | 47.2 | 0.9 % | 28.0 | 0.6 % | |||||||
| Transformation expenses2 | — | — % | 13.7 | 0.8 % | — | — % | 49.5 | 1.0 % | |||||||
| Reserve for certain legal matters, net3 | 1.3 | 0.1 % | 1.6 | 0.1 % | 4.7 | 0.1 % | 5.2 | 0.1 % | |||||||
| Other4 | 3.2 | 0.2 % | 7.5 | 0.6 % | 3.5 | — % | 11.7 | 0.2 % | |||||||
| Impairment charges5 | — | — % | 785.0 | 48.3 % | — | — % | 785.0 | 16.1 % | |||||||
| Adjusted Operating Income | $ 227.6 | 13.4 % | $ 237.3 | 14.6 % | $ 643.3 | 12.9 % | $ 732.3 | 15.0 % |
| ____________________ | |
| 1. | Reflects charges incurred during the period related to restructuring initiatives to increase profitability and productivity. Costs included in this caption consist of employee severance, site-exit and contract termination costs, and non-cash impairment charges on long-lived assets associated with site exits. |
| 2. | Represents incremental expenses directly associated with the Company's former cost transformation initiative, which concluded in 2025. These expenses are primarily related to the cost of external advisors. |
| 3. | Represents charges and legal costs, net of recoveries, incurred in connection with certain litigation and other contingencies that management evaluates separately from core operating performance. |
| 4. | Represents other stock-based compensation expense (benefit) and certain other items that management evaluates separately from core operating performance. The 2025 periods also include a purchase price adjustment related to the 2024 sale of our Clinical Services business and $6.1 million of severance and transition costs associated with the replacement of our Chief Executive Officer. |
| 5. | Represents the $785.0 million non-cash goodwill impairment charge recognized in the third quarter of 2025 related to the former Distribution reporting unit. |
| Avantor, Inc. and subsidiariesReconciliations of non-GAAP measures (continued) | |||||||
| Adjusted earnings per share | |||||||
| (shares in millions) | Three months endedSeptember 30, | Nine months endedSeptember 30, | |||||
| 2026 | 2025 | 2026 | 2025 | ||||
| Diluted earnings (loss) per share (GAAP) | $ 0.30 | $ (1.04) | $ 0.42 | $ (0.86) | |||
| Amortization | 0.11 | 0.11 | 0.34 | 0.33 | |||
| Loss on extinguishment of debt | — | — | — | — | |||
| Restructuring, severance, and related impairment charges | 0.01 | — | 0.07 | 0.04 | |||
| Transformation expenses | — | 0.02 | — | 0.07 | |||
| Reserve for certain legal matters, net | — | — | 0.01 | 0.01 | |||
| Other | 0.01 | 0.01 | — | 0.04 | |||
| Pension termination charges | — | — | — | 0.02 | |||
| Impairment charges | — | 1.15 | — | 1.15 | |||
| Income tax benefit applicable to pretax adjustments | (0.21) | (0.03) | (0.24) | (0.11) | |||
| Adjusted EPS (non-GAAP) | $ 0.22 | $ 0.22 | $ 0.60 | $ 0.69 | |||
| Weighted average diluted shares outstanding: | |||||||
| Share count for Adjusted EPS (non-GAAP) | 680.9 | 681.7 | 677.7 | 681.4 | |||
| Free cash flow | |||||||
| (in millions) | Three months endedSeptember 30, | Nine months endedSeptember 30, | |||||
| 2026 | 2025 | 2026 | 2025 | ||||
| Net cash provided by operating activities | $ 195.1 | $ 207.4 | $ 432.0 | $ 471.1 | |||
| Capital expenditures | (38.9) | (35.7) | (110.0) | (93.3) | |||
| Divestiture-related transaction expenses and taxes paid | — | — | 2.2 | 1.4 | |||
| Free cash flow (non-GAAP) | $ 156.2 | $ 171.7 | $ 324.2 | $ 379.2 |
| GAAP net leverage | |
| (dollars in millions) | September 30,2026 |
| Total debt, gross | $ 3,699.7 |
| Less cash and cash equivalents | (464.3) |
| $ 3,235.4 | |
| Trailing twelve months net income | $ 337.2 |
| GAAP net leverage | 9.6 x |
| Adjusted net leverage | |
| (dollars in millions) | September 30,2026 |
| Total debt, gross | $ 3,699.7 |
| Less cash and cash equivalents | (464.3) |
| $ 3,235.4 | |
| Trailing twelve months Adjusted EBITDA | $ 982.7 |
| Trailing twelve months ongoing stock-based compensation expense | 47.5 |
| $ 1,030.2 | |
| Adjusted net leverage (non-GAAP) | 3.1 x |
| Avantor, Inc. and subsidiaries Reconciliations of non-GAAP measures (continued) | |||||||||
| Net sales by segment | |||||||||
| (in millions) | September 30, | Reconciliation of net sales growth(decline) to organic net sales growth(decline) | |||||||
| Net salesgrowth(decline) | Foreigncurrencyimpact | Organicnet salesgrowth(decline) | |||||||
| 2026 | 2025 | ||||||||
| $ | $ | $ | $ | $ | |||||
| Three months ended: | |||||||||
| Bioscience & Medtech Products | $ 464.5 | $ 448.8 | $ 15.7 | $ (0.6) | $ 16.3 | ||||
| VWR Distribution & Services | 1,233.8 | 1,175.0 | 58.8 | (9.0) | 67.8 | ||||
| Total | $ 1,698.3 | $ 1,623.8 | $ 74.5 | $ (9.6) | $ 84.1 | ||||
| Nine months ended: | |||||||||
| Bioscience & Medtech Products | $ 1,347.7 | $ 1,351.1 | $ (3.4) | $ 15.7 | $ (19.1) | ||||
| VWR Distribution & Services | 3,624.3 | 3,537.5 | 86.8 | 54.7 | 32.1 | ||||
| Total | $ 4,972.0 | $ 4,888.6 | $ 83.4 | $ 70.4 | $ 13.0 | ||||
| (dollars in millions, % based on net sales) | September 30, | Reconciliation of net sales growth(decline) to organic net sales growth(decline) | |||||||
| Net salesgrowth(decline) | Foreigncurrencyimpact | Organicnet salesgrowth(decline) | |||||||
| 2026 | 2025 | ||||||||
| $ | $ | % | % | % | |||||
| Three months ended: | |||||||||
| Bioscience & Medtech Products | $ 464.5 | $ 448.8 | 3.5 % | (0.1) % | 3.6 % | ||||
| VWR Distribution & Services | 1,233.8 | 1,175.0 | 5.0 % | (0.8) % | 5.8 % | ||||
| Total | $ 1,698.3 | $ 1,623.8 | 4.6 % | (0.6) % | 5.2 % | ||||
| Nine months ended: | |||||||||
| Bioscience & Medtech Products | $ 1,347.7 | $ 1,351.1 | (0.3) % | 1.1 % | (1.4) % | ||||
| VWR Distribution & Services | 3,624.3 | 3,537.5 | 2.5 % | 1.6 % | 0.9 % | ||||
| Total | $ 4,972.0 | $ 4,888.6 | 1.7 % | 1.4 % | 0.3 % |
| Adjusted Operating Income by segment | |||||||||||||||
| (dollars in millions, %represent AdjustedOperating Income margin) | Three months ended September 30, | Nine months ended September 30, | |||||||||||||
| 2026 | 2025 | 2026 | 2025 | ||||||||||||
| $ | % | $ | % | $ | % | $ | % | ||||||||
| Bioscience & MedtechProducts | $ 123.4 | 26.6 % | $ 119.3 | 26.6 % | $ 343.7 | 25.5 % | $ 365.2 | 27.0 % | |||||||
| VWR Distribution &Services | 119.4 | 9.7 % | 132.0 | 11.2 % | 351.2 | 9.7 % | 421.5 | 11.9 % | |||||||
| Corporate | (15.2) | — % | (14.0) | — % | (51.6) | — % | (54.4) | — % | |||||||
| Total | $ 227.6 | 13.4 % | $ 237.3 | 14.6 % | $ 643.3 | 12.9 % | $ 732.3 | 15.0 % |
 View original content to download multimedia:https://www.prnewswire.com/news-releases/avantor-reports-third-quarter-2026-results-302921384.html
SOURCE Avantor and Financial News
Quick Links
Investor Contact
Chris Fidyk
Vice President, Investor Relations
[email protected]
Mailing Address
Radnor Corporate Center
100 Matsonford Road
Bldg 1 Ste 200
P.O. Box 6660,
Radnor, PA 19087
Investor Email Alerts
To opt-in for investor email alerts, please enter your email address in the field below and select at least one alert option. After submitting your request, you will receive an activation email to the requested email address. You must click the activation link in order to complete your subscription. You can sign up for additional alert options at any time.
At Avantor, Inc., we promise to treat your data with respect and will not share your information with any third party. You can unsubscribe to any of the investor alerts you are subscribed to by visiting the ‘unsubscribe’ section below. If you experience any issues with this process, please contact us for further assistance.
By providing your email address below, you are providing consent to Avantor, Inc. to send you the requested Investor Email Alert updates.
* Required
Email Address *
Investor Alert OptionsInvestor Alert Options *
| News |
| Quarterly Reports |
| Annual Reports |
| SEC Filings |
| End of Day Stock Quote |
| Events & Presentations |
Submit Submit
Email Alert Sign Up Confirmation
Avantor® is a leading life science tools company and global provider of mission-critical products and services to the life sciences and advanced technology industries. We work side-by-side with customers at every step of the scientific journey to enable breakthroughs in medicine, healthcare, and technology. Our portfolio is used in virtually every stage of the most important research, development and production activities at more than 300,000 customer locations in 180 countries. For more information, visit corporate.avantorsciences.com and find us on LinkedIn , X (Twitter) and Facebook.

Customer Support
Work With Avantor
Investors
Careers
Terms and Conditions
Do Not Share My Personal Information
© 2026 Avantor, Inc.
© 2026 FORTUNE Media IP Limited All rights reserved. Used under license.
October 26, 2026
RADNOR, Pa., Oct. 26, 2026 /PRNewswire/ -- Avantor, Inc. (NYSE: AVTR), a leading global provider of mission-critical products and services to customers in the life sciences and advanced technology industries, welcomes Mikey Santiago as its new Chief Information Officer.

In this role, Mikey will lead Avantor's global information technology strategy, advancing the company's digital transformation agenda while supporting growth, operational excellence, customer experience, and innovation across the enterprise.
Emmanuel Ligner, President and CEO, Avantor, says: "Mikey brings an exceptional combination of business knowledge, technology leadership, and a proven ability to execute transformation at scale. With Mikey's experience in complex integrations, modernization efforts and AI-driven innovation, he will help position Avantor for the future."
Mikey joins Avantor with more than two decades of technology leadership experience, including serving as a four-time CIO and holding senior leadership roles within the Danaher Corporation and its operating companies. Throughout his career, he has led enterprise-wide digital transformations, major acquisitions and integrations, cloud modernization programs, cybersecurity initiatives, and the deployment of advanced analytics and AI capabilities that have delivered significant business impact.
Mikey Santiago says: "I am excited to join Avantor and contribute to the next chapter of its growth and transformation. By aligning technology, data, and digital capabilities with business strategy, we have an opportunity to create meaningful value for our customers and strengthen our impact on the customers and communities we serve. I look forward to working with talented colleagues across the organization and leading a team committed to innovation, collaboration, and results."
Mikey holds a master of business administration from University of Southern California, completed graduate studies in computer science and cognitive science at University of California, San Diego, and holds bachelor degrees in computer science and mathematics from California State University.
Meet Avantor's full leadership team here .
**About Avantor
**Avantor® is a leading life science tools company and global provider of mission-critical products and services to the life sciences and advanced technology industries. We work side-by-side with customers at every step of the scientific journey to enable breakthroughs in medicine, healthcare, and technology. Our portfolio is used in virtually every stage of the most important research, development and production activities at more than 300,000 customer locations in 180 countries. For more information, visit avantorsciences.com
and find us on LinkedIn
, X (Twitter)
and Facebook
.
**Investors:
**[email protected]
**Media Inquiries:
**[email protected]
 View original content to download multimedia:https://www.prnewswire.com/news-releases/avantor-appoints-new-chief-information-officer-302918948.html
SOURCE Avantor and Financial News
Quick Links
Investor Contact
Chris Fidyk
Vice President, Investor Relations
[email protected]
Mailing Address
Radnor Corporate Center
100 Matsonford Road
Bldg 1 Ste 200
P.O. Box 6660,
Radnor, PA 19087
Investor Email Alerts
To opt-in for investor email alerts, please enter your email address in the field below and select at least one alert option. After submitting your request, you will receive an activation email to the requested email address. You must click the activation link in order to complete your subscription. You can sign up for additional alert options at any time.
At Avantor, Inc., we promise to treat your data with respect and will not share your information with any third party. You can unsubscribe to any of the investor alerts you are subscribed to by visiting the ‘unsubscribe’ section below. If you experience any issues with this process, please contact us for further assistance.
By providing your email address below, you are providing consent to Avantor, Inc. to send you the requested Investor Email Alert updates.
* Required
Email Address *
Investor Alert OptionsInvestor Alert Options *
| News |
| Quarterly Reports |
| Annual Reports |
| SEC Filings |
| End of Day Stock Quote |
| Events & Presentations |
Submit Submit
Email Alert Sign Up Confirmation
Avantor® is a leading life science tools company and global provider of mission-critical products and services to the life sciences and advanced technology industries. We work side-by-side with customers at every step of the scientific journey to enable breakthroughs in medicine, healthcare, and technology. Our portfolio is used in virtually every stage of the most important research, development and production activities at more than 300,000 customer locations in 180 countries. For more information, visit corporate.avantorsciences.com and find us on LinkedIn , X (Twitter) and Facebook.
Customer Support
Work With Avantor
Investors
Careers
Terms and Conditions
Do Not Share My Personal Information
© 2026 Avantor, Inc.
© 2026 FORTUNE Media IP Limited All rights reserved. Used under license.

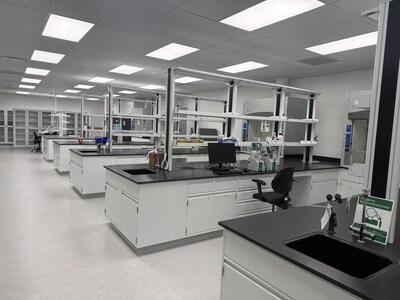
 Located near Avantor’s chromatography column manufacturing site in Reading, UK, the 4,000‑sq. ft. Centre of Excellence brings together R&D, technical support, product management, and applications teams in a single facility. The site includes dedicated research and customer demonstration labs, consolidating expertise that was previously distributed across multiple European locations.
 Behind the scenes, the new facility also supports greater manufacturing efficiency for key Avantor chromatography brands, including ACE®, Vydac® and Alltima®. By relocating technical and R&D teams out of the existing manufacturing site, Avantor has freed up capacity to expand chromatography production, improve quality control workflows, and strengthen supply reliability.


 View original content to download multimedia:

 View original content to download multimedia:


 View original content to download multimedia:

 View original content to download multimedia:

 View original content to download multimedia:

 View original content to download multimedia:
 View original content to download multimedia:
 View original content to download multimedia:


 View original content to download multimedia:
 View original content to download multimedia:
 View original content to download multimedia:
 View original content to download multimedia:
 View original content to download multimedia:
 View original content to download multimedia:
Prompts
Click prompts to add them under the company line, click again to take one out, then copy the result into your AI chat. Shared by Asian Century Stocks and Uncovered Thai Stocks. Thank you.
Company History
Name and ticker changes, and re-registrations under a new regulatory id. When a ticker stopped being used is not recorded, so former tickers are undated.
| Date | Change | Detail |
|---|---|---|
| Feb 8, 2019 | Renamed | Vail Holdco Corp → AVANTOR, INC. |
ETFs Holding Avantor, Inc.
Exchange-traded funds whose newest published daily portfolio holds one of the company's listings, largest weight first.
| ETF | Weight in ETF | Shares | Market value | As of |
|---|---|---|---|---|
| PINK | 3.90% | 859,446 | $ 13.046M | Nov 17, 2026 |
| EPSB | 2.00% | 9,710 | $ 150.893K | Nov 13, 2026 |
| LSEQ | 0.80% | 8,294 | $ 128.889K | Nov 13, 2026 |
| FPAG | 0.65% | 355,906 | $ 3.523M | Jun 30, 2026 |
| DFSV | 0.60% | 10,631,455 | $ 166.063M | Nov 12, 2026 |
| BTAL short | -0.46% | -132,572 | $ -1.312M | Jun 30, 2026 |
| DFAT | 0.29% | 5,905,730 | $ 92.248M | Nov 12, 2026 |
| VFVA | 0.22% | 145,932 | $ 2.122M | Aug 31, 2026 |
| JMEE | 0.21% | 392,618 | $ 5.96M | Nov 17, 2026 |
| DFAS | 0.17% | 3,615,484 | $ 56.474M | Nov 12, 2026 |
| REMC | 0.15% | 513 | $ 5,078.70 | Jun 30, 2026 |
| MSSM | 0.08% | 39,522 | $ 574.65K | Aug 31, 2026 |
| AVMC | 0.08% | 27,173 | $ 416.29K | Nov 16, 2026 |
| FTLS short | -0.07% | -117,494 | $ 0.00 | Nov 16, 2026 |
| SMDX | 0.06% | 4,892 | $ 74.945K | Nov 17, 2026 |
| DFSU | 0.04% | 61,289 | $ 957.334K | Nov 12, 2026 |
| IALT short | -0.04% | -210,407 | $ -3.223M | Nov 16, 2026 |
| DFAC | 0.02% | 1,199,155 | $ 18.731M | Nov 12, 2026 |
| AVLC | 0.02% | 20,330 | $ 311.456K | Nov 16, 2026 |
| DFAU | 0.02% | 161,839 | $ 2.528M | Nov 12, 2026 |
| DXUV | 0.02% | 72,433 | $ 1.131M | Nov 12, 2026 |
| DFUS | 0.01% | 204,490 | $ 3.194M | Nov 12, 2026 |
| VSLU | 0.01% | 7,447 | $ 73.725K | Jun 30, 2026 |
| DCOR | 0.01% | 348,505 | $ 5.444M | Nov 12, 2026 |
| AVUS | 0.01% | 64,309 | $ 985.214K | Nov 16, 2026 |
| AVSU | 0.01% | 2,226 | $ 34.102K | Nov 16, 2026 |
| DFUV | 0.00% | 22,958 | $ 358.604K | Nov 12, 2026 |
| EBI | 0.00% | 380 | $ 5,525.20 | Aug 31, 2026 |
| NTRL short | 0.00% | -9,296 | $ 0.00 | Nov 16, 2026 |