September 14, 2026 Avient will highlight its latest simulation-ready design tools, enhanced thermoplastic tape portfolio, and advanced long fiber composite solutions at CAMX 2026, Sept. 22-24. To download a high-resolution image, please click here:…
September 14, 2026
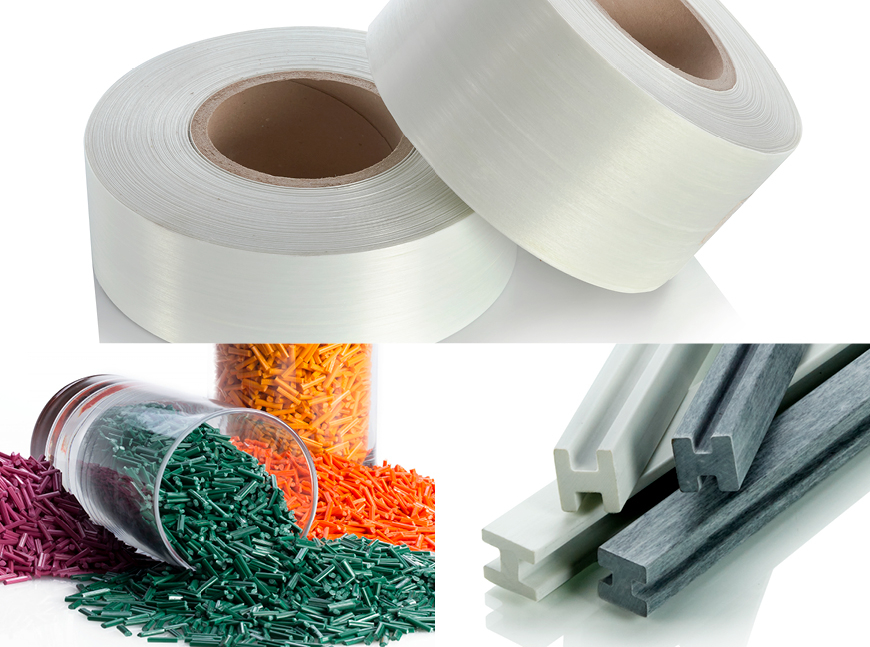
Avient will highlight its latest simulation-ready design tools, enhanced thermoplastic tape portfolio, and advanced long fiber composite solutions at CAMX 2026, Sept. 22-24.
To download a high-resolution image, please click here: FOR MEDIA USE ONLY
Key Highlights
- New simulation-ready material cards accelerate material selection and shorten prototyping cycles to increase speed to market
- Expanded Polystrand™ tape portfolio adds nylon 6, PET, and HDPE grades to help engineers evaluate materials earlier in the design process
- Adaptive carbon fiber reinforced geopolymer composites for extreme thermal environments named finalist for Award for Composites Excellence (ACE) for Most Creative Application
- Avient Senior Technology Manager recognized with ACMA Pioneer Award
ATLANTA – September 14, 2026 – Avient Corporation, an innovator of materials solutions, will unveil new simulation-ready material cards and an enhanced Polystrand™ thermoplastic tape portfolio at the Composites and Advanced Materials Expo (CAMX) 2026, giving engineers earlier access to performance data for structural composite design. Engineers, designers, and original equipment manufacturers (OEMs) in markets including transportation, data centers, infrastructure, and outdoor recreation can explore Avient's full portfolio of advanced composite materials and solutions at Booth Y20.
The Shift to Thermoplastic Composites in Structural Design
Continuous fiber reinforced thermoplastic composites are replacing traditional metals and thermoset composites in structural applications where weight reduction, circularity, and faster cycle times matter. As automotive lightweighting mandates tighten and infrastructure modernization accelerates, engineers need reliable material data earlier in the design process to make informed decisions without costly physical prototyping. Avient’s new simulation-ready material cards address this need by bringing comprehensive performance datasets directly into the tools engineers already use.
How Avient Can Help Solve the Problem
Engineers evaluating thermoplastic composites often face a gap between design simulation and physical material performance. Avient’s new material cards for its polypropylene-based, E-glass continuous fiber reinforced thermoplastic unidirectional (UD) tapes bridge this gap. Compatible with Simutence simulation software (SimuQuick, SimuWarp and SimuDrape) and finite element analysis (FEA) platforms, these cards provide comprehensive datasets covering glass content from 60–70%. Development teams can evaluate materials earlier, benchmark options, and shorten prototyping cycles before committing to physical builds.
"We're helping customers remove barriers between design and production. By combining simulation-ready material data with proven composite technologies, Avient enables engineers to evaluate options earlier, reduce costly iterations, and accelerate the path from idea to finished product. That's the value we're excited to showcase at CAMX," said Tonya DeMarco, Sales Director, Advanced Composites at Avient.
The Polystrand™ and Complēt™ Portfolios
Avient will display its full advanced composites portfolio at Booth Y20, including:
- NEW – Polystrand Material Cards for Simulation Software: Simulation-ready material cards for polypropylene-based, E-glass UD tapes at 60–70% glass content; compatible with Simutence software and FEA platforms to accelerate material selection and shorten prototyping cycles.
- NEW – Polystrand Nylon 6 Thermoplastic Tapes: PA6 resin matrix at 50–70% glass fiber content; widths from 2” to 25” with laminates spanning 50” to 120” for structural components in transportation and consumer goods.
- NEW – Polystrand PET and HDPE Tapes: PET tapes maintain full mechanical properties up to 185°F for infrastructure and building applications; HDPE tapes deliver up to 20% improved tensile strength for high-load applications such as pipe reinforcement and structural decking.
- ENHANCED – Complēt Long Fiber Reinforced Thermoplastic Portfolio: Premium formulations with enhanced ultraviolet (UV) performance in pre-color, single-pellet options for color stability and gloss retention; Complēt Moisture Resistant Nylons in PA6 and PA66 matrices support lightweighting in automotive and powersports applications.
Avient Named ACE Finalist for Most Creative Application
Avient has been named a finalist for the Awards for Composites Excellence (ACE) in the Most Creative Application category for its adaptive carbon fiber reinforced geopolymer composites for extreme thermal environments. This breakthrough technology combines carbon fiber reinforcement with a proprietary geopolymer matrix to create lightweight, durable structures capable of maintaining performance in extreme thermal environments where traditional polymer composites reach their limits. The material can be engineered to provide customized thermal conductivity/insulative performance, enabling solutions across aerospace, defense, energy, industrial processing, transportation, and infrastructure applications.
"Being recognized as an ACE finalist reflects our team's commitment to solving some of the industry's most challenging thermal performance problems through innovation and materials science. This technology provides engineers with a practical and cost-effective pathway to achieve high-temperature performance, expanding design possibilities in applications where conventional materials often fall short," said Amit Kulkarni, Vice President, Innovation, at Avient.
By bridging the performance gap between conventional polymer composites and premium carbon-carbon or carbon-ceramic systems, this innovation offers a unique combination of thermal resilience, lightweighting, design flexibility, and system-level economics, opening new opportunities for next-generation applications.
Lei Zhao Recognized with ACMA Pioneer Award
Avient celebrates Lei Zhao, Senior Technology Manager, Advanced Composites at Avient, recipient of the Pioneer Award by the American Composites Manufacturers Association (ACMA). The award celebrates those who move the composites industry forward through practical innovation, technical skill, and a commitment to excellence.
"Lei's hands-on expertise and dedication have advanced not only our team but the broader composites industry. The Pioneer Award recognizes the kind of practical innovation that drives real progress, and we are proud to see Lei honored for his contributions,” said Tom Taylor, General Manager, Advanced Composites at Avient.
Avient at CAMX 2026
Avient is exhibiting at Booth Y20 at CAMX, held at the Georgia World Congress Center in Atlanta, September 22–24.
- The ACE Awards presentation will take place on Tuesday, September 22, at 2:00 p.m. ET in the ACE Pavilion, Booth T62.
- Avient will have a table display at the ACE Pavilion showcasing its carbon fiber reinforced geopolymer composites.
- View the company’s full composites portfolio here
.
About Avient
Our purpose at Avient Corporation (NYSE: AVNT) is to be an innovator of materials solutions to help our customers succeed, while enabling a sustainable world. Our local touch and customer engagement, combined with our global presence, allows us to serve customers with agility. We harness the collective strength of more than 9,000 employees worldwide to collaborate and build on each other’s ideas. In doing so, we innovate solutions that help our customers overcome their challenges or capitalize on opportunities provided by the fast-changing world and secular trends. Our expanding portfolio of offerings includes colorants, advanced composites, functional additives, engineered materials, and Dyneema®, the world’s strongest fiber™. By intersecting our broad portfolio of technologies with the product roadmaps of our customers, we help create differentiated and high-performance products that make the world better and more sustainable. Visit www.avient.com
to learn more.
Media Contact
Nicole DeChant
Avient Corporation
[email protected]
To News Center
Press Resources
Investor News
Nov 04, 2026
Avient Announces Third Quarter 2026 Results Ahead of Expectations; Increases Full-Year Adjusted EPS Guidance Range... More
Oct 14, 2026
Avient Names George T. Clark Director of Investor Relations... More
Oct 09, 2026
Avient Appoints Mike Frank as Chief Executive Officer... More
Investor Center
SEARCH INVESTOR NEWS
November, 2026 September, 2026 August, 2026 July, 2026 June, 2026 May, 2026 April, 2026 February, 2026 January, 2026 December, 2025 November, 2025 October, 2025 September, 2025 August, 2025 July, 2025 May, 2025 April, 2025 March, 2025 February, 2025 January, 2025 December, 2024 November, 2024 October, 2024 September, 2024 August, 2024 July, 2024 June, 2024 May, 2024 April, 2024 March, 2024 February, 2024 January, 2024 December, 2023 November, 2023 October, 2023 September, 2023 August, 2023 July, 2023 June, 2023 May, 2023 April, 2023 March, 2023 February, 2023 January, 2023 December, 2022 November, 2022 October, 2022 September, 2022 June, 2022 May, 2022 April, 2022 March, 2022 February, 2022 January, 2022 December, 2021 November, 2021 October, 2021 September, 2021 August, 2021 July, 2021 June, 2021 May, 2021 April, 2021 March, 2021 February, 2021 January, 2021 December, 2020 November, 2020 October, 2020 September, 2020 August, 2020 July, 2020 June, 2020 May, 2020 April, 2020 February, 2020 January, 2020 October, 2019 September, 2019 August, 2019 July, 2019 June, 2019 May, 2019 April, 2019 March, 2019 February, 2019 January, 2019 December, 2018 November, 2018 October, 2018 September, 2018 August, 2018 June, 2018 May, 2018 April, 2018 March, 2018 February, 2018 January, 2018 December, 2017 October, 2017 September, 2017 July, 2017 May, 2017 April, 2017 March, 2017 February, 2017 January, 2017 December, 2016 November, 2016 October, 2016 September, 2016 July, 2016 June, 2016 May, 2016 April, 2016 March, 2016 February, 2016 January, 2016 December, 2015 November, 2015 October, 2015 September, 2015 August, 2015 July, 2015 June, 2015 May, 2015 April, 2015 March, 2015 February, 2015 January, 2015 December, 2014 November, 2014 October, 2014 September, 2014 August, 2014 July, 2014 June, 2014 May, 2014 April, 2014 March, 2014 February, 2014 January, 2014
Search by Month
Search
Footer Top
Language



Footer
© 2015 – 2026. Avient Corporation. All Rights Reserved. Copyright & Legal Disclaimer.
| Privacy Statement
| California Privacy Rights
| Email Fraud Information
| Site Map
| Web Design & Development by Upward Brand Interactions