Share

3Q26 Sales of $431 million, up 15% versus prior year
3Q26 Earnings Per Share of ($0.28); Adjusted Earnings Per Share of ($0.24)
3Q26 Cash Flow from Operations of $48 million, up $21 million versus prior year
Project CENTURY Selected for $47 million FIELDS Grant to Support Ammonia Platform Investment
Parsippany, N.J., November 4, 2026 – AdvanSix (NYSE: ASIX), a vertically integrated chemistry company serving diverse end markets, today announced its financial results for the third quarter ending September 30, 2026.
Third Quarter 2026 Summary
“Our third quarter results reflect strong commercial execution and the resilience of our integrated business model as we navigate significant input cost inflation and a dynamic market environment,” said Erin Kane, president and CEO of AdvanSix. “We generated 15% sales growth year-over-year as our teams continued to leverage both formula and market-based pricing mechanisms to offset inflationary raw material costs. While our core caprolactam operating rate continues to exceed global industry averages, reduced production output drove unfavorable fixed cost absorption in the quarter. We are taking decisive actions to enhance cash generation, improve our cost position, and optimize our portfolio while continuing to prudently invest for attractive long-term growth opportunities. We remain focused on executing our strategic priorities and positioning AdvanSix to deliver sustainable long-term value.”
Summary third quarter 2026 financial results for the Company are included below:
| ($ in Thousands, Except Earnings Per Share) | 3Q 2026 | 3Q 2025 | Variance $ | ||
| Sales | $430,807 | $374,473 | $56,334 | ||
| Net Income (Loss) | (7,555) | (2,638) | (4,917) | ||
| Diluted Earnings Per Share | (0.28) | (0.10) | (0.18) | ||
| Adjusted Diluted Earnings Per Share (1) | (0.24) | 0.08 | (0.32) | ||
| Adjusted EBITDA (1) | 14,643 | 24,734 | (10,091) | ||
| Adjusted EBITDA Margin % (1) | 3.4% | 6.6% | (320) bps | ||
| Cash Flow from Operations | 47,962 | 26,588 | 21,374 | ||
| Capital Expenditures | 18,275 | 26,522 | (8,247) | ||
| Free Cash Flow (1)(2) | 29,687 | 66 | 29,621 |
(1) See “Non-GAAP Measures” included in this press release for non-GAAP reconciliations
(2) Net cash provided by operating activities less capital expenditures
Sales of $431 million in the quarter increased approximately 15% versus the prior year driven by 17% favorable pricing, partially offset by a 2% decline in volume. Raw material pass-through pricing was up 10% following a net cost increase in benzene and propylene (inputs to cumene which is a key feedstock to our products). Market-based pricing improved by 7% primarily reflecting an increase across all product lines and strong commercial execution amid a higher input cost environment. Lower sales volume was primarily driven by lower caprolactam sales.
Sales by product line and approximate percentage of total sales are included below:
| ($ in Thousands) | 3Q 2026 | 3Q 2025 | |||||||
| Sales | % of Total | Sales | % of Total | Variance % | |||||
| Nylon | $ 104,738 | 24% | $ 79,029 | 21% | 33% | ||||
| Caprolactam | 73,072 | 17% | 73,137 | 20% | —% | ||||
| Plant Nutrients | 149,334 | 35% | 138,661 | 37% | 8% | ||||
| Chemical Intermediates | 103,663 | 24% | 83,646 | 22% | 24% | ||||
| Total | $ 430,807 | 100% | $ 374,473 | 100% | 15% |
Adjusted EBITDA of $14.6 million in the quarter decreased $10.1 million versus the prior year primarily driven by the unfavorable impact of reduced production output and higher raw material costs, partially offset by higher pricing and disciplined cost savings including our non-manpower fixed cost savings initiative.
Adjusted earnings per share of ($0.24) decreased $0.32 versus the prior year driven primarily by the factors discussed above.
Cash flow from operations of $48.0 million in the quarter increased $21.4 million versus the prior year primarily due to disciplined working capital performance. Capital expenditures of $18.3 million in the quarter decreased $8.2 million versus the prior year, as expected, driven by continued risk-based prioritization of base investments and progression of growth projects including SUSTAIN.
Credit Agreement
On August 14, 2026, the Company completed a refinancing of its existing credit facility by entering into a new 5-year $425 million credit facility providing ample liquidity and capital deployment optionality. The new agreement is comprised of a $275 million senior secured revolving credit facility and a $150 million senior secured term loan facility.
Outlook
- Expect tighter ammonium sulfate supply and demand dynamics into 2027 amid challenged sulfur input cost environment
- Acetone spread over propylene costs expected to hold near cycle averages
- Continue to optimize Nylon Solutions price over raws spreads and sales volume mix in soft industrial end market environment
- Now expect Capital Expenditures of approximately $90 million in 2026 versus $116 million in 2025, reflecting risk-based prioritization of base investments and enterprise programs with continued progression of growth programs including SUSTAIN
- Continue to expect pre-tax income impact of plant turnarounds to be approximately $17 million in 2026 versus $25 million in 2025
- Continue to expect 2H 2026 sequential cash flow improvement primarily due to a reduced Capital Expenditures run-rate, working capital tailwinds including our 4Q 2026 pre-buy program in Plant Nutrients, and timing of annual payments paid in 1H 2026
“Looking ahead, we remain focused on navigating near-term market dynamics while strengthening our performance and positioning AdvanSix for the future. We are prioritizing disciplined cost management, cash generation and capital deployment while advancing our strategic growth initiatives. We will ensure a well-managed balance sheet as we continue to progress evaluation of our potential DEF growth project as well as Project CENTURY. In addition, our non-manpower fixed cost savings program remains on track while we continue to anticipate 45Q carbon capture tax credits to support improved earnings and cash flow generation moving forward,” concluded Kane.
Dividend
The Company’s Board of Directors declared a quarterly cash dividend of $0.16 per share on the Company’s common stock. The dividend is payable on December 1, 2026 to stockholders of record as of the close of business on November 17, 2026.
Conference Call Information
AdvanSix will discuss its results during its investor conference call today starting at 9:30 a.m. ET. To participate on the conference call, dial (844) 855-9494 (domestic) or (412) 858-4602 (international) approximately 10 minutes before the 9:30 a.m. ET start, and tell the operator that you are dialing in for AdvanSix’s third quarter 2026 earnings call. The live webcast of the investor call as well as related presentation materials can be accessed at http://investors.advansix.com. Investors can hear a replay of the conference call from 12 noon ET on November 4 until 12 noon ET on November 11 by dialing (855) 669-9658 (domestic) or (412) 317-0088 (international). The access code is 3522933.
About AdvanSix
AdvanSix is a vertically integrated chemistry company that produces essential materials for our customers across diverse end markets. Our value chain of our five U.S.-based manufacturing facilities plays a critical role in global supply chains and enables us to innovate and deliver essential products for our customers across building and construction, fertilizers, agrochemicals, plastics, solvents, packaging, paints, coatings, adhesives, electronics and other end markets. Guided by our core values of Safety, Integrity, Accountability and Respect, AdvanSix strives to deliver best-in-class customer experiences and differentiated products in the industries of nylon solutions, plant nutrients, and chemical intermediates. More information on AdvanSix can be found at http://www.advansix.com.
Forward Looking Statements
This release contains certain statements that may be deemed “forward-looking statements” within the meaning of Section 21E of the Securities Exchange Act of 1934, as amended. All statements, other than statements of historical fact, that address activities, events or developments that our management intends, expects, projects, believes or anticipates will or may occur in the future are forward-looking statements. Forward-looking statements may be identified by words such as “expect,” “anticipate,” “estimate,” “outlook,” “project,” “strategy,” “intend,” “plan,” “target,” “goal,” “may,” “will,” “should” and “believe” and other variations or similar terminology and expressions. Although we believe forward-looking statements are based upon reasonable assumptions, such statements involve known and unknown risks, uncertainties and other factors, many of which are beyond our control and difficult to predict, which may cause the actual results or performance of the Company to be materially different from any future results or performance expressed or implied by such forward-looking statements. Such risks and uncertainties include, but are not limited to: general economic and financial conditions in the U.S. and globally; the potential effects of inflationary pressures, tariffs or the imposition of new tariffs, trade wars, barriers or restrictions, or threats of such actions, changes in interest rates, labor market shortages and supply chain issues; instability or volatility in financial markets or other unfavorable economic or business conditions caused by geopolitical concerns, including as a result of new or proposed legislation or regulatory, trade or other policies in or impacting the U.S., the conflict between Russia and Ukraine, the conflicts in the Middle East, as well as any related uncertainty in the surrounding region, and the possible expansion of such conflicts; the effect of any of the foregoing on our customers’ demand for our products and our suppliers’ ability to manufacture and deliver our raw materials, including implications of reduced refinery utilization in the U.S.; our ability to sell and provide our goods and services; the ability of our customers to pay for our products; any closures of our and our customers’ offices and facilities; risks associated with increased phishing, compromised business emails and other cybersecurity attacks, data privacy incidents and disruptions to our technology infrastructure; risks associated with potential use of artificial intelligence in our operations or those of third party service providers; risks associated with operating with a reduced workforce; risks associated with our indebtedness including compliance with financial and restrictive covenants, and our ability to access capital on reasonable terms, at a reasonable cost, or at all, due to economic conditions or otherwise; the impact of scheduled turnarounds and significant unplanned downtime and interruptions of production or logistics operations as a result of mechanical issues or other unanticipated events such as fires, severe weather conditions, natural disasters, pandemics, geopolitical conflicts and related events; price fluctuations, cost increases and supply of raw materials; our operations and growth projects requiring substantial capital; growth rates and cyclicality of the industries we serve including global changes in supply and demand; failure to develop and commercialize new products or technologies; loss of significant customer relationships; adverse trade and tax policies; extensive environmental, health and safety laws that apply to our operations; hazards associated with chemical manufacturing, storage and transportation; litigation associated with chemical manufacturing and our business operations generally; inability to acquire and integrate businesses, assets, products or technologies; protection of our intellectual property and proprietary information; prolonged work stoppages as a result of labor difficulties or otherwise; failure to maintain effective internal controls; our ability to declare and pay quarterly cash dividends and the amounts and timing of any future dividends; our ability to repurchase our common stock and the amount and timing of any future repurchases; disruptions in supply chain, transportation and logistics; potential for uncertainty regarding qualification for tax treatment of our spin-off; fluctuations in our stock price; and changes in laws or regulations applicable to our business. You are cautioned not to place undue reliance on these forward-looking statements, which speak only as of the date of this release. Such forward-looking statements are not guarantees of future performance, and actual results, developments and business decisions may differ materially from those contemplated by such forward-looking statements as a result of a number of risks, uncertainties and other factors including those noted above and those identified in our filings with the Securities and Exchange Commission (SEC), including the risk factors in Part 1, Item 1A of our Annual Report on Form 10-K for the year ended December 31, 2025, as updated in subsequent reports filed with the SEC. All subsequent written or oral forward-looking statements attributable to us or persons acting on our behalf are qualified in their entirety by this paragraph. We do not undertake to update or revise any of our forward-looking statements.
Non-GAAP Financial Measures
This press release includes certain non-GAAP financial measures intended to supplement, not to act as substitutes for, comparable GAAP measures. Reconciliations of non-GAAP financial measures to GAAP financial measures are provided in this press release. Investors are urged to consider carefully the comparable GAAP measures and the reconciliations to those measures provided. Non-GAAP measures in this press release may be calculated in a way that is not comparable to similarly-titled measures reported by other companies.
# # #
| Contacts: | |
| Media | Investors |
| Janeen Lawlor | Adam Kressel |
| (973) 526-1615 | (973) 526-1700 |
| [email protected] | [email protected] |
AdvanSix Inc.
Condensed Consolidated Balance Sheets
(Unaudited)
(Dollars in thousands, except share and per share amounts)
| September 30, 2026 | December 31, 2025 | ||
| ASSETS | |||
| Current assets: | |||
| Cash and cash equivalents | $ 22,550 | $ 19,766 | |
| Accounts and other receivables – net | 193,416 | 154,102 | |
| Inventories – net | 181,413 | 236,495 | |
| Taxes receivable | 22,786 | 21,605 | |
| Other current assets | 14,839 | 8,639 | |
| Total current assets | 435,004 | 440,607 | |
| Property, plant and equipment – net | 962,786 | 963,718 | |
| Operating lease right-of-use assets | 140,555 | 164,494 | |
| Goodwill | 56,192 | 56,192 | |
| Intangible assets | 37,808 | 40,095 | |
| Other assets | 45,129 | 41,042 | |
| Total assets | $ 1,677,474 | $ 1,706,148 | |
| LIABILITIES | |||
| Current liabilities: | |||
| Accounts payable | $ 286,405 | $ 284,016 | |
| Accrued liabilities | 31,411 | 45,945 | |
| Income taxes payable | 55 | 1,100 | |
| Operating lease liabilities – short-term | 40,409 | 44,354 | |
| Deferred income and customer advances | 1,589 | 14,536 | |
| Current portion of long-term debt | 3,750 | — | |
| Total current liabilities | 363,619 | 389,951 | |
| Deferred income taxes | 150,887 | 154,061 | |
| Operating lease liabilities – long-term | 101,695 | 121,201 | |
| Line of credit – long-term | 120,000 | 215,000 | |
| Long-term debt | 144,727 | — | |
| Other liabilities | 11,131 | 10,719 | |
| Total liabilities | 892,059 | 890,932 | |
| STOCKHOLDERS’ EQUITY | |||
| Common stock, par value $0.01; 200,000,000 shares authorized; 33,400,026 shares issued and 27,005,655 outstanding at September 30, 2026; 33,177,824 shares issued and 26,864,035 outstanding at December 31, 2025 | 334 | 332 | |
| Preferred stock, par value $0.01; 50,000,000 shares authorized; 0 shares issued and outstanding at September 30, 2026 and December 31, 2025 | — | — | |
| Treasury stock at par (6,394,371 shares at September 30, 2026; 6,313,789 shares at December 31, 2025) | (64) | (63) | |
| Additional paid-in capital | 146,841 | 142,932 | |
| Retained earnings | 629,578 | 663,019 | |
| Accumulated other comprehensive income | 8,726 | 8,996 | |
| Total stockholders’ equity | 785,415 | 815,216 | |
| Total liabilities and stockholders’ equity | $ 1,677,474 | $ 1,706,148 |
AdvanSix Inc.
Condensed Consolidated Statements of Operations
(Unaudited)
(Dollars in thousands, except share and per share amounts)
| Three Months EndedSeptember 30, | Nine Months EndedSeptember 30, | ||||||
| 2026 | 2025 | 2026 | 2025 | ||||
| Sales | $ 430,807 | $ 374,473 | $ 1,256,274 | $ 1,162,286 | |||
| Costs, expenses and other: | |||||||
| Cost of goods sold | 419,602 | 349,088 | 1,210,166 | 1,024,716 | |||
| Selling, general and administrative expenses | 19,196 | 27,425 | 63,768 | 76,250 | |||
| Interest expense, net | 4,027 | 2,322 | 9,065 | 6,119 | |||
| Other non-operating income, net | (890) | (815) | (1,573) | (1,831) | |||
| Total costs, expenses and other | 441,935 | 378,020 | 1,281,426 | 1,105,254 | |||
| Income (loss) before taxes | (11,128) | (3,547) | (25,152) | 57,032 | |||
| Income tax expense (benefit) | (3,573) | (909) | (5,299) | 4,955 | |||
| Net income (loss) | $ (7,555) | $ (2,638) | $ (19,853) | $ 52,077 | |||
| Earnings per common share | |||||||
| Basic | $ (0.28) | $ (0.10) | $ (0.73) | $ 1.94 | |||
| Diluted | $ (0.28) | $ (0.10) | $ (0.73) | $ 1.91 | |||
| Weighted average common shares outstanding | |||||||
| Basic | 27,077,103 | 26,927,305 | 27,035,092 | 26,887,489 | |||
| Diluted | 27,077,103 | 26,927,305 | 27,035,092 | 27,248,759 |
AdvanSix Inc.
Condensed Consolidated Statements of Cash Flows
(Unaudited)
(Dollars in thousands)
| Three Months EndedSeptember 30, | Nine Months EndedSeptember 30, | ||||||
| 2026 | 2025 | 2026 | 2025 | ||||
| Cash flows from operating activities: | |||||||
| Net income (loss) | $ (7,555) | $ (2,638) | $ (19,853) | $ 52,077 | |||
| Adjustments to reconcile net income to net cash provided by operating activities: | |||||||
| Depreciation and amortization | 21,069 | 20,327 | 62,820 | 58,966 | |||
| (Gain) loss on disposal of assets | 12 | — | 146 | (177) | |||
| Deferred income taxes | (1,285) | 7,820 | (3,174) | 14,466 | |||
| Stock-based compensation | 675 | 1,632 | 4,553 | 5,919 | |||
| Amortization of deferred financing fees | 668 | 155 | 972 | 464 | |||
| Changes in assets and liabilities, net of business acquisitions: | |||||||
| Accounts and other receivables | (6,243) | (24,977) | (39,584) | (38,971) | |||
| Inventories | 12,732 | 12,644 | 55,082 | 3,266 | |||
| Taxes receivable | (2,276) | (8,515) | (1,181) | (23,255) | |||
| Accounts payable | 44,338 | 4,123 | 21,404 | 16,546 | |||
| Income taxes payable | (18) | (335) | (1,045) | (998) | |||
| Accrued liabilities | (12,088) | 8,352 | (14,089) | 8,913 | |||
| Deferred income and customer advances | (391) | (1,177) | (12,947) | (36,857) | |||
| Other assets and liabilities | (1,676) | 9,177 | (10,436) | (1,218) | |||
| Net cash provided by operating activities | 47,962 | 26,588 | 42,668 | 59,141 | |||
| Cash flows from investing activities: | |||||||
| Expenditures for property, plant and equipment | (18,275) | (26,522) | (74,925) | (88,849) | |||
| Other investing activities | (324) | (262) | (546) | (6,153) | |||
| Net cash used for investing activities | (18,599) | (26,784) | (75,471) | (95,002) | |||
| Cash flows from financing activities: | |||||||
| Proceeds from long-term debt | 150,000 | — | 150,000 | — | |||
| Payment of debt issuance costs | (1,549) | — | (1,549) | — | |||
| Borrowings from line of credit | 106,000 | 85,000 | 367,500 | 316,500 | |||
| Repayments of line of credit | (261,000) | (75,000) | (462,500) | (261,500) | |||
| Payment of line of credit facility fees | (2,877) | — | (2,877) | — | |||
| Principal payments of finance leases | (243) | (249) | (756) | (740) | |||
| Dividend payments | (4,320) | (4,296) | (12,947) | (12,876) | |||
| Purchase of treasury stock | (41) | (121) | (1,438) | (1,658) | |||
| Issuance of common stock | — | 112 | 154 | 267 | |||
| Net cash provided by (used for) financing activities | (14,030) | 5,446 | 35,587 | 39,993 | |||
| Net change in cash and cash equivalents | 15,333 | 5,250 | 2,784 | 4,132 | |||
| Cash and cash equivalents at beginning of period | 7,217 | 18,446 | 19,766 | 19,564 | |||
| Cash and cash equivalents at the end of period | $ 22,550 | $ 23,696 | $ 22,550 | $ 23,696 | |||
| Supplemental non-cash investing activities: | |||||||
| Capital expenditures included in accounts payable | $ 8,310 | $ 14,894 |
AdvanSix Inc.
Non-GAAP Measures
(Dollars in thousands, except share and per share amounts)
Reconciliation of Net Cash Provided by Operating Activities to Free Cash Flow
| Three Months EndedSeptember 30, | Nine Months EndedSeptember 30, | ||||||
| 2026 | 2025 | 2026 | 2025 | ||||
| Net cash provided by operating activities | $ 47,962 | $ 26,588 | $ 42,668 | $ 59,141 | |||
| Expenditures for property, plant and equipment | (18,275) | (26,522) | (74,925) | (88,849) | |||
| Free cash flow (1) | $ 29,687 | $ 66 | $ (32,257) | $ (29,708) | |||
| (1) Free cash flow is a non-GAAP measure defined as Net cash provided by operating activities less Expenditures for property, plant and equipment. |
The Company believes that this metric is useful to investors and management as a measure to evaluate our ability to generate cash flow from business operations and the impact that this cash flow has on our liquidity.
Reconciliation of Net Income to Adjusted EBITDA and Earnings Per Share to Adjusted Earnings Per Share
| Three Months EndedSeptember 30, | Nine Months EndedSeptember 30, | ||||||
| 2026 | 2025 | 2026 | 2025 | ||||
| Net income (loss) | $ (7,555) | $ (2,638) | $ (19,853) | $ 52,077 | |||
| Non-cash stock-based compensation | 675 | 1,632 | 4,553 | 5,919 | |||
| Non-cash amortization from acquisitions | 532 | 532 | 1,595 | 1,595 | |||
| Strategic advisory and professional fees (2) | — | 4,000 | — | 4,000 | |||
| Income tax benefit relating to reconciling items | (234) | (1,378) | (1,082) | (2,287) | |||
| Adjusted Net income (loss) (non-GAAP) | (6,582) | 2,148 | (14,787) | 61,304 | |||
| Interest expense, net | 4,027 | 2,322 | 9,065 | 6,119 | |||
| Income tax expense (benefit) – Adjusted | (3,339) | 469 | (4,216) | 7,242 | |||
| Depreciation and amortization – Adjusted | 20,537 | 19,795 | 61,225 | 57,371 | |||
| Adjusted EBITDA (non-GAAP) | $ 14,643 | $ 24,734 | $ 51,287 | $ 132,036 | |||
| Sales | $ 430,807 | $ 374,473 | $ 1,256,274 | $ 1,162,286 | |||
| Adjusted EBITDA Margin (non-GAAP) (3) | 3.4% | 6.6% | 4.1% | 11.4% | |||
| (2) Legal and professional fees associated with strategic regulatory matters and potential inorganic growth options, including costs associated with a transaction the Company is no longer pursuing | |||||||
| (3) Adjusted EBITDA Margin is defined as Adjusted EBITDA divided by Sales |
| Three Months EndedSeptember 30, | Nine Months EndedSeptember 30, | ||||||
| 2026 | 2025 | 2026 | 2025 | ||||
| Net income (loss) | $ (7,555) | $ (2,638) | $ (19,853) | $ 52,077 | |||
| Adjusted Net income (loss) (non-GAAP) | (6,582) | 2,148 | (14,787) | 61,304 | |||
| Weighted-average number of common shares outstanding – basic | 27,077,103 | 26,927,305 | 27,035,092 | 26,887,489 | |||
| Dilutive effect of equity awards and other stock-based holdings | — | — | — | 361,270 | |||
| Weighted-average number of common shares outstanding – diluted | 27,077,103 | 26,927,305 | 27,035,092 | 27,248,759 | |||
| EPS – Basic | $ (0.28) | $ (0.10) | $ (0.73) | $ 1.94 | |||
| EPS – Diluted | $ (0.28) | $ (0.10) | $ (0.73) | $ 1.91 | |||
| Adjusted EPS – Basic (non-GAAP) | $ (0.24) | $ 0.08 | $ (0.55) | $ 2.28 | |||
| Adjusted EPS – Diluted (non-GAAP) | $ (0.24) | $ 0.08 | $ (0.55) | $ 2.25 |
The Company believes the non-GAAP financial measures presented in this release provide meaningful supplemental information as they are used by the Company’s management to evaluate the Company’s operating performance, enhance a reader’s understanding of the financial performance of the Company, and facilitate a better comparison among fiscal periods and performance relative to its competitors, as these non-GAAP measures exclude items that are not considered core to the Company’s operations.
AdvanSix Inc.
Appendix
(Pre-tax income impact, Dollars in millions)
Planned Plant Turnaround Schedule (4)
| 1Q | 2Q | 3Q | 4Q | FY | Primary Unit Operation | |
| 2017 | — | ~$10 | ~$4 | ~$20 | ~$34 | Sulfuric Acid |
| 2018 | ~$2 | ~$10 | ~$30 | — | ~$42 | Ammonia |
| 2019 | — | ~$5 | ~$5 | ~$25 | ~$35 | Sulfuric Acid |
| 2020 | ~$2 | ~$7 | ~$20 | ~$2 | ~$31 | Ammonia |
| 2021 | ~$3 | ~$8 | — | ~$18 | ~$29 | Sulfuric Acid |
| 2022 | ~$1 | ~$5 | ~$44(5) | — | ~$50 | Ammonia |
| 2023 | ~$2 | ~$1 | ~$27 | — | ~$30 | Sulfuric Acid |
| 2024 | ~$5 | ~$3 | ~$3 | ~$47(6) | ~$58 | Ammonia |
| 2025 | ~$5 | ~$6 | — | ~$14 | ~$25 | Sulfuric Acid |
| 2026E | — | ~$10 | — | ~$7 | ~$17 | Ammonia |
(4) Primarily reflects the impact of fixed cost absorption, maintenance expense, and the purchase of feedstocks which are normally manufactured by the Company.
(5) During the multi-site planned plant turnaround, additional required maintenance at our Frankford phenol plant contributed to reduced production across our integrated value chain and a delayed ramp to full operating rates at our Hopewell and Chesterfield sites, resulting in an incremental $15 million unfavorable impact to pre-tax income, which is reflected in this amount and is inclusive of fixed cost absorption, higher maintenance expense and lost sales.
(6) During the multi-site planned plant turnaround, additional required maintenance at our Hopewell plant contributed to reduced production across our integrated value chain and a delayed ramp to full operating rates, resulting in an incremental approximately $17 million unfavorable impact to pre-tax income, which is reflected in this amount and is inclusive of fixed cost absorption, higher maintenance expense, and lost sales.
Related Articles
Five Ways AdvanSix Recycled Nylon is Helping Customers Reach Their Sustainability Goals
ADVANSIX SELECTED FOR $47.4 MILLION GRANT TO EXPAND AMERICAN MANUFACTURING
Celebrating 10 Years of AdvanSix
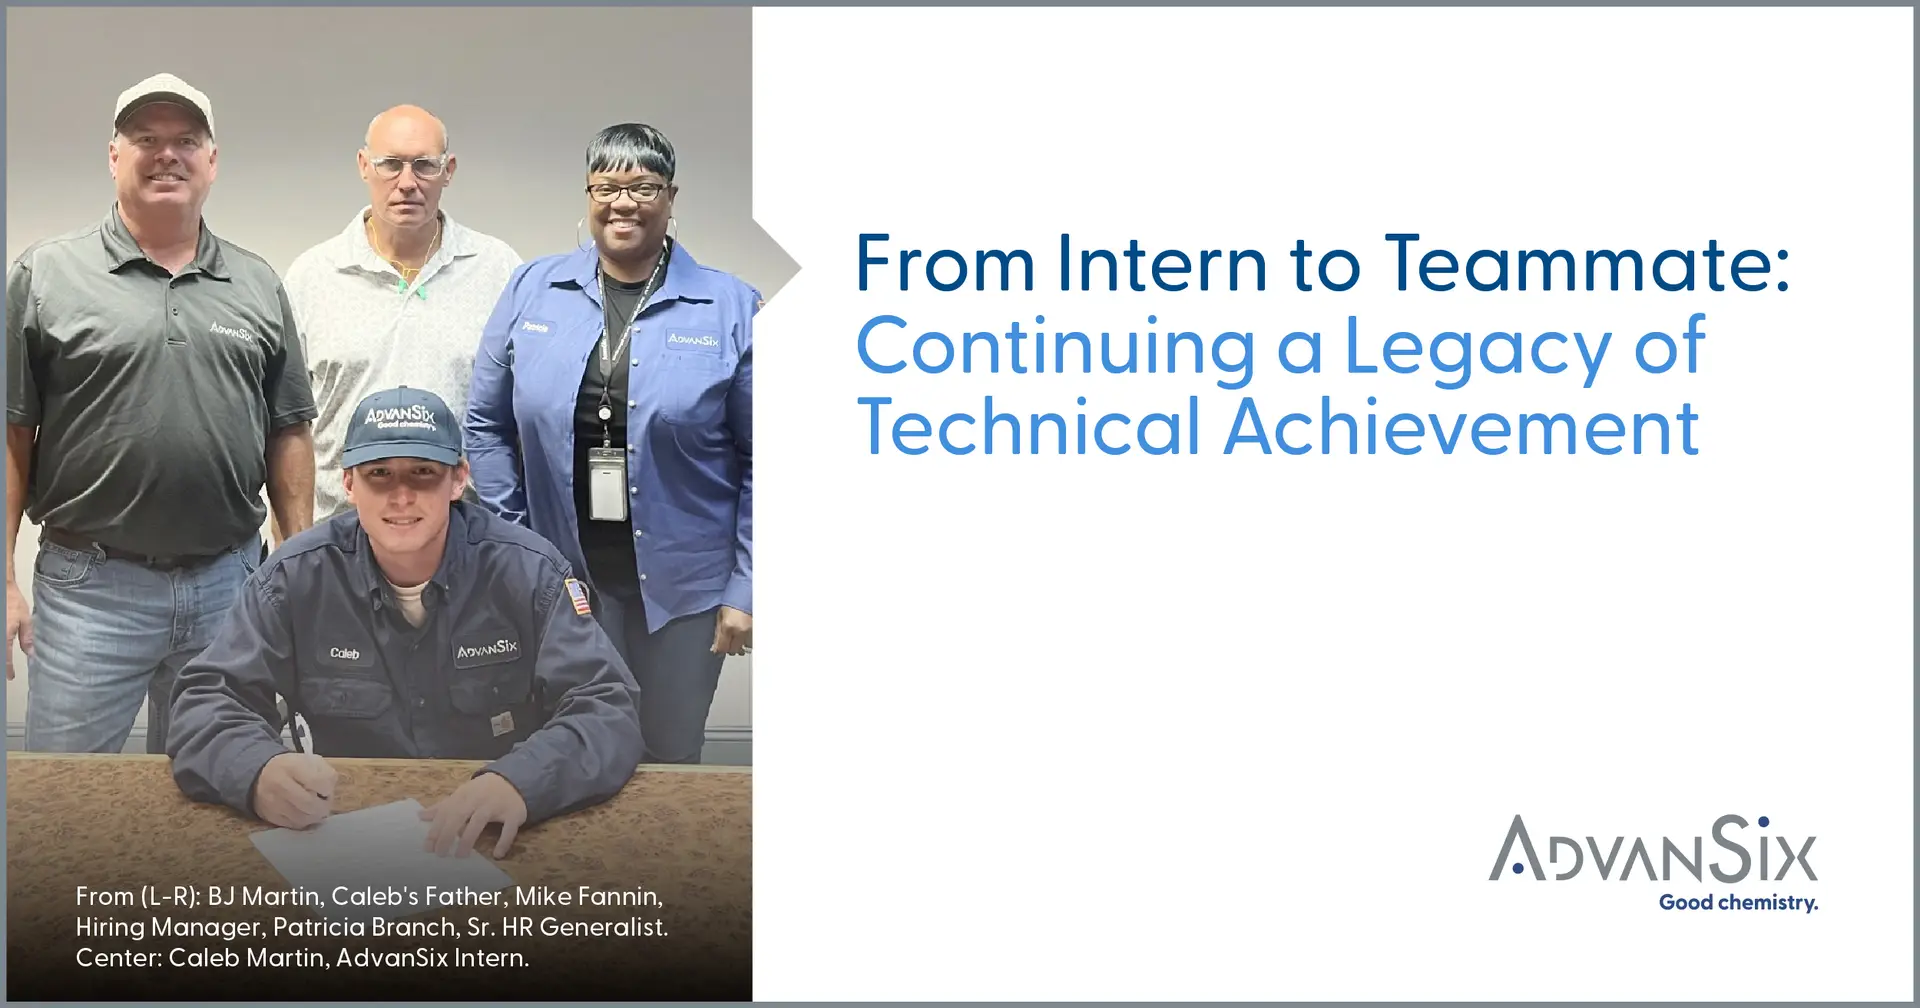
From Intern to Full Time: Continuing a Legacy of Technical Achievement
ADVANSIX ANNOUNCES SECOND QUARTER 2026 FINANCIAL RESULTS
Subscribe to receive our latest news and updates.
URL
This field is for validation purposes and should be left unchanged.
Email(Required)
Send
Home / Newsroom / ADVANSIX ANNOUNCES THIRD QUARTER 2026 FINANCIAL RESULTS
Email:
Phone:
Facebook Logo Square Instagram Logo Linkedin Logo
© Copyright 2026 Advansix. All rights reserved.
Manage Cookie Consent
To provide the best experiences, we use technologies like cookies to store and/or access device information. Consenting to these technologies will allow us to process data such as browsing behavior or unique IDs on this site. Not consenting or withdrawing consent, may adversely affect certain features and functions.
Functional Functional Always active
The technical storage or access is strictly necessary for the legitimate purpose of enabling the use of a specific service explicitly requested by the subscriber or user, or for the sole purpose of carrying out the transmission of a communication over an electronic communications network.
Preferences Preferences
The technical storage or access is necessary for the legitimate purpose of storing preferences that are not requested by the subscriber or user.
Statistics Statistics
The technical storage or access that is used exclusively for statistical purposes. The technical storage or access that is used exclusively for anonymous statistical purposes. Without a subpoena, voluntary compliance on the part of your Internet Service Provider, or additional records from a third party, information stored or retrieved for this purpose alone cannot usually be used to identify you.
Marketing Marketing
The technical storage or access is required to create user profiles to send advertising, or to track the user on a website or across several websites for similar marketing purposes.
Accept Reject Manage Preferences Save preferences Manage Preferences
Manage Cookie Consent
To provide the best experiences, we use technologies like cookies to store and/or access device information. Consenting to these technologies will allow us to process data such as browsing behavior or unique IDs on this site. Not consenting or withdrawing consent, may adversely affect certain features and functions.
Functional Functional Always active
The technical storage or access is strictly necessary for the legitimate purpose of enabling the use of a specific service explicitly requested by the subscriber or user, or for the sole purpose of carrying out the transmission of a communication over an electronic communications network.
Preferences Preferences
The technical storage or access is necessary for the legitimate purpose of storing preferences that are not requested by the subscriber or user.
Statistics Statistics
The technical storage or access that is used exclusively for statistical purposes. The technical storage or access that is used exclusively for anonymous statistical purposes. Without a subpoena, voluntary compliance on the part of your Internet Service Provider, or additional records from a third party, information stored or retrieved for this purpose alone cannot usually be used to identify you.
Marketing Marketing
The technical storage or access is required to create user profiles to send advertising, or to track the user on a website or across several websites for similar marketing purposes.
Accept Reject Manage Preferences Save preferences Manage Preferences
Manage consent Manage consent
Notifications