November 4, 2026 National Disability Employment Awareness Month is observed in October, but at Aramark, awareness and action are full-time priorities National Disability Employment Awareness Month (NDEAM), observed in October, was established by…
November 4, 2026
National Disability Employment Awareness Month is observed in October, but at Aramark, awareness and action are full-time priorities
National Disability Employment Awareness Month (NDEAM), observed in October, was established by Congress to recognize the contributions of workers with disabilities and promote inclusive employment practices. According to the most recent U.S. Bureau of Labor Statistics data, 22.8% of people with a disability were employed in 2025, and their unemployment rate was about double the rate for people without a disability.
For Aramark, creating access and opportunity is a year-round imperative built into how the company hires and partners, from corporate offices to client sites across hospitals, universities, schools, stadiums, workplaces, and more.
“There is such a depth of talent that goes untapped, and we’re focused on building pathways for every qualified person,” said Fenimore Fisher, Vice President of Global Inclusion at Aramark. “Our culture of hospitality inspires us to welcome, value, and serve all. We are working to build stronger teams, provide the best service, and enrich the communities where we live and work.”
From Classroom to Career
Aramark is actively involved with several high school, university, and nonprofit organizations aimed to facilitate employment opportunities for disabled and neurodiverse students.
Project SEARCH is a one-year internship program for young people with intellectual and developmental disabilities. Aramark works with Project SEARCH via a joint initiative through Mastery Charter School and Community Integrated Services (CIS). During each of the last four years, eight students have spent their final year of school rotating through internships within Aramark that align with key aspects of the business including food service, facilities, operations, and office support. Of the program’s 24 alumni through 2025, half have gone on to permanent employment at Aramark headquarters and various client locations.
Zaire Golden is one example of a Project SEARCH success story. After completing his internship, Golden was hired full-time. In addition to working at Aramark headquarters for the past three years, Golden also serves as a mentor to other Project SEARCH participants.
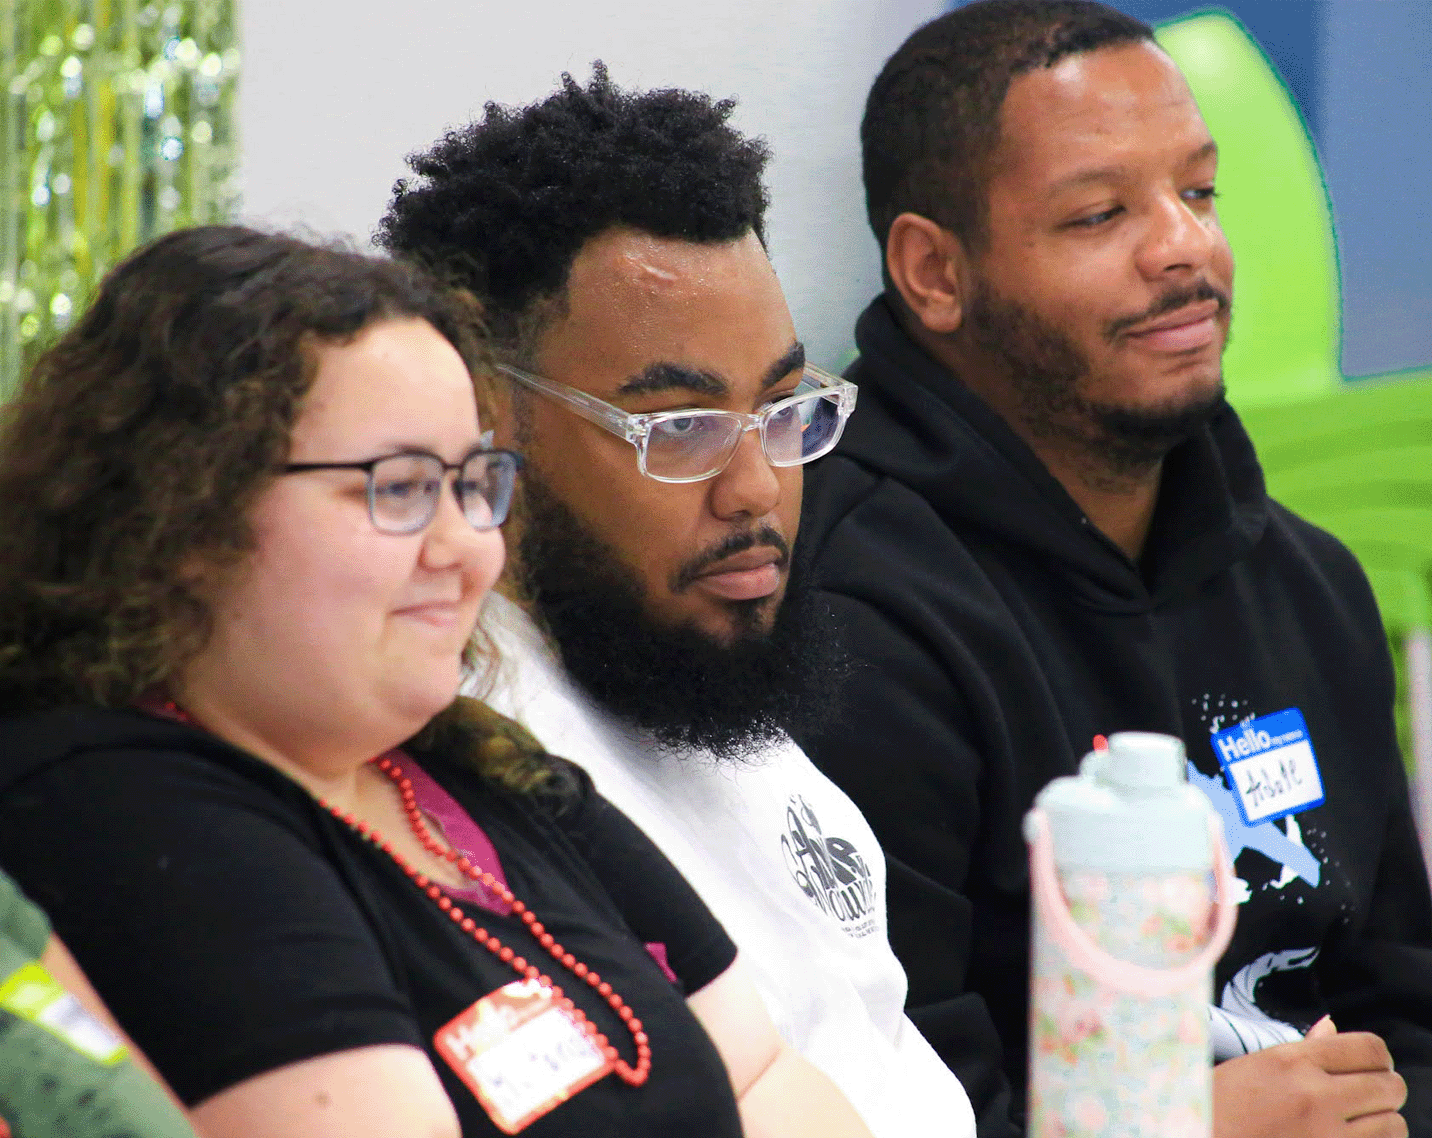
Zaire Golden (center). Photo courtesy of Community Integrated Services.
“My experience with Project SEARCH and Aramark really changed me as a person,” said Golden. “I’ve become more talkative and comfortable with stepping out of my comfort zone. I’m treated as an equal here and can just be myself. My Aramark coworkers and managers have become like family.”
Maryanne Hayde-Liao, Project SEARCH instructor at Mastery Charter School, helps identify participants from Mastery’s charter schools six Philadelphia high schools for Project SEARCH. She says interning at Aramark helps build both tangible job skills and soft skills like communication: “Most importantly, our students are working in real settings as part of the team, not set apart.”
On the collegiate level, Aramark partners with the A.J. Drexel Autism Institute, the Kinney Center for Autism Education and Support at Saint Joseph’s University, and Villanova’s VUnited Scholars Program. The company employs students as interns and hosts events at headquarters where students can meet with senior leaders and participate in career workshops.
For Mary Ann Newell, Director of Employment Initiatives and partnerships at the Kinney Center for Autism Education and Support at Saint Joseph’s University, seeing firsthand the commitment to providing tangible opportunities in a neurodiversity and disability-friendly environment is “encouraging and empowering for our students as they consider their professional futures.”
In addition to internships, Aramark’s neurodiversity hiring events in Philadelphia, open to Drexel students and Philadelphians more broadly, have led to hundreds of immediate offers.
“Real jobs right now for people with disabilities are where the rubber meets the road, and both businesses and the community benefit,” said Dianne Malley, Director of Community Impact for Transition Pathways at the A.J. Drexel Autism Institute at Drexel University.
Villanova’s VUnited Scholars, a two-year program for young adults with mild to moderate intellectual disabilities, is Aramark’s newest partner. Two students are currently interning at Penn Medicine, and Aramark plans to expand the cohort next year.
“Our students tell us they are excited about coming to work every day,” said Deborah Harris, Assistant Director of the VUnited Scholars Program. “That is a win for every part of this partnership and a testament to the environment Aramark is cultivating.”
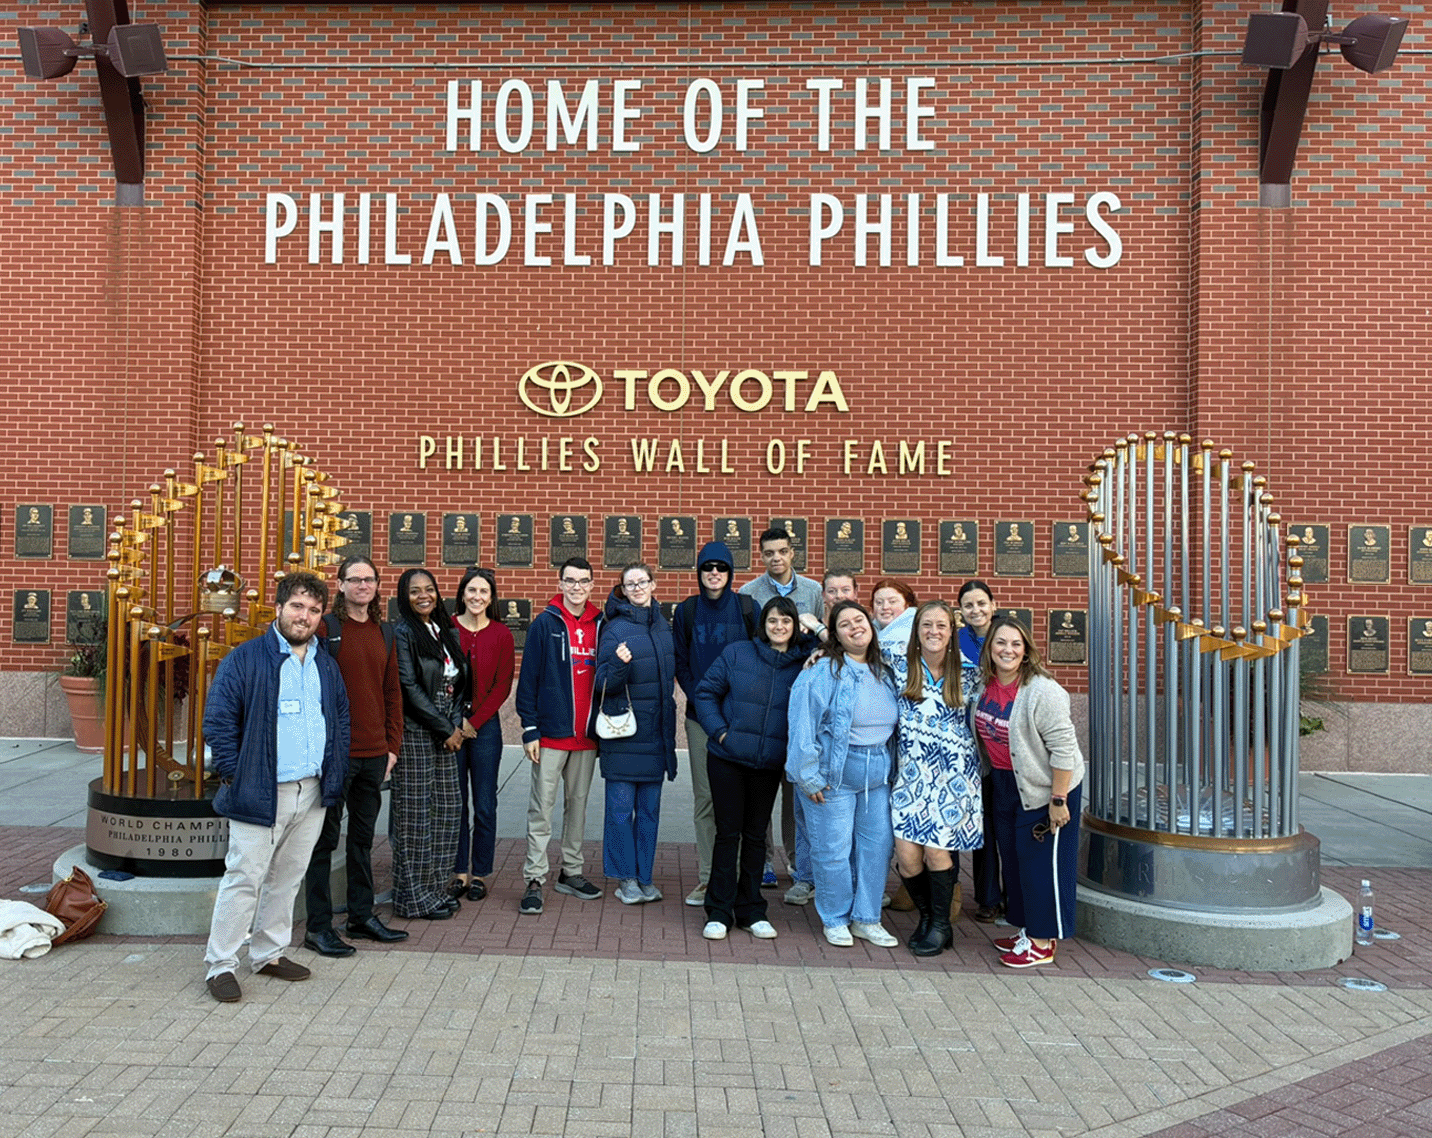
Participants in the VUnited Scholars Program gather outside Citizens Bank Park for a behind-the-scenes learning experience.
Embedding Inclusion Across the Ecosystem
Aramark’s commitment to promoting opportunity and self-sufficiency for people with disabilities extends beyond its employment practices. At Lincoln Financial Field, Aramark partners with the Eagles Autism Foundation and Popcorn for the People, a nonprofit social enterprise that creates jobs for adults with autism and other developmental disabilities. At the enterprise level, Aramark’s Inclusive Sourcing team works to ensure that disabled-owned business enterprises (DOBEs) are aware of the opportunities to compete for upcoming requests for proposals.
Disability:IN named Aramark a Top Scorer on its 2026 Disability Index, a benchmark that evaluates employers’ policies, programs, and practices for disability inclusion. It was the 10th time the company earned this distinction.
“As we conclude NDEAM, we thank all who contributed to our progress to date. We’ll keep learning, and growing our efforts because the goal isn’t just a job. It’s opportunity, meaningful work, and a workplace where every employee is treated with dignity and respect,” said Fisher.
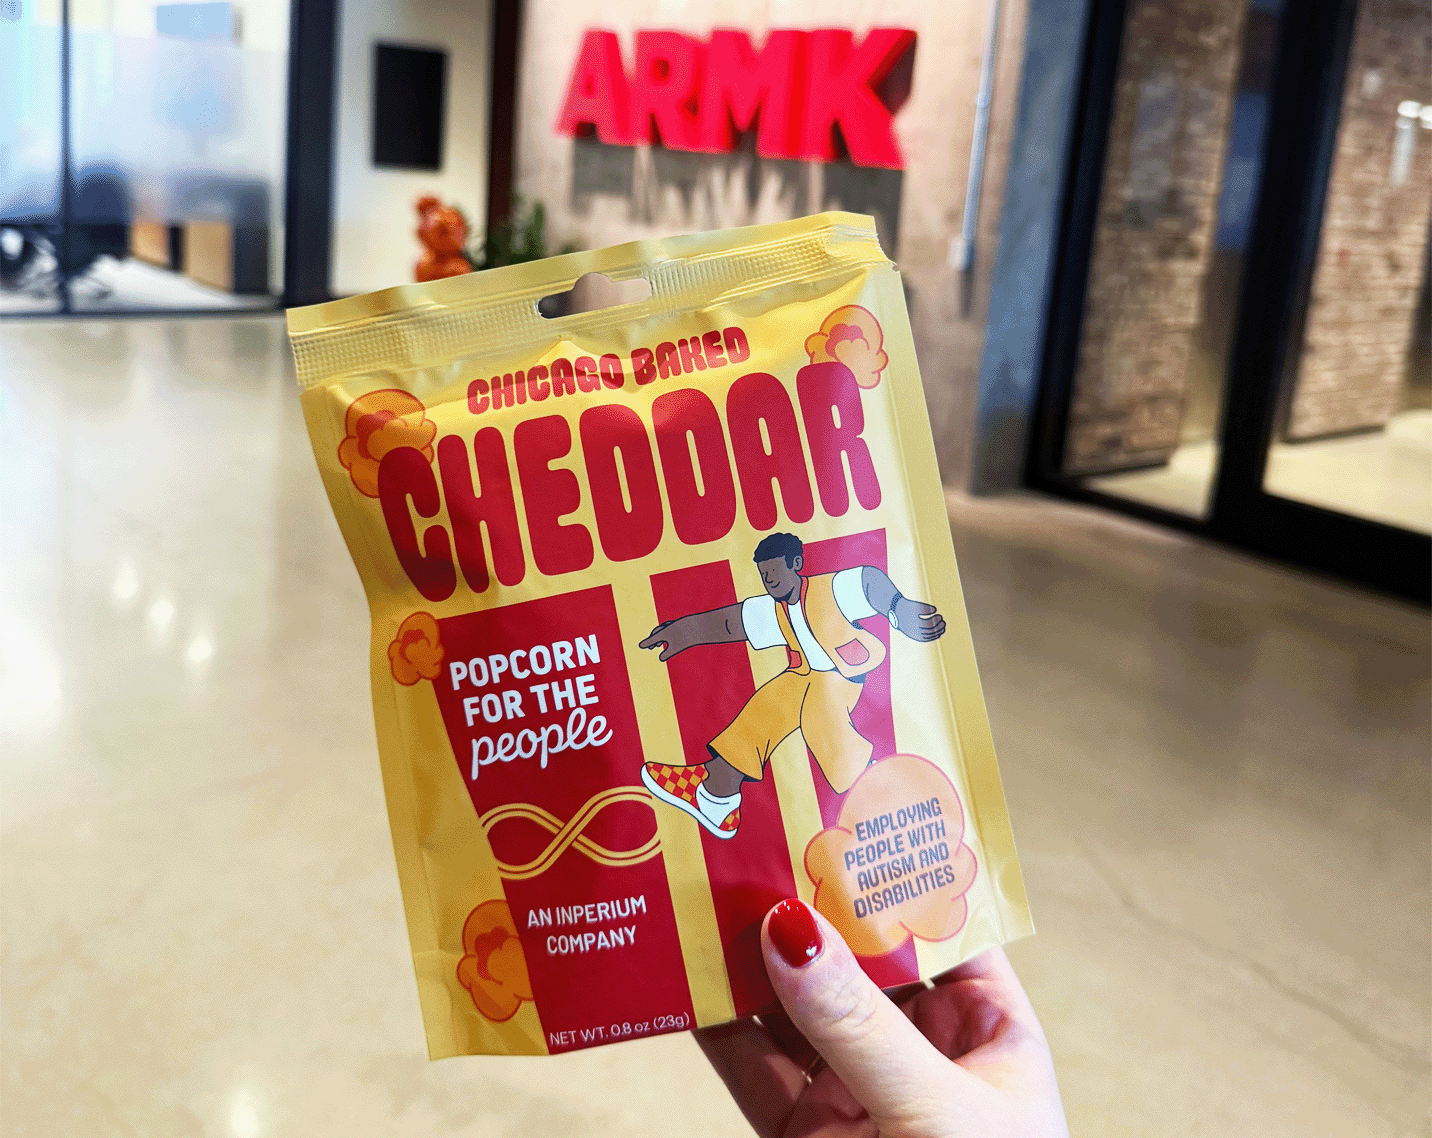
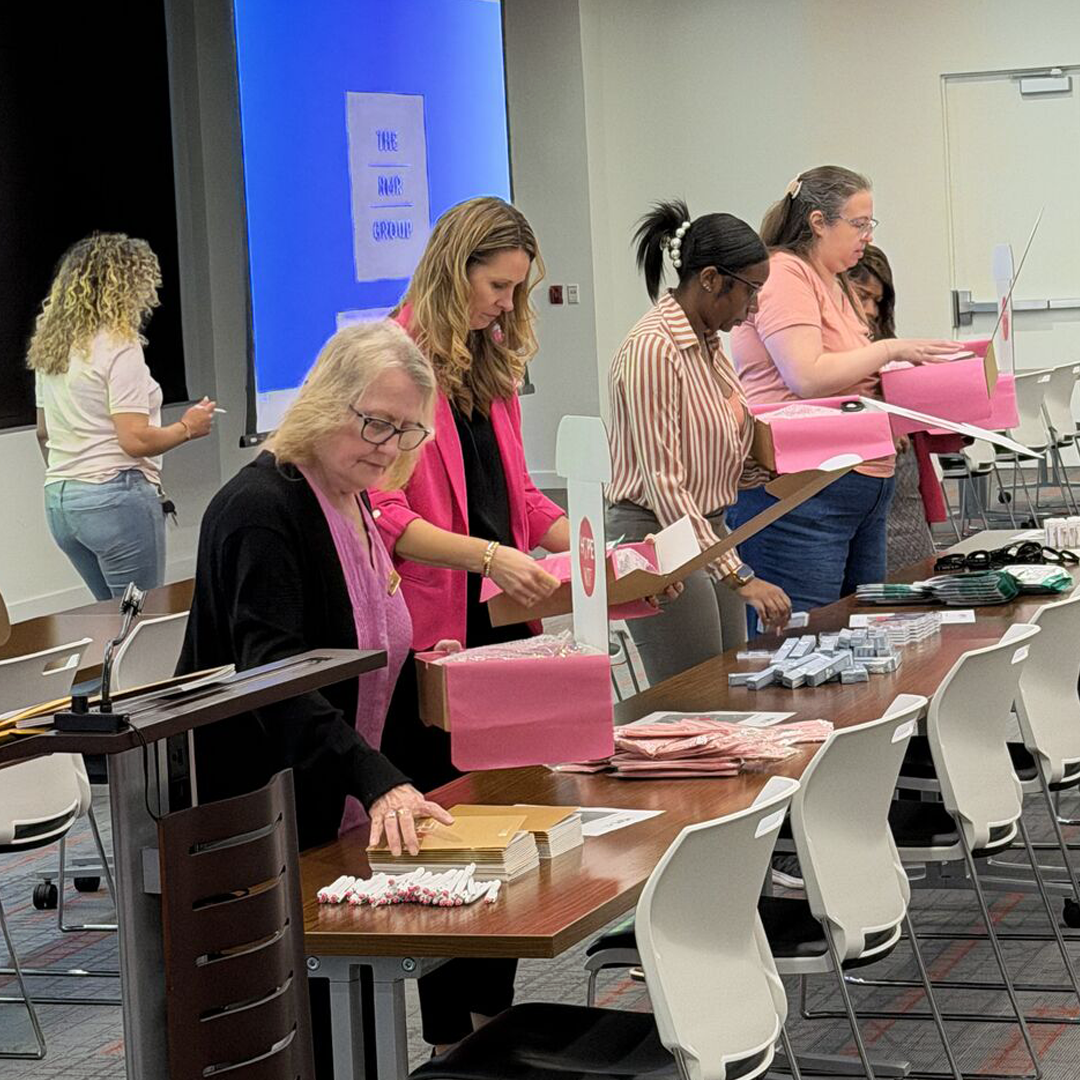
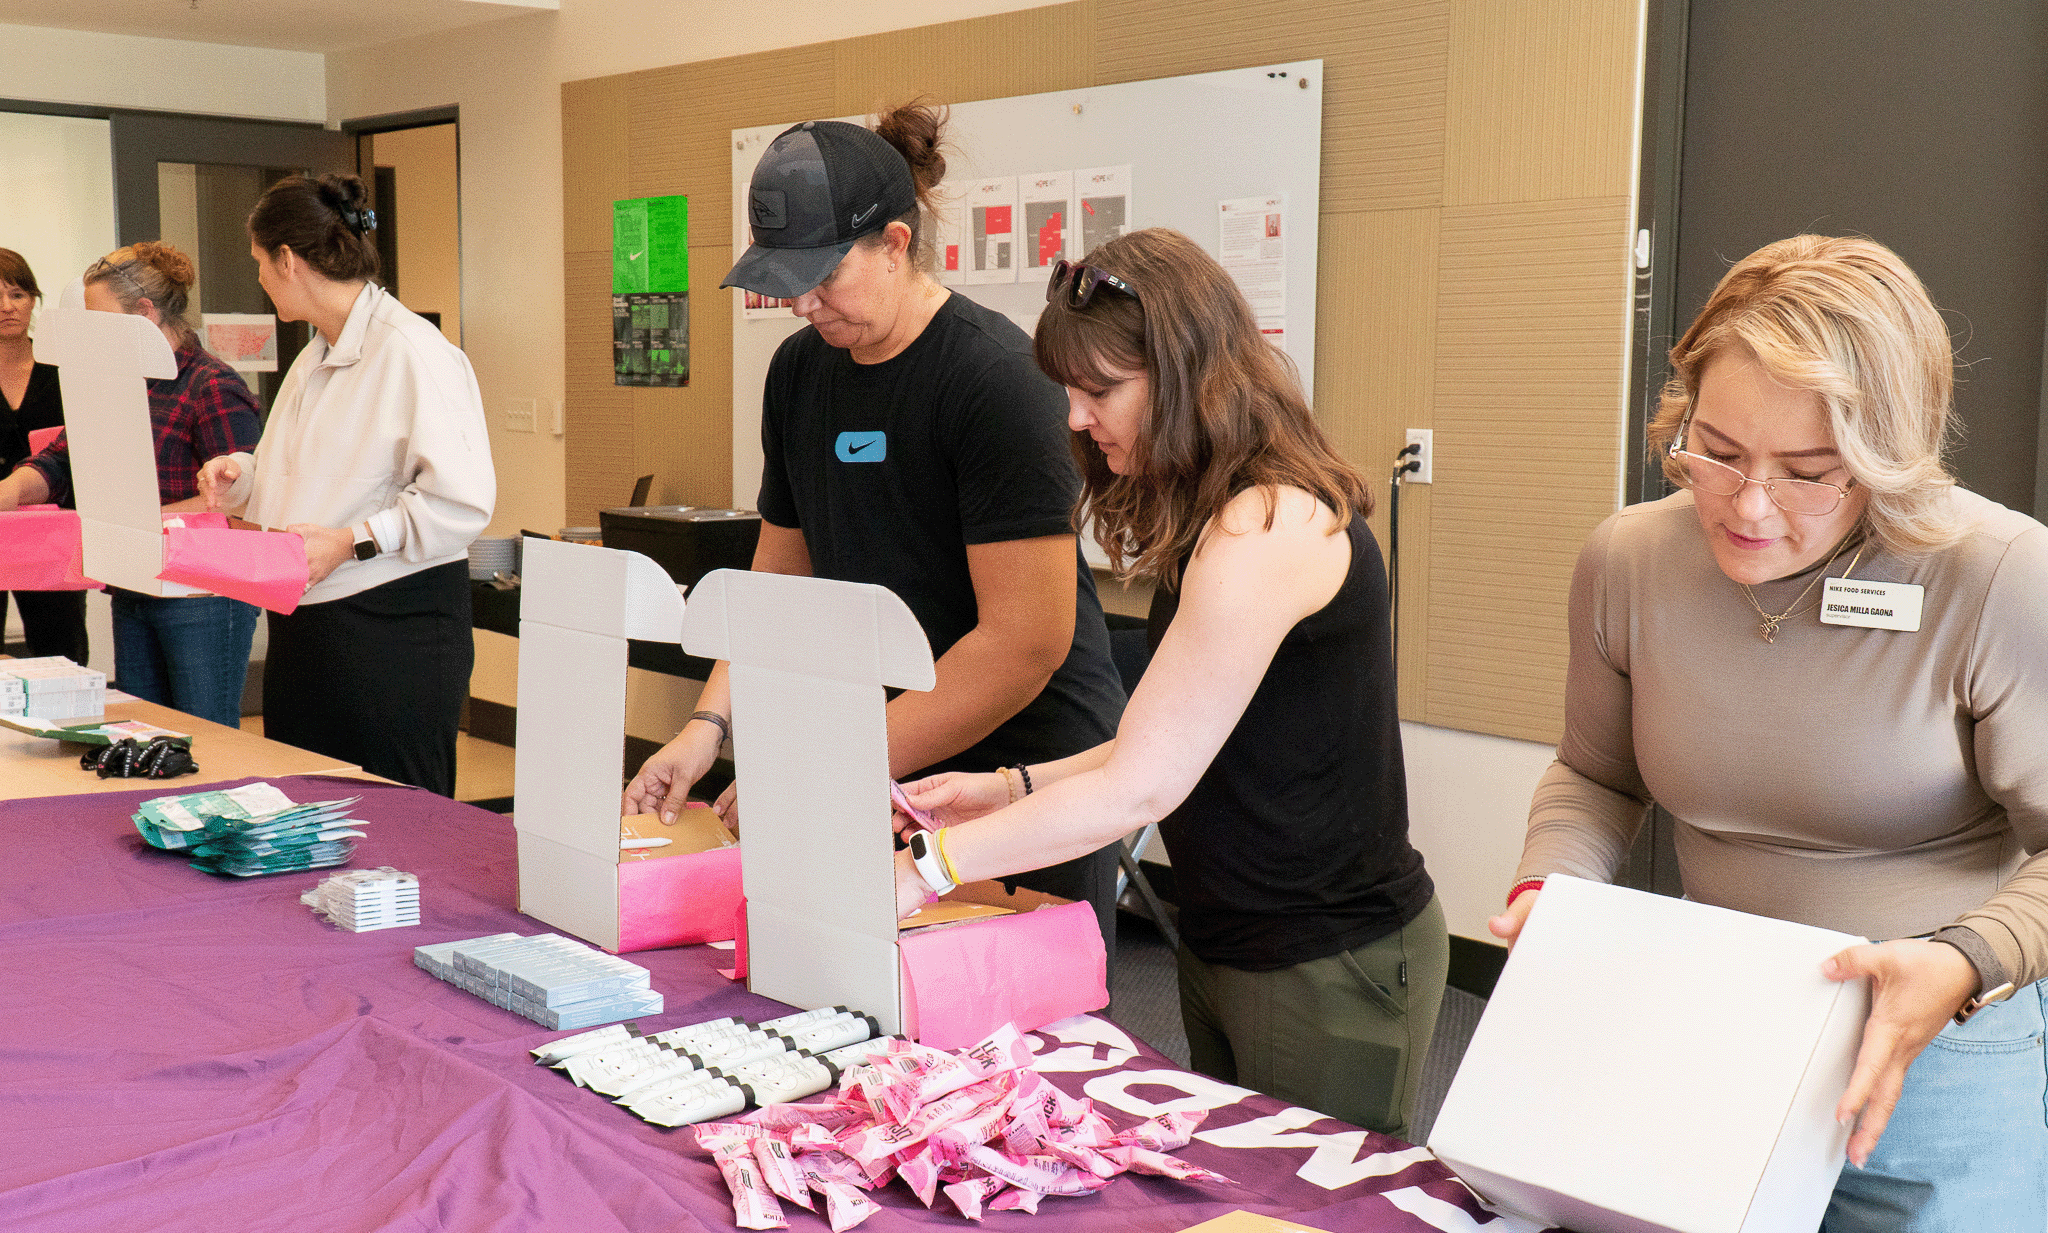
Popcorn for People.
Sign Up for News Alerts
Be the first to know about the latest press releases, feature stories, podcasts, and vlogs.

[](https://twitter.com/share?text=share text&url=https://www.aramark.com/newsroom/news/2026/november/more-than-a-month--aramark-s-year-round-commitment-to-disability)[](https://www.linkedin.com/shareArticle?text=share text&url=https://www.aramark.com/newsroom/news/2026/november/more-than-a-month--aramark-s-year-round-commitment-to-disability&mini=true&title=share text)

Privacy Preference Center
When you visit any website, it may store or retrieve information on your browser, often in the form of cookies. This information might be about your preferences or your device and is mostly used to make the site work as you expect it to. The information does not usually directly identify you, but it can give you a more personalized web experience. Because we respect your right to privacy, you can choose whether to allow or disallow certain categories of cookies on Aramark’s websites. Click on the category headings below to find out more about the categories of cookies and change our default settings. However, please understand that blocking some categories of cookies may impact your experience on the site and the services we are able to offer.
In some cases, data obtained from cookies is shared with third parties, which may be considered a “sale of personal information” under the California Consumer Privacy Act (CCPA). If you are a California resident, you may exercise your right to opt-out of that sharing at any time by disabling cookies. For more information about our use of cookies, please see our
Privacy Policy.
Allow All
Manage Consent Preferences
Strictly Necessary Cookies
Always Active
These cookies are used for the essential functions of our websites. They do not gather information about you that could be used for marketing purposes and do not remember where you have been on the internet. This category of cookies cannot be disabled, because doing so would impair the function of our website.
Functional Cookies
Functional Cookies
These cookies provide enhanced functionality and personalization on our website, such as remembering your preferences. They are set by Aramark or by third-party providers whose services we have added to our pages. If you do not allow these cookies, some or all of these services may not function properly. These cookies do not track your activity on other sites or store any personal data.
Performance Cookies
Performance Cookies
These cookies allow us to view broad categories of information regarding who comes to our websites. This information is used to improve our website functionality. We may use third-party analytic tools, such as Google Analytics, to help measure traffic and usage trends and to understand the demographics of our users.
Advertising Cookies
Advertising Cookies
These cookies are used to customize what ads you might see on our websites or ads from us on other websites. This information allows us to better tailor our offerings to you either through ads more appropriate to your needs, or to prevent repeated ads that you may not want.
Cookie List
Clear
Apply Cancel
Leg.Interest
checkbox label label
checkbox label label
checkbox label label
Reject All