Arista Networks, Inc. is a networking technology company that provides data center, campus, and wide area network (WAN) solutions. The company operates through three primary business segments: Core (AI, Cloud, and Data Center Networking), Cognitive Adjacencies (Campus and Routing), and Cognitive Networks (Software and Services). Its product portfolio includes high-speed Ethernet switches such as the Arista 7800R AI Spine, 7060 AI Leaf, and 7700R4 Distributed Etherlink Switch, as well as the 7280R4 Universal Leaf and 7500R3 and 7800R4 Universal Spine platforms for routing and data center interconnect. Arista also offers the VeloCloud SD-WAN portfolio for branch connectivity and a suite of software services, including the CloudVision management platform, Arista AVA for autonomous operations, and the Network Data Lake (NetDL) for telemetry and observability. The company serves a global customer base segmented into Cloud and AI Titans, AI and Specialty Providers, and Enterprise customers. Arista’s solutions are built on its Extensible Operating System (EOS) and focus on open standards, high-bandwidth connectivity for AI workloads, and automated network management to support distributed computing and edge inference.

Summarised from the company's own disclosures, fiscal year ended Feb 2026

Industry Communication Equipment Homepage arista.com
Sector Technology IR page investors.arista.com
Tags
ethernet switching, data center networking, ai networking, sd-wan, campus networking, network management software, telemetry, zero trust networking, cloud networking, wide area networking, Arista EOS, Arista NetDL, CloudVision, Arista AVA, VeloCloud, Arista 7800R AI Spine, Arista 7060 AI Leaf, Arista 7700R4 Distributed Etherlink Switch, Arista 7280R4 Universal Leaf, Arista 7500R3 Universal Spine, Arista 7800R4 Universal Spine, Etherlink
Press page —

Metrics

Valuation  
Market cap $ 248.745B
Market cap (USD) $ 248.745B
P/E 53.07
PEG 1.42
P/BV 15.12
P/S 20.92
P/OCF 47.48
P/FCF 49.58
Dividend yield —
Turnover / mcap —
Returns  
ROE 31.4%
ROI 28.4%
ROIC 25.8%
Profit margin 39.0%
Growth  
Revenue growing Yes
Profits growing Yes
Revenue up 3y Yes
Revenue up 5y Yes
Earnings growth 3y (net profit CAGR) 37.4%
Quality  
Profitable Yes
Margin expanding Yes
Buying back stock No
Diluting (TTM) No
Debt/Equity —
Podcast bulls (TTM) Sign up
Podcast bears (TTM) Sign up
Podcast sentiment (TTM) Sign up
Podcast sentiment % (TTM) Sign up
News sentiment (TTM) 30
Quality score 38.9%
Insiders  
Buys, 1w Sign up
Buys, 1m Sign up
Buys, 1y Sign up
Sells, 1w Sign up
Sells, 1m Sign up
Sells, 1y Sign up

Sign up to see this company's insider trades

Figure FY 2025 FY 2024 FY 2023 FY 2022 FY 2021 FY 2020 FY 2019 FY 2018 FY 2017 FY 2016 FY 2015 FY 2014 FY 2013
Revenue 9.006B 7.003B 5.86B 4.381B 2.948B 2.318B 2.411B 2.151B 1.646B 1.129B 837.591M 584.106M 361.224M
Net profit 3.511B 2.852B 2.087B 1.352B 840.854M 634.557M 859.867M 328.115M 423.201M 184.189M 121.102M 86.85M 42.46M
Free cash flow 4.252B 3.676B 2B 448.169M 951.12M 719.73M 947.283M 479.289M 616.348M 110.021M 180.544M 101.382M 14.332M

Figure FY 2025 FY 2024 FY 2023 FY 2022 FY 2021 FY 2020 FY 2019 FY 2018 FY 2017 FY 2016 FY 2015 FY 2014 FY 2013
Share price 131.03 110.53 235.51 121.35 143.75 290.57 203.4 210.7 235.58 96.77 77.84 60.76 —
Price performance 12m 0.19 -0.53 0.94 -0.16 -0.51 0.43 -0.03 -0.11 1.43 0.24 0.28 — —

Filed figures

Figure Dec 2016 Dec 2017 Dec 2018 Dec 2019 Dec 2020 Dec 2021 Dec 2022 Dec 2023 Dec 2024 Dec 2025
Balance sheet detail
Trade receivables (USD) 253M 247M 332M 392M 390M 517M 923M 1.02B 1.14B 1.89B
↳ YoY growth +75.5% -2.3% +34.1% +18.1% -0.6% +32.6% +78.7% +11.0% +11.3% +65.4%
↳ 5y CAGR +33.6% +32.2% +22.0% +15.3% +30.1% +25.3% +23.8% +37.1%
Lease liabilities (USD) — 37.7M 37.7M 99.1M 90.2M 76.8M 63.8M 65.5M 59.6M —
Cash and deposits (USD) 568M 859M 650M 1.11B 893M 621M 672M 1.94B 2.76B 1.96B
Intangible assets (USD) — 0.00 58.6M 45.2M 123M 93.6M 122M 88.8M 62M 289M
Right-of-use assets (USD) — — 0.00 87.8M 77.3M 65.2M 53.4M 55.9M 52M —
Cash flow detail
Operating cash flow (USD) 131M 632M 503M 963M 735M 1.02B 493M 2.03B 3.71B 4.37B
Purchases of property, plant and equipment (USD) -21.4M -15.3M -23.8M -15.8M -15.4M -64.7M -44.6M -34.4M -32M -120M
Change in receivables (cash effect) (USD) -109M 5.77M -77.9M -60.2M 10.7M -127M -402M -101M -106M -746M
Change in inventories (cash effect) (USD) -144M -69.7M 51.1M 20.9M -235M -170M -639M -655M 111M -413M
Change in payables (cash effect) (USD) 38.7M -30.1M 39.3M -1.94M 41.2M 66.7M 31.4M 199M -51.6M 261M
Share buybacks (cash effect) (USD) — 0.00 0.00 -266M -395M -412M -670M -112M -424M -1.6B
Income taxes paid (cash effect) (USD) -39.6M -44.2M -17.6M -32.8M -82.6M -190M -428M -686M -971M -1.1B
Share-based compensation (USD) 59M 75.4M 91.2M 101M 137M 187M 231M 297M 355M 439M
Operating cash flow before change in receivables (USD) 240M 626M 581M 1.02B 724M 1.14B 894M 2.14B 3.81B 5.12B
Free cash flow (OCF - PPE - intangibles) (USD) 110M 616M 479M 947M 720M 951M 448M 2B 3.68B 4.25B
Income detail
Research and development expense (USD) 274M 350M 442M 463M 487M 587M 728M 855M 997M 1.24B
↳ 5y CAGR +44.7% +35.0% +25.5% +18.4% +16.5% +15.8% +14.1% +16.6% +20.5%
Total comprehensive income (USD) 183M 423M 326M 864M 635M 832M 1.33B 2.12B 2.84B 3.54B
Comprehensive income to owners (USD) 183M 423M 326M 864M 635M 832M 1.33B 2.12B 2.84B 3.54B
Provision for credit losses (USD) -292,000 17,000 368,000 221,000 397,000 -154,000 — — — —
Credit cost ratio (credit losses / average receivables) (%) 0.1% 0.0% 0.1% 0.1% 0.1% 0.0% — — — —
Reported Feb 17, 2017 Feb 14, 2020 Feb 14, 2020 Feb 14, 2020 Feb 19, 2021 Feb 15, 2022 Feb 14, 2023 Feb 13, 2024 Feb 19, 2025 Feb 17, 2026

Sign up to see institutional holdings

Sign Up

Podcast Mentions

Sign up to see podcast mentions and sentiment

Sign Up

November 3, 2026

  • Download (opens in new window)

  • Delivered total revenues in Q3 2026 of approximately $3.66 billion, exceeding guidance of $3.3 billion while growing 58.5%, the highest year-over-year revenue growth since our IPO.

  • In partnership with AMD, Arm, Broadcom, d-Matrix, Meta, Microsoft, and Qualcomm, Arista launched open standards-based rack-scale architectures for scale-up and scale-out AI networks.

  • In September 2026, Arista was added to the S&P 100, an index comprised of 100 major blue-chip companies across multiple industry groups.

SANTA CLARA, Calif.--(BUSINESS WIRE)-- Arista Networks, Inc. (NYSE: ANET), an industry leader in data-driven, client-to-cloud networking for large AI, data center, campus, and routing environments, today announced financial results for its third quarter ended September 30, 2026.

“Arista registered another momentous quarter with the highest year-over-year revenue growth since our IPO and record profitability, surpassing even my high expectations,” stated Jayshree Ullal, Chairperson and CEO of Arista Networks. “This strong momentum across customer sectors highlights our increased relevance for the generative and agentic AI era.“

Third Quarter Financial Highlights

  • Revenue of $3.66 billion, an increase of 20.5% compared to the second quarter of 2026, and an increase of 58.5% from the third quarter of 2025.
  • GAAP and non-GAAP operating margin of 44.9% and 49.1%, respectively, compared to GAAP and non-GAAP operating margin of 42.4% and 48.6% in the third quarter of 2025.
  • GAAP and non-GAAP diluted earnings per share of $1.22 and $1.20, respectively, compared to GAAP and non-GAAP diluted earnings per share of $0.67 and $0.77 in the third quarter of 2025.

A reconciliation of the company’s non-GAAP financial measures to their most directly comparable GAAP measures has been provided in the financial statement tables included in this press release.

Commenting on the company's financial performance, Chantelle Breithaupt, CFO, said, "This quarter brought a true trifecta for our company, setting new record highs in revenue growth, net income, and EPS. I’m incredibly proud of the Arista team for their hard work in driving such outstanding performance for our shareholders."

Company Highlights

  • Arista announced open Ethernet rack-scale architectures for scale-up and scale-out AI fabrics – The new liquid-cooled portfolio leverages Ethernet for Scale-Up Networks (ESUN) and introduces the Etherlink™ SU-144 architecture, supporting up to 144 accelerators per rack in a single hop and scaling up to 1,024 XPUs via cross-rack topologies.
  • Arista detailed its scale-across networking strategy for distributed AI fabrics – Highlighting the flagship Arista 7800 AI Spine and unified Arista EOS®, the company outlined how Segment Routing over IPv6 (SRv6) multiplane forwarding, deterministic routing, and real-time congestion signaling enable lossless, high-radix AI fabrics across geographically distributed data centers up to one million XPUs.
  • Arista expanded AI-driven software security across its development lifecycle – Collaborating with the likes of Anthropic, Google, and OpenAI, Arista embedded domain-specific AI harnesses that accelerate proactive vulnerability discovery, building on the company’s track record of low CVEs and no-downtime upgrades.

Financial Outlook

For the fourth quarter of 2026, we expect:

  • Revenue of $3.9 - $4.0 billion;
  • Non-GAAP operating margin of 48 - 49%; and
  • Non-GAAP diluted net income per share of $1.26 - $1.30.

Guidance for non-GAAP financial measures excludes certain items, including stock-based compensation expense, intangible asset amortization, tax benefits on stock-based awards, the income tax effect on non-GAAP exclusions, and potential non-recurring charges or benefits. A reconciliation of non-GAAP guidance measures to corresponding GAAP measures is not available on a forward-looking basis without unreasonable effort because these exclusions can be uncertain or difficult to predict, including stock-based compensation expense and tax benefits on stock-based awards, which are impacted by the timing of employee stock transactions, and the future fair market value of the company’s common stock. The actual amount of these exclusions will have a significant impact on the company's GAAP gross margin, operating margin and diluted net income per share.

Prepared Materials and Conference Call Information

Arista's executives will discuss the third quarter 2026 financial results on a conference call today at 1:30 PM Pacific Time. To listen to the call via telephone, dial (888) 330-2502 in the United States or +1 (240) 789-2713 from international locations. The Conference ID is 5655862.

The financial results conference call will also be available via live webcast on Arista's investor relations website at https://investors.arista.com/ . Shortly after the conference call concludes, a replay of the audio webcast will be available on Arista’s investor relations website.

ARISTA NETWORKS, INC.
Condensed Consolidated Income Statements
(Unaudited, in millions, except per share amounts)
Three Months Ended September 30, Nine Months Ended September 30,
2026 2025 2026 2025
Revenue:
Product $ 3,190.0 $ 1,911.7 $ 8,106.5 $ 5,481.2
Service 467.6 396.6 1,295.8 1,036.7
Total revenue 3,657.6 2,308.3 9,402.3 6,517.9
Cost of revenue:
Product 1,255.1 745.5 3,264.5 2,125.5
Service 76.8 72.6 225.0 187.5
Total cost of revenue 1,331.9 818.1 3,489.5 2,313.0
Gross profit 2,325.7 1,490.2 5,912.8 4,204.9
Operating expenses:
Research and development 486.9 326.0 1,178.8 888.9
Sales and marketing 156.6 151.2 448.5 394.3
General and administrative 39.8 34.8 107.3 98.5
Total operating expenses 683.3 512.0 1,734.6 1,381.7
Income from operations 1,642.4 978.2 4,178.2 2,823.2
Other income (expense), net 273.1 98.9 513.0 289.1
Income before income taxes 1,915.5 1,077.1 4,691.2 3,112.3
Provision for income taxes 355.1 224.1 895.0 556.7
Net income $ 1,560.4 $ 853.0 $ 3,796.2 $ 2,555.6
Net income per share:
Basic $ 1.24 $ 0.68 $ 3.01 $ 2.03
Diluted $ 1.22 $ 0.67 $ 2.98 $ 2.00
Weighted-average shares used in computing net income per share:
Basic 1,262.2 1,258.0 1,260.0 1,258.1
Diluted 1,278.2 1,276.6 1,276.0 1,275.7
ARISTA NETWORKS, INC.
Reconciliation of Selected GAAP to Non-GAAP Financial Measures
(Unaudited, in millions, except percentages and per share amounts)
Three Months Ended September 30, Nine Months Ended September 30,
2026 2025 2026 2025
GAAP gross profit $ 2,325.7 $ 1,490.2 $ 5,912.8 $ 4,204.9
GAAP gross margin 63.6 % 64.6 % 62.9 % 64.5 %
Stock-based compensation expense 8.4 8.0 22.8 19.3
Intangible asset amortization 7.0 7.0 21.0 12.8
Non-GAAP gross profit $ 2,341.1 $ 1,505.2 $ 5,956.6 $ 4,237.0
Non-GAAP gross margin 64.0 % 65.2 % 63.4 % 65.0 %
GAAP income from operations $ 1,642.4 $ 978.2 $ 4,178.2 $ 2,823.2
GAAP operating margin 44.9 % 42.4 % 44.4 % 43.3 %
Stock-based compensation expense 138.1 127.9 379.4 306.1
Intangible asset amortization 15.3 15.8 45.9 26.4
Non-GAAP income from operations $ 1,795.8 $ 1,121.9 $ 4,603.5 $ 3,155.7
Non-GAAP operating margin 49.1 % 48.6 % 49.0 % 48.4 %
GAAP net income $ 1,560.4 $ 853.0 $ 3,796.2 $ 2,555.6
Stock-based compensation expense 138.1 127.9 379.4 306.1
Intangible asset amortization 15.3 15.8 45.9 26.4
(Gains)/losses on strategic investments (134.5 ) — (143.3 ) (10.9 )
Tax impact of the OBBB Act — 34.6 — 34.6
Tax benefits on stock-based awards(1) (40.0 ) (37.0 ) (105.3 ) (117.1 )
Income tax effect on non-GAAP exclusions(1) (8.5 ) (14.9 ) (32.2 ) (35.2 )
Non-GAAP net income(1) $ 1,530.8 $ 979.4 $ 3,940.7 $ 2,759.5
GAAP diluted net income per share $ 1.22 $ 0.67 $ 2.98 $ 2.00
Non-GAAP adjustments to net income per share(1) (0.02 ) 0.10 0.11 0.16
Non-GAAP diluted net income per share(1) $ 1.20 $ 0.77 $ 3.09 $ 2.16
Weighted-average shares used in computing diluted net income per share 1,278.2 1,276.6 1,276.0 1,275.7
Summary of Stock-Based Compensation Expense:
Cost of revenue $ 8.4 $ 8.0 $ 22.8 $ 19.3
Research and development 78.4 74.6 220.7 184.8
Sales and marketing 37.4 32.9 99.4 71.6
General and administrative 13.9 12.4 36.5 30.4
Total $ 138.1 $ 127.9 $ 379.4 $ 306.1

(1) Prior period amounts have been updated to conform to the current period presentation to reflect the change in methodology for calculating non-GAAP income taxes associated with stock-based awards. The retrospective application of this change resulted in an increase to non-GAAP net income of $17.1 million and $47.5 million for the three and nine months ended September 30, 2025, respectively. The impact of this change on non-GAAP diluted net income per share was an increase of $0.02 and $0.03 for the three and nine months ended September 30, 2025, respectively. Please refer to the discussions under "Non-GAAP Financial Measures" for further information with respect to this change.

ARISTA NETWORKS, INC.
Condensed Consolidated Balance Sheets
(Unaudited, in millions)
September 30, 2026 December 31, 2025
ASSETS
CURRENT ASSETS:
Cash and cash equivalents $ 2,288.1 $ 1,963.9
Marketable securities 12,070.9 8,779.1
Accounts receivable 2,327.8 1,886.9
Inventories 3,209.8 2,247.1
Prepaid expenses and other current assets 2,235.7 1,510.0
Total current assets 22,132.3 16,387.0
Property and equipment, net 378.8 203.1
Goodwill 416.1 416.1
Deferred tax assets 1,437.7 1,773.6
Other assets 899.2 668.8
TOTAL ASSETS $ 25,264.1 $ 19,448.6
LIABILITIES AND STOCKHOLDERS’ EQUITY
CURRENT LIABILITIES:
Accounts payable $ 682.6 $ 651.7
Accrued liabilities 640.8 475.4
Deferred revenue 5,102.2 4,002.6
Other current liabilities 296.4 246.8
Total current liabilities 6,722.0 5,376.5
Deferred revenue, non-current 1,737.3 1,369.8
Other long-term liabilities 358.1 331.8
TOTAL LIABILITIES 8,817.4 7,078.1
STOCKHOLDERS’ EQUITY:
Common stock 0.1 0.1
Additional paid-in capital 3,304.4 2,911.8
Retained earnings 13,243.2 9,446.6
Accumulated other comprehensive income (loss) (101.0 ) 12.0
TOTAL STOCKHOLDERS’ EQUITY 16,446.7 12,370.5
TOTAL LIABILITIES AND STOCKHOLDERS’ EQUITY $ 25,264.1 $ 19,448.6
ARISTA NETWORKS, INC.
Condensed Consolidated Statements of Cash Flows
(Unaudited, in millions)
Nine Months Ended September 30,
2026 2025
CASH FLOWS FROM OPERATING ACTIVITIES:
Net income $ 3,796.2 $ 2,555.6
Adjustments to reconcile net income to net cash provided by operating activities:
Depreciation, amortization and other 70.3 49.8
Stock-based compensation 379.4 306.1
Deferred income taxes 369.3 (202.5 )
Other (148.2 ) (23.5 )
Changes in operating assets and liabilities:
Accounts receivable, net (440.9 ) (348.9 )
Inventories (962.8 ) (321.1 )
Other assets (604.2 ) (683.7 )
Accounts payable 19.9 98.1
Deferred revenue 1,467.1 1,765.7
Income taxes, net (159.9 ) (105.2 )
Other liabilities 191.2 19.6
Net cash provided by operating activities 3,977.4 3,110.0
CASH FLOWS FROM INVESTING ACTIVITIES:
Proceeds from maturities of marketable securities 2,437.7 2,590.3
Proceeds from sale of marketable securities 598.0 41.4
Purchases of marketable securities (6,449.9 ) (4,816.3 )
Purchases of property and equipment (184.9 ) (82.5 )
Cash paid for business combinations, net of cash acquired — (300.0 )
Other (60.0 ) (10.0 )
Net cash used in investing activities (3,659.1 ) (2,577.1 )
CASH FLOWS FROM FINANCING ACTIVITIES:
Proceeds from issuance of common stock under equity plans 62.9 56.9
Tax withholding paid on behalf of employees for net share settlement (49.7 ) (44.3 )
Repurchases of common stock — (983.0 )
Other (3.7 ) —
Net cash provided by (used in) financing activities 9.5 (970.4 )
Effect of exchange rate changes (3.5 ) 1.7
NET INCREASE (DECREASE) IN CASH, CASH EQUIVALENTS AND RESTRICTED CASH 324.3 (435.8 )
CASH, CASH EQUIVALENTS AND RESTRICTED CASH —Beginning of period 1,965.3 2,763.8
CASH, CASH EQUIVALENTS AND RESTRICTED CASH —End of period $ 2,289.6 $ 2,328.0

Forward-Looking Statements

This press release contains “forward-looking statements” regarding our future performance, including but not limited to quotations from management, statements regarding our products, technologies and innovations, including their expected capabilities, performance and benefits, and statements in the section entitled “Financial Outlook,” such as estimates regarding revenue, non-GAAP operating margin and non-GAAP diluted net income per share for the fourth quarter of 2026. Forward-looking statements are subject to known and unknown risks, uncertainties, assumptions and other factors that could cause actual results, performance or achievements to differ materially from those anticipated in or implied by the forward-looking statements including but not limited to risks associated with: escalated or escalating U.S. tariffs and countermeasures and retaliatory actions taken by other countries; some of the key components in our products come from sole or limited sources of supply, which increases the risk of supply shortages, extended lead times or supply changes; key component supply constraints and inventory management; our reliance upon a predominant merchant silicon vendor; enhanced import/export restrictions, as well as countermeasures taken by affected countries; large purchases by a limited number of customers who represent a substantial portion of our revenue; adverse economic conditions, continuing uncertain economic conditions or reduced information technology and network infrastructure spending; volatility in our revenue and revenue growth rates; variability in our gross margins; variations in our results of operations; the rapid evolution of the networking market; failure to successfully carry out new products and service offerings and expand into adjacent markets; intense competition and industry consolidation; expansion of our international sales and operations; investments in or acquisitions of other businesses, products or technologies; industry cyclicality; fluctuations in currency exchange rates; failure to raise additional capital on terms satisfactory to us; our inability to attract new large customers or sell additional products and services to our existing customers; inability to grow sales of switching and routing platforms which generate most of our product revenue; inability to increase market awareness or acceptance of our new products and services; decreases in the sales prices of our products and services; long and unpredictable sales cycles; inability to offer high quality support and services offerings; declines in maintenance renewals and support contracts by customers; product quality problems, defects, errors or vulnerabilities in our products; failure to anticipate technological shifts; our dependence on third-party manufacturers to build our products; assertions by third parties of intellectual property rights infringement, misappropriation or other violations; failure or inability to protect or assert our intellectual property rights; cybersecurity incidents and breaches of our cybersecurity systems, or other security or privacy breaches or incidents; failure to detect cybersecurity incidents; failure to comply with government law and regulations; issues in the development and use of artificial intelligence, combined with an uncertain regulatory environment; future decisions to reduce or discontinue repurchasing our common stock pursuant to our stock repurchase programs; and other future events. Additional risks and uncertainties that could affect us can be found in our most recent filings with the Securities and Exchange Commission, including, but not limited to, our annual report on Form 10-K and quarterly reports on Form 10-Q. You can locate these reports through our website at https://investors.arista.com/ and on the SEC’s website at https://www.sec.gov/ . All forward-looking statements in this press release are based on information available to the company as of the date hereof, and we disclaim any obligation to publicly update or revise any forward-looking statement to reflect events that occur or circumstances that exist after the date on which they were made.

Non-GAAP Financial Measures

This press release and accompanying table contain certain non-GAAP financial measures, including non-GAAP gross profit, non-GAAP gross margin, non-GAAP income from operations, non-GAAP operating margin, non-GAAP net income, and non-GAAP diluted net income per share. These non-GAAP financial measures exclude stock-based compensation expense, intangible asset amortization, gains/losses on strategic investments, tax impact of the OBBB Act, and the income tax effect of these non-GAAP exclusions, including the recognition of direct excess tax benefits associated with stock-based awards. Effective the fourth quarter of fiscal year 2025, the company updated its methodology for calculating the income tax effect of non-GAAP adjustments. Previously, the company’s calculation excluded all tax benefits associated with stock-based awards, consisting of both direct excess tax benefits and other discrete indirect effects. Under the updated methodology, the company continues to exclude direct excess tax benefits but no longer excludes the discrete indirect effects of such awards. Management believes this change better aligns with industry practice and provides a more meaningful view of the company’s effective tax rate. All prior period non-GAAP results presented in this release have been recast to conform to the current period presentation.

The company uses these non-GAAP financial measures internally in analyzing its financial results and believes that these non-GAAP financial measures are useful to investors as an additional tool to evaluate ongoing operating results and trends. In addition, these measures are the primary indicators management uses as a basis for its planning and forecasting for future periods.

Non-GAAP financial measures are not meant to be considered in isolation or as a substitute for the comparable GAAP financial measures. Non-GAAP financial measures are subject to limitations and should be read only in conjunction with the company's consolidated financial statements prepared in accordance with GAAP. Non-GAAP financial measures do not have any standardized meaning and are, therefore, unlikely to be comparable to similarly titled measures presented by other companies. A description of these non-GAAP financial measures and a reconciliation of the company’s non-GAAP financial measures to their most directly comparable GAAP measures have been provided in the financial statement tables included in this press release, and investors are encouraged to review the reconciliation.

About Arista Networks

Arista Networks is an industry leader in data-driven, client-to-cloud networking for large AI, data center, campus, and routing environments. Its platforms deliver availability, agility, automation, analytics, and security through an advanced network operating stack. Arista is a recent S&P 100 member and was recognized on the 2026 Fortune 500 list of the largest United States corporations by revenue. For more information, visit www.arista.com .

ARISTA, EOS, Netdi, and Arista AVA are among the registered and unregistered trademarks of Arista Networks in jurisdictions worldwide. Other company names or product names may be trademarks of their respective owners. Additional information and resources can be found at www.arista.com .

Investor Contacts:

A****rista Networks, Inc.

**I****nvestor Advocacy
**Rudolph Araujo
Rod Hall
+1 (408) 547-8080
[email protected]

Source: Arista Networks, Inc.

View All News

IR Contact

The Arista IR Team

[email protected]

Quicklinks

Annual Report Arista Advantage Paper Email Alerts

Get In Touch Today Contact Us

Arista

Facebook Twitter LinkedIn

© 2026 Arista Networks, Inc. All rights reserved.

Powered By Q4 Inc. 5.192.4.2 (opens in new window)

The Next Frontier for AI Fabrics: Scale Across Networking Bull 2 Bear 0 Product/operations

Jayshree Ullal and Brendan Gibbs : Sep 22, 2026, 6:00:02 AM

Jayshree Ullal Artificial Intelligence 2026

The Next Frontier for AI Fabrics: Scale Across Networking

As AI training workloads and frontier models continue their exponential climb to support trillions of parameters and millions of AI accelerators, a harsh reality is setting in. Physical space constraints and restrictive power availability are a scarcity. This introduces the new dimension of pragmatic reality to move from centralized vertical stacks to horizontal distributed scale-across AI fabrics. Basically, scale-across transforms the long-distance extension of the local scale-up and scale-out AI cluster to achieve high compute density across geographies.

Scale-Across with 7800 AI Spine

The scarcity of compute capacity and megawatts of power mandates that the AI infrastructure must be designed thoughtfully at scale. The Arista 7800 platform continues to be the ideal flagship spine for scale-across applications, providing traffic isolation, contextual routing and security. Scale-across AI innovations deliver many L2/L3 switching features for programmable, deterministic routing, SRv6 multiplane forwarding, multi-tenancy traffic engineering, and load-balancing across regions capable of providing near-instantaneous (tens of uSec) recovery in the event of transient congestion, packet loss, or a physical failure of AI clusters, independent of location. It uses SRv6, or segment routing, which isn't new, but using it to load-balance an AI fabric is the game changer. In SRv6, the sender tags each packet with a stack of SRv6 segment ID's, dictating the exact path the packet will take. The system then uses real-time congestion signaling to dynamically shift packets away from hotspots. Leveraging the reliable, state-sharing Arista EOS as a single, unified operating system, this SRv6 intelligence is supported all the way from the scale-out fabric to the long-distance, scale-across routing. Our customers now get the combination of high scale/performance, reliability, and operational rigor that Arista is known for while connecting to different forms of coherent optics such as ZR/ZR+, and DWDM transport.

Reliable Multi-Site High-Performant Foundation

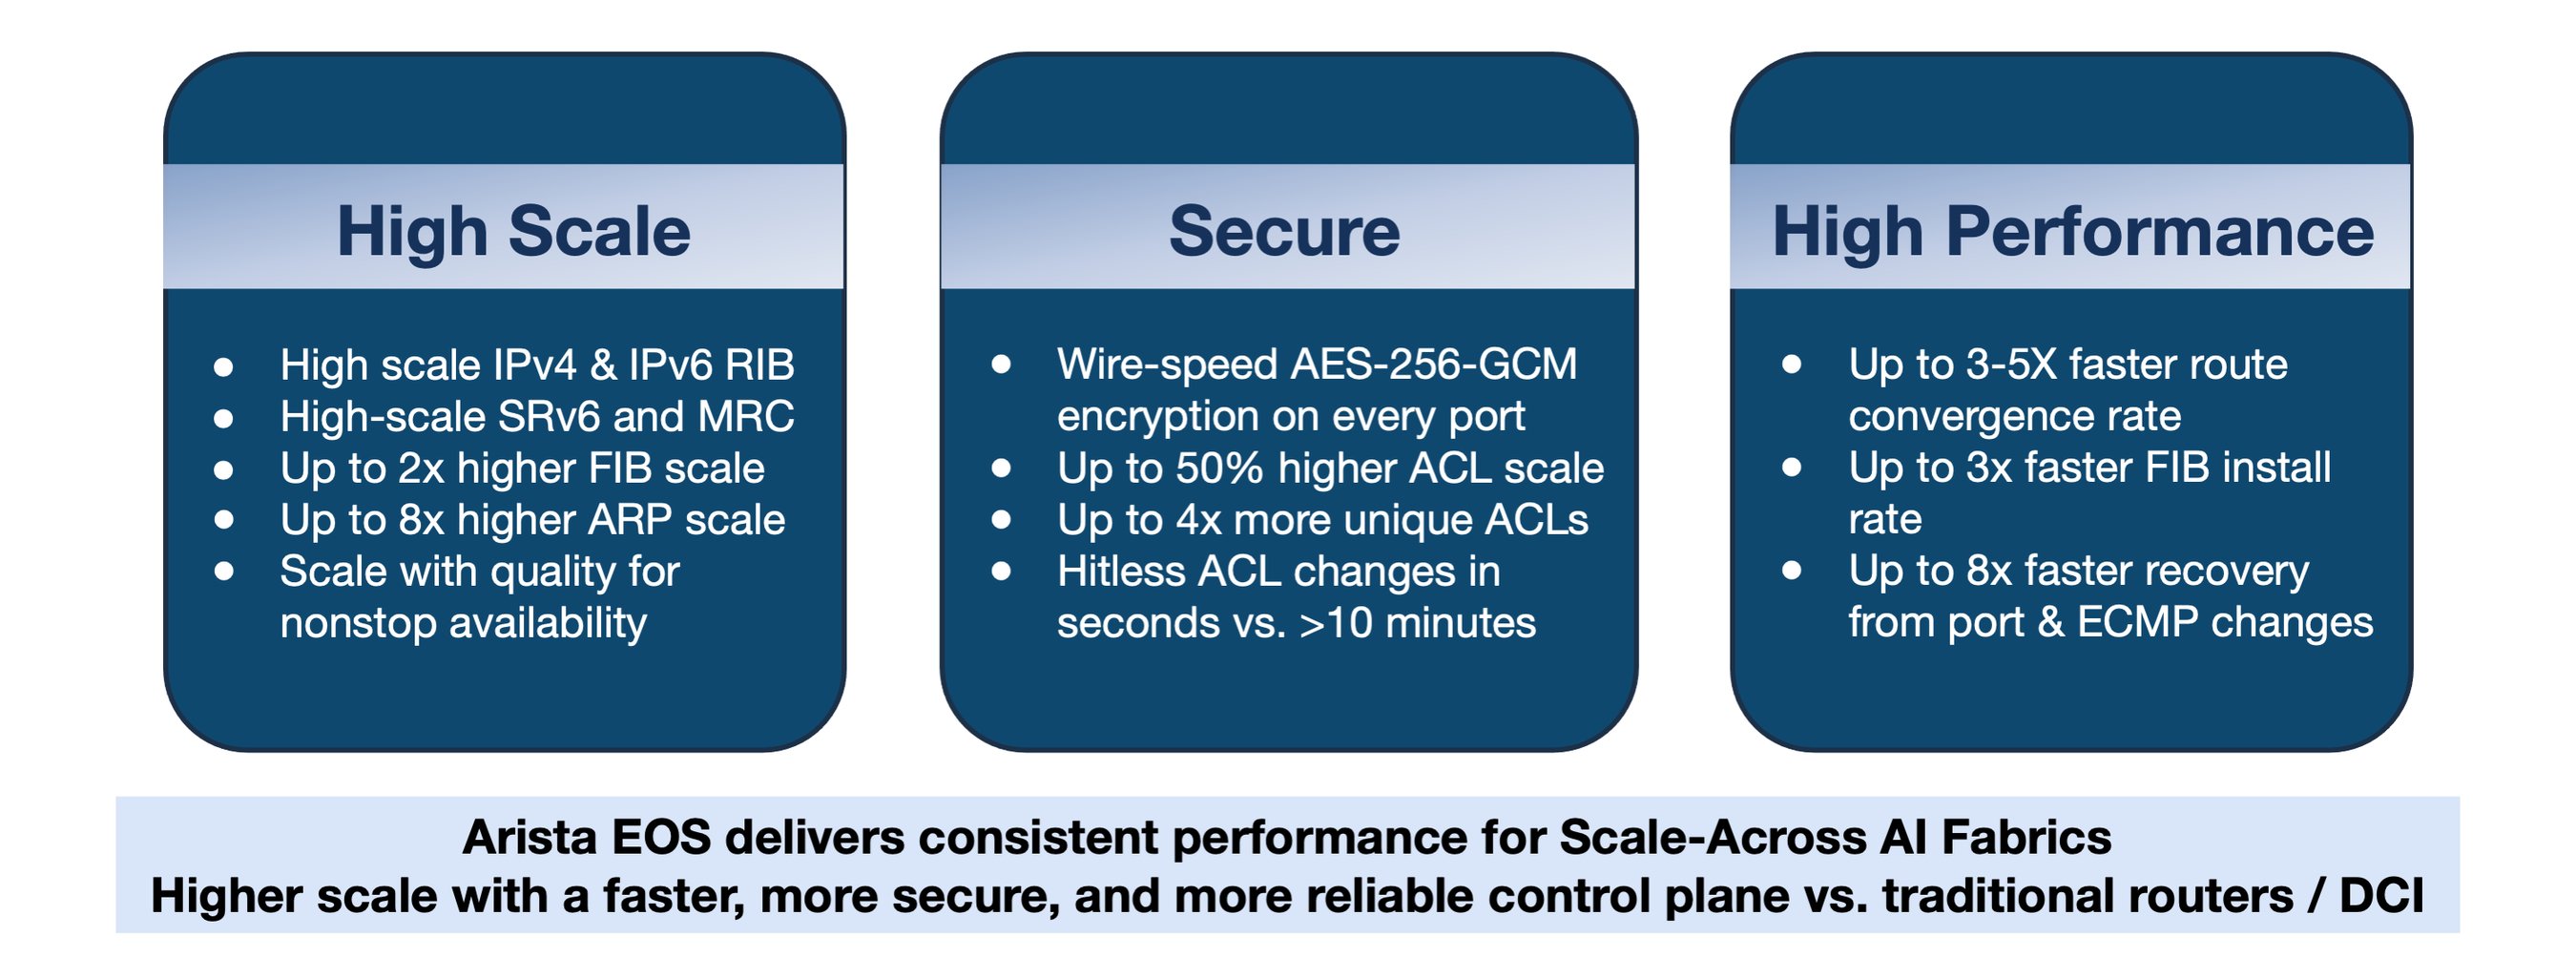
Stretching an AI compute fabric across distributed geographies isn’t just a matter of provisioning a standard Data Center Interconnect (DCI) link. AI workloads demand massive, highly synchronized, and bursty collective communication flows. If long-haul communications aren’t explicitly architected for these patterns, it becomes a structural bottleneck that severely degrades AI performance. Scale-across AI fabrics are designed not only to optimize performance in best case scenarios, but also to react gracefully when plans go awry and provide highly reliable, secure and uncompromised communication, as shown in Figure1 below.

26-8-27, Slides for Scale-Across Blog2

Figure 1: Arista Scale-Across is based on foundational principles of uncompromised scale, security and reliability

A typical scale-across AI network is designed for reliable, consistent, lossless packet transport, paired with real-time analytics to measure and validate performance. It means optimizing for consistently low end-to-end latency, with intelligent traffic engineering to steer workloads to local vs. remote sites, while incorporating buffering insurance to protect latency by avoiding packet loss during transient congestion. Scale-across builds upon the “hope for the best but prepare for the worst” in demanding AI networks.

“REACH” with Scale-Across Fabrics

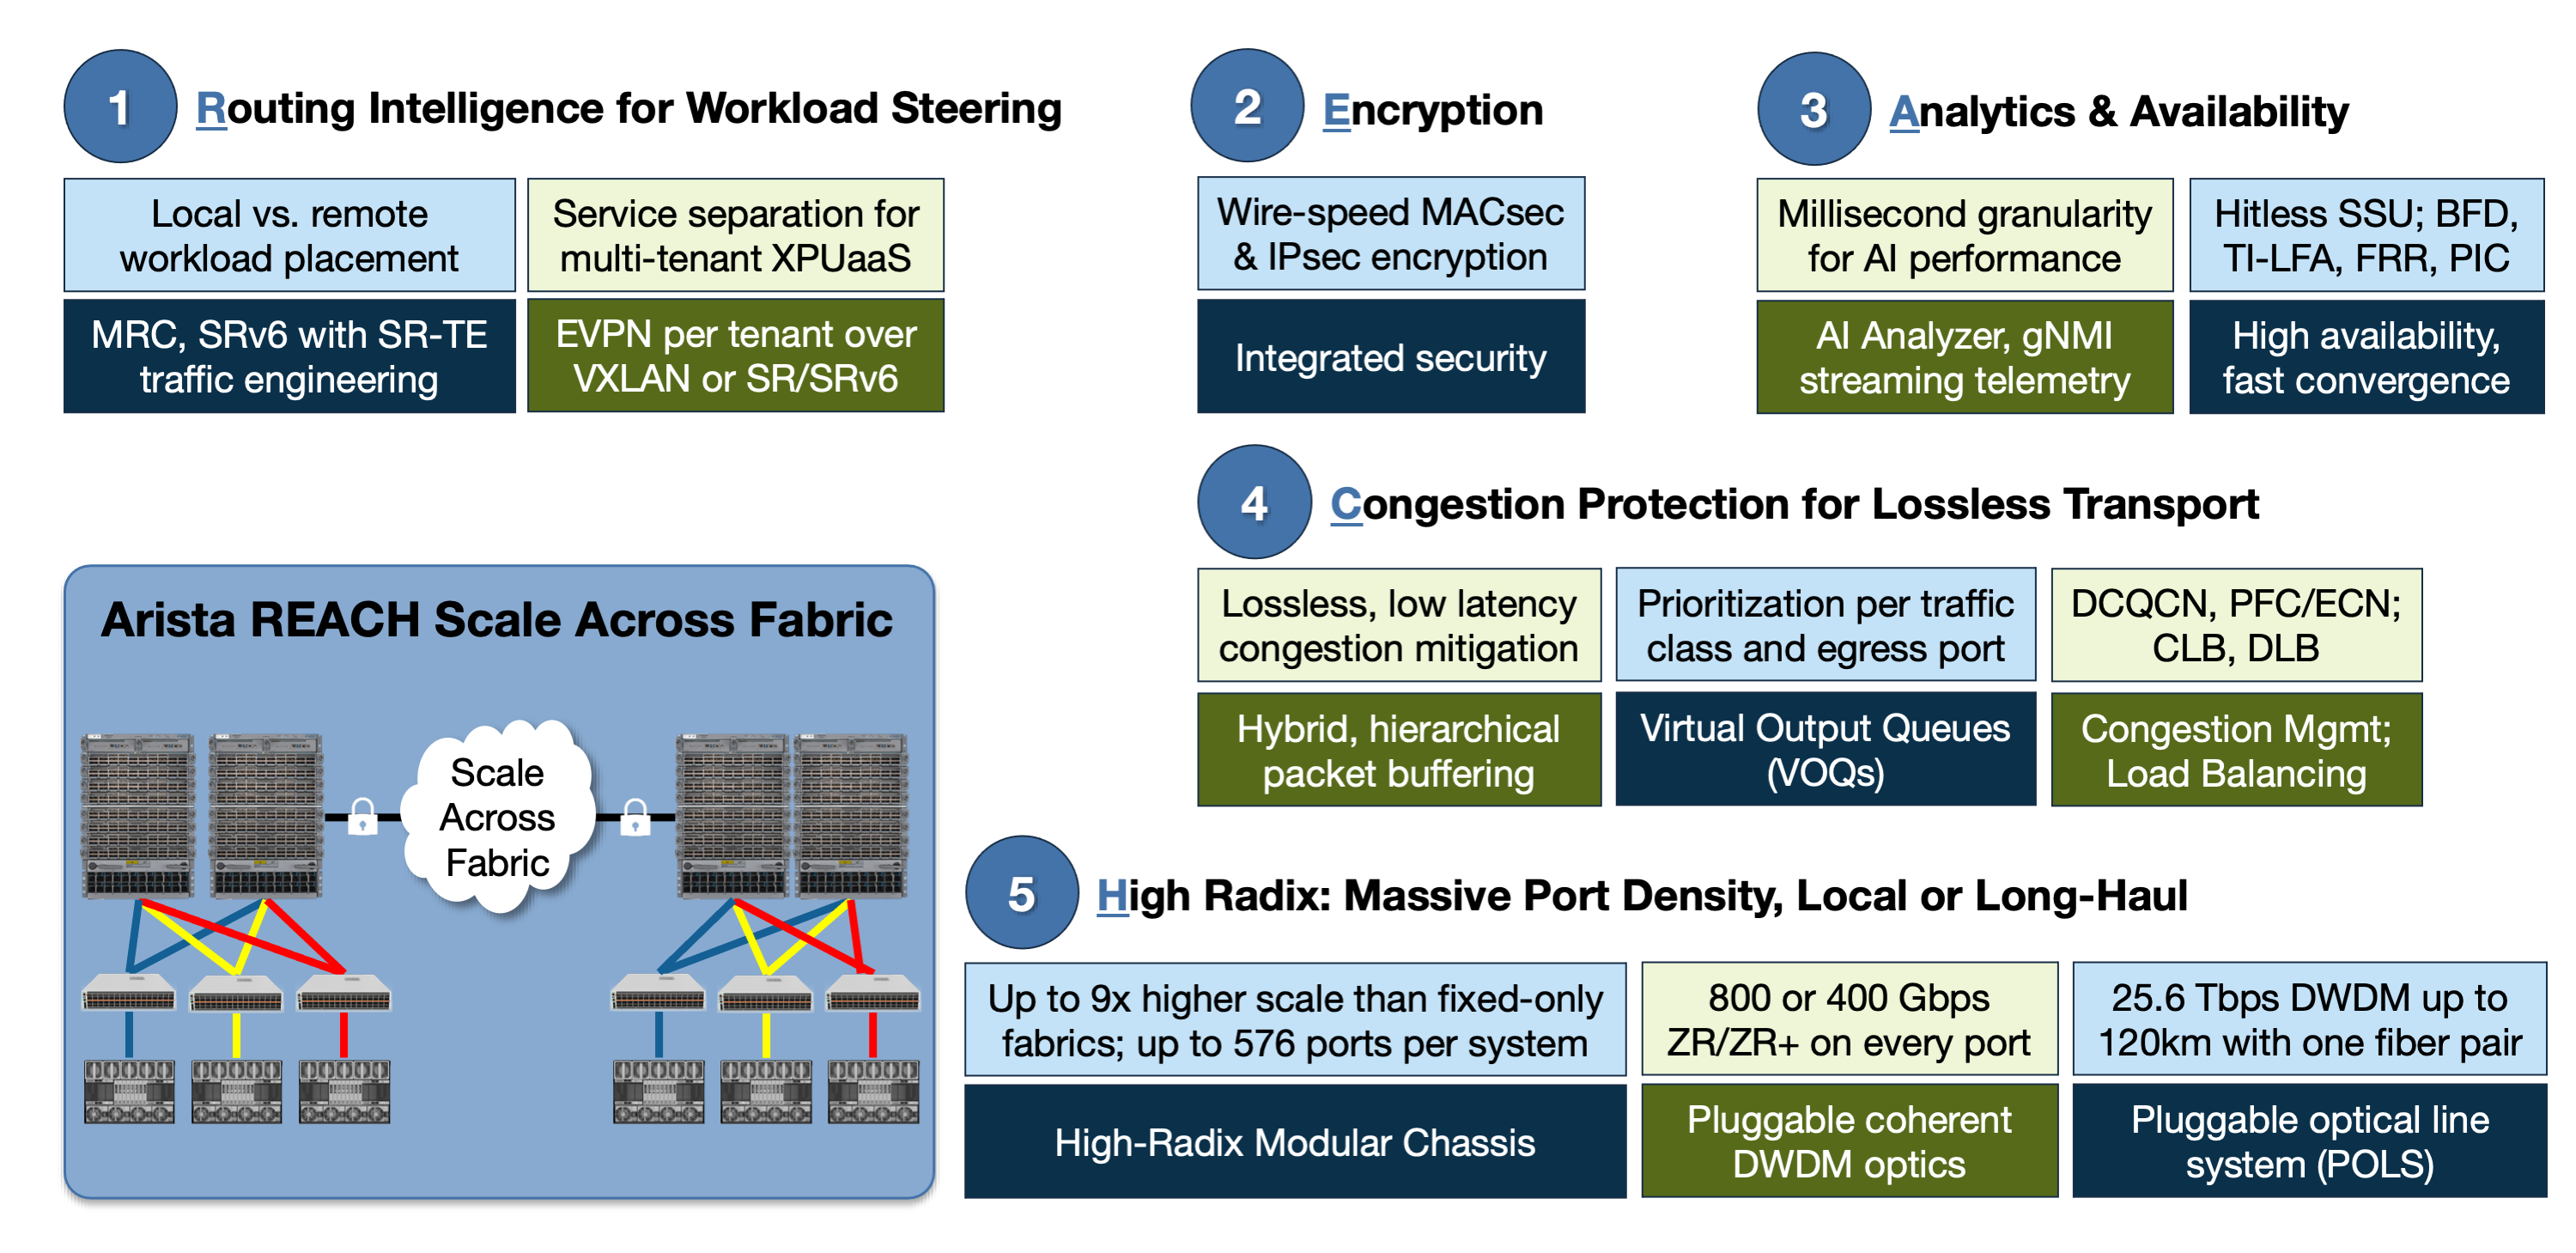
Arista enables optimized scale-across fabrics that extend REACH for AI workloads through a combination of foundational tenets that together deliver an essential suite of features for AI operators designing for consistent scale, performance and availability. Operating long-haul, scale-across networks without the protection of deep packet buffering is akin to riding a bike down a steep hill without a helmet. Arista’s REACH solution for scale-across AI fabrics includes:

  • Routing Intelligence: Modern AI fabrics require the intelligence of AI model routing at scale to handle ARP, FIB, and ACLs. The fabric must actively understand the latency and bandwidth profiles of your training jobs, intelligently steer workloads to optimize placement between local and remote domains. If you are pooling distributed compute resources, the scale-across network requires robust service separation to enforce per-tenant prioritization and policy control.
  • Encryption: Once AI workload traffic leaves the confines and security of your local data center, it becomes vulnerable to snooping eyes and malicious actors. Protection of scale-across fabrics with wire-speed, hardware-based encryption, built natively into every port with zero performance degradation must be ubiquitous.
  • Analytics & Availability: Workload-aware observability and availability are two sides of the same coin for intense AI traffic. The need for real-time visibility into ports, packet queues, flows, buffer utilization, and path latency across the entire scale-across AI fabric validates real-time performance. At the same time when an XPU gets hung up, immediate insight to the root cause as well as immediate recovery of the network with SSU (Smart system Upgrades) results in a closed-loop system to recover before training job completion times are impacted.
  • Congestion Protection: Intelligent features to avoid congestion combine with advanced recovery protocols and hierarchical, deep packet buffering to avoid packet loss when congestion does occur. Dropping packets has a far greater negative impact on net job completion time (JCT) than increased latency from transient packet buffering. It’s basic job (completion) insurance. This protects against packet loss under abnormal scenarios for the lowest JCT at global scale.
  • High Radix: Scale-across fabrics demand high density. If a local scale-out fabric might support up to hundreds of thousands of XPUs, scale-across fabrics can reach a rarefied scale of 1 million XPUs. Arista 7800 AI spines rise to the occasion by not only enabling local capacity but also seamlessly expanding AI fabrics to remote data centers. The 7800 switching fabrics guarantee optimal fair traffic distribution between all ports, so that scale-across destinations are first-class citizens alongside local hosts, as shown in Figure 2.

26-8-27, Slides for Scale-Across Blog

Figure 2: Arista REACH for Scale-Across AI Fabrics

Summary: Purpose-Built Network For AI Models

Not all routing is created equal. Legacy routers have many challenges with scale and recovery/convergence time of minutes, which do not meet the requirements of modern AI model routing. Arista’s modern AI routing was natively designed for AI/cloud-scale deployment using purpose-built software principles. It leverages merchant silicon designed for high-speed, lossless AI fabrics with fine-grained insights into AI performance and real-time availability of resources. Based on our philosophy of ONE operating system (EOS) across the entire Arista Etherlink AI portfolio for scale-up, scale-out and scale-across AI fabrics, the network brings consistent throughput for high utilization of expensive compute. Scale-across is designed to deliver uncompromised scale, security and reliability. Welcome to the new world of Arista’s scale-across REACH strategy for global scale without compromise.

 References

AI White Paper

Scale Across White Paper

AI Network Solution Guide

Powering Next-Gen AI Clusters: High-Performance Networking with AMD and Arista

Innovators Video

7800 AI Spine

Next-Gen Scale-Up Networking for AI Fabrics

Next-Gen Scale-Up Networking for AI Fabrics

Arihant Jain and Vijay Vusirikala : Oct 7, 2026, 6:00:00 AM

AI infrastructure is exploding beyond single-server boundaries. As models grow and workloads demand tightly synchronized communication across larger...

Artificial Intelligence 2026

Read More

The Next Frontier for AI Fabrics: Scale Across Networking

The Next Frontier for AI Fabrics: Scale Across Networking

Jayshree Ullal and Brendan Gibbs : Sep 22, 2026, 6:00:02 AM

As AI training workloads and frontier models continue their exponential climb to support trillions of parameters and millions of AI accelerators, a...

Jayshree Ullal Artificial Intelligence 2026

Read More

Racing Against Machine-Speed Threats: How Arista Is Using AI

Racing Against Machine-Speed Threats: How Arista Is Using AI

Kenneth Duda and Jason Bevis : Sep 2, 2026, 12:00:00 PM

Two decades into our journey, quality remains Arista's absolute top priority: networking you can count on. Thus, product security is a first...

2026

Read More

Contact & Help
Next-Gen Scale-Up Networking for AI Fabrics Bull 2 Bear 0 Product/operations

Arihant Jain and Vijay Vusirikala : Oct 7, 2026, 6:00:00 AM

Artificial Intelligence 2026

Next-Gen Scale-Up Networking for AI Fabrics

AI infrastructure is exploding beyond single-server boundaries. As models grow and workloads demand tightly synchronized communication across larger accelerator pools, local PCIe, CXL, and proprietary interconnects are no longer sufficient as the primary scale-up mechanism. They remain important within the server, but can create constrained compute islands across accelerator generations, system designs, and vendors. Operators are moving toward rack-scale scale-up domains, interconnecting tens to hundreds of XPUs across enclosures with high-bandwidth, low-latency links to operate as a single, tightly coupled supercomputing instance.

Expanding scale-up domains to hundreds of XPUs fundamentally shifts connectivity demands and creates a new compute+network-centric paradigm. The network is no longer simply the fabric between servers; it becomes part of the compute system itself. Just as Ethernet has become the leading open foundation for AI scale-out fabrics, the industry is now advancing Ethernet-based scale-up solutions for performance, openness, interoperability, and ecosystem choice.

Evolution from Server I/O → Rack-Scale

Recognizing the critical need for an open scale-up ecosystem, Arista galvanized the Ethernet for Scale-Up Networks (ESUN) initiative within OCP as a founding member alongside industry leaders such as Broadcom, Meta, and Microsoft. ESUN is focused on open Ethernet switching and framing for tightly coupled AI fabrics, including lossless delivery, error resiliency, and scale. A rack-scale scale-up fabric must deliver:

  • High Radix & Single-Hop Topologies: Support scale-up domains spanning beyond 72 or 144 XPUs to hundreds and ultimately thousands of accelerators while minimizing hop count.
  • Lossless Transport for Low Latency: Incorporating congestion control ensures deterministic, in-order packet delivery for tensor-parallel collective operations without tail-latency spikes.
  • Reliable 200G/Lane Systems: Engineered specifically for 224G (and beyond) signaling, optimizing Signal Integrity (SI) and Power Integrity (PI) while deploying advanced liquid cooling for high-density.
  • Advanced Diagnostic and Telemetry: A robust hardware diagnostic and telemetry layer to guarantee bit-error correction, secure boot, and physical validation whether running Arista EOS® or an open NOS like SONiC.
  • Robust and Resilient NOS: Massive bandwidth demands and XPU uptime require modern, robust, secure, battle-tested software running atop the network.
Three Rack-Scale Options

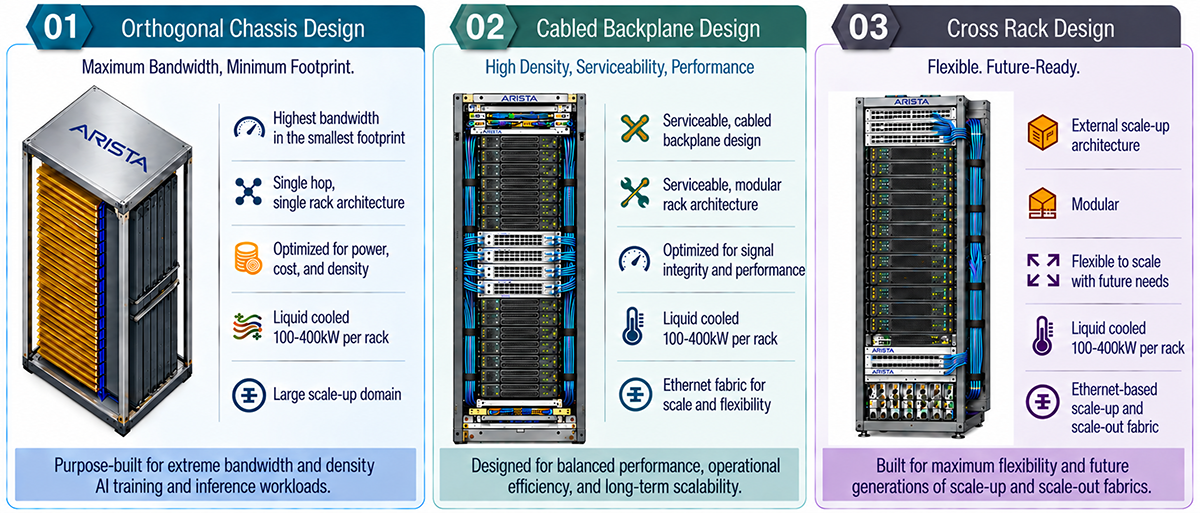
To accommodate diverse datacenter footprints, thermal profiles, and accelerator architectures, Arista has pioneered three specialized liquid-cooled physical scale-up rack solutions in partnership with AMD, Arm, Broadcom, d-Matrix, Meta, Microsoft, and Qualcomm. Inspired by OCP’s open infrastructure direction, these designs provide a flexible path to integrate compute, networking, power, and liquid cooling across evolving high-density AI deployments.

1. Orthogonal Chassis Design: Using direct orthogonal connectivity between accelerator and switch blades, supporting accelerator density of 144 XPUs in 100 kW to 400 kW direct liquid cooling envelopes.

2. Cabled Backplane Design: Combines a high-density cabled backplane with a modular rack structure to enable a highly serviceable design.

3. Cross-Rack Design: A modular architecture providing maximum flexibility to scale compute and networking across multi-rack deployments, enabling larger scaling domains across scale-up and scale-out.

Scale-Up-AI-Fabrics-Blog-1

Figure 1: Illustration of three rack-scale options

Arista Etherlink for Scale-Up: Supporting 144 Accelerators and Beyond

Arista's rack-scale Etherlink network architecture, designated as Etherlink SU-144, supports unified scale-up domains of up to 144 accelerators. With a cross-rack scale-up architecture, the number of XPUs grows to 1024 using multi-rack interconnects. Arista’s open architecture stands in contrast to proprietary scale-up configurations based on a locked-in accelerator and interconnect ecosystem. ESUN provides network operators flexibility across accelerators, switching silicon, optics, physical rack designs, and network software while retaining the high bandwidth, low latency, and reliable in-order delivery required for collective communication.

The Powerful Role of Diagnostics

At rack scale, raw bandwidth only matters if the physical system can be validated, monitored, and serviced predictably. Arista Netdi (Network Diagnostics Infrastructure) provides a common diagnostics and telemetry foundation at both the switch and rack level. Built on more than 8,000 person-years of development, it provides deep hardware-level validation, signal integrity analysis, secure boot attestation, and Single Event Upset (SEU) resiliency, supporting rich telemetry for the switch, physical optics, power shelves, and liquid cooling infrastructure. Netdi is entirely NOS-agnostic, giving customers full operational insight no matter which NOS they run. While Arista champions the freedom of NOS choice, Arista’s EOS remains the industry's leading resilient, secure NOS across all AI fabric roles, including scale-up networks, especially in an era of AI-enabled adversaries looking to exploit software vulnerabilities.

Arista provides an open path for cloud and enterprise operators to scale heterogeneous AI supercomputing infrastructures without vendor lock-in. It achieves this by combining standards-based ESUN transport, flexible physical topologies spanning orthogonal, cabled backplane, and cross-rack architectures, Etherlink SU-144 scale-up domains, and Arista Netdi™ hardware diagnostics. Welcome to the new era of rack scale-up networking!

 References

AI Innovators video

The Many Facets of AI Fabrics

AI white paper

Netdi white paper

Infrastructure Security Webinar

Press Release

Visit us at OCP booth number: E61

  • Share

Next-Gen Scale-Up Networking for AI Fabrics

Next-Gen Scale-Up Networking for AI Fabrics

Arihant Jain and Vijay Vusirikala : Oct 7, 2026, 6:00:00 AM

AI infrastructure is exploding beyond single-server boundaries. As models grow and workloads demand tightly synchronized communication across larger...

Artificial Intelligence 2026

Read More

The Next Frontier for AI Fabrics: Scale Across Networking

The Next Frontier for AI Fabrics: Scale Across Networking

Jayshree Ullal and Brendan Gibbs : Sep 22, 2026, 6:00:02 AM

As AI training workloads and frontier models continue their exponential climb to support trillions of parameters and millions of AI accelerators, a...

Jayshree Ullal Artificial Intelligence 2026

Read More

Racing Against Machine-Speed Threats: How Arista Is Using AI

Racing Against Machine-Speed Threats: How Arista Is Using AI

Kenneth Duda and Jason Bevis : Sep 2, 2026, 12:00:00 PM

Two decades into our journey, quality remains Arista's absolute top priority: networking you can count on. Thus, product security is a first...

2026

Read More

Contact & Help

Prompts

Arista Networks, Inc. (ticker ANET), listed in United States.

ETFs Holding Arista Networks, Inc.

ETF Weight in ETF Shares Market value As of
FDCF 6.84% 35,323 $ 6.912M Aug 31, 2026
AIFD 5.90% 40,972 $ 7.389M Jul 31, 2026
FCTE 4.96% 71,318 $ 12.116M Jun 30, 2026
USSE 4.93% 104,042 $ 17.675M Jun 30, 2026
TLG 4.90% 39,276 $ 6.672M Jun 30, 2026
CARK 4.85% 85,878 $ 15.488M Jul 31, 2026
FDND 4.81% 2,318 $ 455.904K Nov 11, 2026
FFF 4.55% 1,418 $ 288.691K Sep 30, 2026
PWRD 4.05% 326,610 $ 58.904M Jul 31, 2026
XPND 3.91% 7,351 $ 1.375M Nov 16, 2026
QIDX 3.84% 8,291 $ 1.495M Jul 31, 2026
GOP 3.64% 17,016 $ 3.182M Nov 17, 2026
BRIF 3.45% 31,329 $ 5.322M Jun 30, 2026
BCUS 3.37% 23,771 $ 4.912M Nov 12, 2026
CAML 3.13% 64,034 $ 11.549M Jul 31, 2026
AIPI 3.11% 70,191 $ 13.736M Aug 31, 2026
HFGO 3.09% 25,935 $ 0.00 Nov 18, 2026
TEC 3.00% 945 $ 186.439K Nov 13, 2026
GGTL 2.96% 2,328 $ 395.481K Jun 30, 2026
ARWG 2.94% 2,215 $ 433.453K Aug 31, 2026
KONG 2.85% 3,645 $ 619.213K Jun 30, 2026
BAI 2.81% 1,702,604 $ 318.421M Nov 16, 2026
SXQG 2.64% 7,629 $ 1.576M Nov 12, 2026
ILDR 2.64% 44,864 $ 8.39M Nov 16, 2026
IETC 2.60% 81,488 $ 15.24M Nov 16, 2026
AIS 2.59% 98,983 $ 18.512M Nov 17, 2026
CLCG 2.59% 4,054 $ 731.139K Jul 31, 2026
TXUG 2.57% 579 $ 113.305K Aug 31, 2026
CHAT 2.55% 194,902 $ 36.451M Nov 17, 2026
TCAI 2.49% 29,262 $ 5.726M Aug 31, 2026
ESLG 2.48% 3,203 $ 577.661K Jul 31, 2026
ABFL 2.43% 70,890 $ 12.785M Jul 31, 2026
RILA 2.40% 5,606 $ 1.011M Jul 31, 2026
AGRW 2.38% 14,861 $ 2.68M Jul 31, 2026
LCLG 2.36% 14,108 $ 2.544M Jul 31, 2026
BGRO 2.36% 1,104 $ 206.47K Nov 16, 2026
GPTY 2.34% 14,443 $ 2.701M Nov 17, 2026
XOVR 2.31% 297,689 $ 50.571M Jun 30, 2026
SEPI 2.27% 20,375 $ 3.461M Jun 30, 2026
CNAV 2.23% 8,163 $ 1.387M Jun 30, 2026
PRMR 2.22% 10,371 $ 2.03M Aug 31, 2026
BASG 2.18% 63,393 $ 10.769M Jun 30, 2026
FGSI 2.18% 226 $ 44.45K Nov 11, 2026
XDAT 2.17% 478 $ 81.203K Jun 30, 2026
FLCG 2.15% 67,976 $ 13.302M Aug 31, 2026
FDTX 2.12% 31,258 $ 6.117M Aug 31, 2026
MFSG 1.95% 37,796 $ 7.396M Aug 31, 2026
IQM 1.93% 13,344 $ 2.267M Jun 30, 2026
TEKY 1.89% 6,809 $ 1.157M Jun 30, 2026
DAK 1.85% 4,158 $ 780K Nov 18, 2026
NUGO 1.85% 249,937 $ 45.076M Jul 31, 2026
LRGE 1.83% 47,079 $ 7.998M Jun 30, 2026
TEK 1.82% 3,608 $ 674.768K Nov 16, 2026
SAWG 1.80% 287 $ 51.76K Jul 31, 2026
EQTY 1.78% 140,696 $ 25.375M Jul 31, 2026
TCAF 1.77% 1,021,174 $ 190.98M Nov 17, 2026
TGLB 1.68% 2,439 $ 439.874K Jul 31, 2026
FMAG 1.66% 22,660 $ 4.087M Jul 31, 2026
SPRX 1.58% 27,115 $ 4.606M Jun 30, 2026
REGS 1.55% 5,924 $ 1.006M Jun 30, 2026
TCAL 1.55% 27,342 $ 5.114M Nov 17, 2026
SOVF 1.51% 7,328 $ 1.322M Jul 31, 2026
RULE 1.50% 1,519 $ 258.048K Jun 30, 2026
JHAI 1.49% 1,928 $ 347.715K Jul 31, 2026
CGUS 1.38% 886,816 $ 165.852M Nov 16, 2026
AGIX 1.34% 63,478 $ 10.784M Jun 30, 2026
KOOL 1.32% 4,534 $ 770.236K Jun 30, 2026
ACVF 1.32% 11,120 $ 2.005M Jul 31, 2026
BRCE 1.30% 2,464 $ 482.18K Aug 31, 2026
NQLT 1.30% 3,248 $ 635.601K Aug 31, 2026
CLSE 1.30% 59,605 $ 11.664M Aug 31, 2026
VUS 1.28% 1,272 $ 229.405K Jul 31, 2026
FFOG 1.23% 22,592 $ 3.838M Jun 30, 2026
TGRT 1.22% 104,472 $ 19.538M Nov 17, 2026
LGRO 1.18% 8,549 $ 1.673M Aug 31, 2026
DARP 1.14% 1,674 $ 313.071K Nov 17, 2026
WINN 1.10% 64,922 $ 12.808M Nov 13, 2026
SMIZ 1.09% 15,323 $ 2.999M Aug 31, 2026
AFGR 1.06% 4,657 $ 870.952K Nov 16, 2026
MKTN 1.04% 6,528 $ 1.109M Jun 30, 2026
BCTK 1.01% 12,154 $ 2.065M Jun 30, 2026
WCEO 1.00% 555 $ 100.094K Jul 31, 2026
FWD 0.98% 160,726 $ 31.452M Aug 31, 2026
ACGR 0.98% 525 $ 102.737K Aug 31, 2026
NANC 0.97% 14,065 $ 2.63M Nov 17, 2026
HBTA 0.96% 12,169 $ 2.381M Aug 31, 2026
ROE 0.95% 12,557 $ 2.34M Nov 18, 2026
CGGO 0.85% 533,801 $ 99.831M Nov 16, 2026
TTEQ 0.83% 20,616 $ 3.856M Nov 17, 2026
FLCC 0.82% 5,535 $ 1.083M Aug 31, 2026
BAMG 0.80% 5,203 $ 1.018M Aug 31, 2026
ESUM 0.79% 8,019 $ 1.446M Jul 31, 2026
SGLC 0.78% 8,496 $ 1.663M Aug 31, 2026
ALRG 0.77% 358 $ 64.565K Jul 31, 2026
FELG 0.76% 252,693 $ 42.927M Jun 30, 2026
LSEQ 0.70% 631 $ 124.49K Nov 13, 2026
GQQQ 0.68% 6,044 $ 1.13M Nov 18, 2026
FFLC 0.65% 43,508 $ 7.847M Jul 31, 2026
AVUQ 0.65% 14,738 $ 2.756M Nov 16, 2026
FFLG 0.62% 20,379 $ 3.675M Jul 31, 2026