August 3, 2026 Ameresco Reports Second Quarter 2026 Financial Results Strong Second Quarter Performance Record $1.8 Billion in New Project Awards Led by Strong Momentum with Data Center Power Infrastructure Projects Total Backlog Increased 32% Y/Y to…
August 3, 2026
Ameresco Reports Second Quarter 2026
Financial Results
Strong Second Quarter Performance
Record $1.8 Billion in New Project Awards Led by Strong Momentum with Data Center
Power Infrastructure Projects
Total Backlog Increased 32% Y/Y to a Record $6.73 Billion
Increases 2026 EPS Guidance
Second Quarter 2026 Financial Highlights:
Revenues of $515.5 million
Net income attributable to common shareholders of $9.7 million
GAAP EPS of $0.18
Non-GAAP EPS $0.20
Adjusted EBITDA of $62.8 million
FRAMINGHAM, Mass.--(BUSINESS WIRE)-- Ameresco, Inc. (NYSE:AMRC), a leading
energy infrastructure company, today announced financial results for the second quarter
ended June 30, 2026. The Company also furnished supplemental information in conjunction
with this press release in a Current Report on Form 8-K. The supplemental information,
which includes Non-GAAP financial measures, has been posted to the “Investors” section of
the Company’s website at www.ameresco.com. Reconciliations of Non-GAAP measures to
the appropriate GAAP measures are included herein. All financial result comparisons made
are against the prior year period unless otherwise noted.
CEO George Sakellaris commented, “Outstanding second quarter results demonstrated
solid execution in key areas of our business, underscoring Ameresco’s position as a leading
energy infrastructure company that delivers integrated solutions to provide reliable power
and modernize critical building and public infrastructure. This performance supports our
expectation for 2026 to be another year of growth and increased profitability.
“One of the highlights of the quarter was the tremendous momentum we experienced in the
Power Infrastructure pillar of our business, which resulted in a record 65% increase in our
awarded backlog to $4.4 billion, providing substantial visibility for at least the next three to
four years. During the quarter, we had a record of $1.8 billion of new awards, driven by $1.2
billion for data center, and $600 million for our other key markets. We successfully advanced
three new behind the meter data center projects, bringing the total number of data center
projects in our awarded project backlog to five. The dollar amount related to data centers
that we added to our awarded backlog this quarter represents only a portion of their potential
total value. We expect to add additional contributions to awarded backlog and move projects
to contracted backlog as these projects reach further development and construction
milestones. And beyond these five data center power infrastructure projects already in our
awarded backlog, we have a growing number of additional opportunities in our pipeline,” Mr.
Sakellaris concluded.
Second Quarter Financial Results
(All financial result comparisons made are against the prior year period unless otherwise
noted.)
Q2 2026
(in thousands)
Projects
Revenue
$380,903
Net Income (Loss) (1)
Energy Assets
Q2 2025
$4,746
Adj. EBITDA
$17,500
Revenue
$358,088
Net Income (1)
$4,933
Adj. EBITDA
$16,295
$75,904
($2,751)
$34,831
$62,909
$3,426
$33,787
O&M
$36,193
$8,299
$9,795
$27,955
$2,647
$3,447
Other
$22,464
($576)
$683
$23,332
$1,858
$2,618
Total (2)
$515,464
$9,718
$62,809
$472,284
$12,864
$56,147
(1) Net Income (loss) represents net income (loss) attributable to common shareholders.
(2) Numbers in table may not sum due to rounding.
Total revenue increased 9% to $515.5 million, reflecting broad-based growth across each of
our core business lines and continued strong execution on project backlog conversion.
Project revenue increased 6% to $380.9 million, while Energy Asset revenue grew 21% to
$75.9 million, as we continued to expand our portfolio of owned operating assets. O&M
revenue increased 29% to $36.2 million, driven by the continued addition of new long-term
contracts. Gross margin expanded to 17.7%, reflecting a favorable business mix and strong
execution, with meaningful improvement on both a sequential and year-over-year basis.
Net income attributable to common shareholders was $9.7 million, or $0.18 per diluted
share, while Non-GAAP EPS was $0.20. Adjusted EBITDA increased 12% to $62.8 million,
outpacing revenue growth and reflecting strong operating execution, improved business mix
and the continued expansion of our higher margin recurring businesses. EPS reflected
higher depreciation and interest expense associated with the growth in our Energy Asset
portfolio, a lower tax benefit, and the non-controlling interest impact from the Neogenyx
transaction.
Project and Asset Highlights
Awarded Project Backlog (1)
At June 30, 2026
$4,424
Contracted Project Backlog
$2,302
Total Project Backlog
$6,726
12-month Contracted Backlog (2)
$1,100
New Contracts
$185
($ in millions)
New Awards (3)
Total O&M Revenue Backlog
$1,835
$1,519
12-month O&M Backlog
$118
Total Energy Asset Visibility (4)
$3,244
Total Revenue Visibility
$11,489
Energy Assets Placed into Operation
32 MWe
Energy Assets New Awards / Scope Changes (5)
Total Operating Energy Assets
(24) MWe
822 MWe
Ameresco's Net Assets in Development (6)
513 MWe
(1) Customer contracts that have not been signed yet
(2) We define our 12-month backlog as the estimated amount of revenues that we expect to recognize in the next twelve months from
our fully-contracted backlog
(3) Represents estimated future revenues from projects that have been awarded, though the contracts have not yet been signed
(4) Estimated contracted revenue and incentives during PPA period plus estimated additional revenue from operating RNG assets over
a 20-year period, assuming RINs at $1.50/gallon and brown gas at $3.50/MMBtu with $3.00/MMBtu for LCFS on certain projects
(5) The reduction is largely attributable to the non-controlling interest from Neogenyx
(6) Net MWe capacity includes only our share of any jointly owned assets
Balance Sheet and Cash Flow Metrics
($ in millions)
Total Corporate Debt (1)
Corporate Debt Leverage Ratio (2)
Non-Core Debt, International JVs (4)
June 30, 2026
$384.8
3.2X
$27.5
Total Energy Asset Debt (3)
$1,546.6
Energy Asset Book Value (5)
$2,236.3
Energy Debt Advance Rate (6)
69%
$(107.2)
Q2 Cash Flows from Operating Activities
Plus: Q2 proceeds from Sales of ITC
$20.4
Plus: Q2 Proceeds from Federal ESPC Projects
$21.5
Equals: Q2 Non-GAAP Adjusted Cash from Operations
$(65.3)
8-quarter rolling average Cash Flows from Operating Activities
($13.6)
Plus: 8-quarter rolling average Proceeds from Sales of ITC
$19.1
Plus: 8-quarter rolling average Proceeds from Federal ESPC Projects
$24.1
Equals: 8-quarter rolling average Non-GAAP Adjusted Cash from Operations
$29.6
(1) Subordinated debt, term loans, and drawn amounts on the revolving line of credit, net of debt discount and issuance costs
(2) Debt to EBITDA, as calculated under our Sr. Secured Credit Facility
(3) Term loans, sale-leasebacks and construction loan project financings for our Energy Assets in operations and in-construction and
development
(4) Non-core Debt associated with our international joint ventures
(5) Book Value of our Energy Assets in operations and in-construction and development
(6) Total Energy Asset Debt divided by Energy Asset Book Value
Unrestricted cash increased to $138.3 million with total corporate debt of $384.8 million. Our
corporate leverage was 3.2x, comfortably below our 3.5x covenant. We also strengthened
our capital position in Q2, securing $471.0 million of financing commitments, including the
$400 million related to the Neogenyx transaction. That capital gives us added flexibility to
fund growth, support working capital needs, and continue scaling the Energy Assets portfolio
in a disciplined way.
Adjusted Cash from Operations was negative in Q2, primarily due to the timing of project
execution, billings and collections. On a rolling eight-quarter basis, Adjusted Cash from
Operations was approximately $30 million, compared with $57 million last quarter, primarily
reflecting the timing and mix of activity in the period, along with the composition of the rolling
period.
Summary and Outlook
“The second quarter represented an important inflection point for Ameresco as our history of
successful large-scale integrated power solution deployments made us a trusted partner for
many high profile customers in the data center industry. We are experts in behind the meter
solutions, and those solutions now are becoming the go-to path for many data center
projects which do not have access to grid power. Our building and public infrastructure
projects and energy asset activities, together with these large-scale data center power
infrastructure opportunities, give Ameresco a tremendous runway for future growth,”
concluded CEO George Sakellaris.
Given our first-half performance, the visibility in our backlog, and the financing progress we
made in Q2, we remain confident in our outlook for 2026 and are reaffirming our full-year
guidance across all metrics and based on improved visibility into investment tax credits
expected to be realized in 2026, we are increasing our Non-GAAP EPS. Based on our
updated view, we now expect a tax benefit rate in the range of (25%) to (40%), which
increases our Non-GAAP EPS guidance range to be $1.15 to $1.35.
The expected additional tax benefit is supported by our planned transition to a new
accounting policy for transferable tax credits in the second half of the year. This
methodology better aligns earnings recognition with the period in which the investment tax
credits are generated, rather than allocating the benefit over the life of the related assets.
We expect the second half to follow our normal seasonal cadence, with activity weighted
somewhat more toward Q4, supported by continued project execution, backlog conversion,
and disciplined cost management.
FY 2026 Guidance Ranges
Revenue
Gross Margin
Adjusted EBITDA (1)
Depreciation & Amortization
Interest Expense & Other
Effective Tax Rate
Net Income Attributable to Non-Controlling Interest
Non-GAAP EPS (1)
$2.0 billion
17%
$2.2 billion
18%
$250 million
$115 million
$95 million
(25)%
$270 million
$116 million
$100 million
(40)%
($22) million
$1.15
($29) million
$1.35
(1) The Company’s Adjusted EBITDA and Non-GAAP EPS guidance excludes the potential impact of redeemable non-controlling
interest activity, one-time charges, energy asset and goodwill impairment charges, changes in contingent consideration, restructuring
activities, as well as any related tax impact.
Conference Call/Webcast Information
The Company will host a conference call today at 4:30 p.m. ET to discuss second quarter
2026 financial results, business and financial outlook, and other business highlights. To
participate on the day of the call, dial 1-888-596-4144, or internationally 1-646-968-2525,
and enter the conference ID: 4849290, approximately 10 minutes before the call. A live,
listen-only webcast of the conference call will also be available over the Internet. Individuals
wishing to listen can access the call through the “Investors” section of the Company’s
website at www.ameresco.com. If you are unable to listen to the live call, an archived
webcast will be available on the Company’s website for one year.
Use of Non-GAAP Financial Measures
This press release and the accompanying tables include references to adjusted EBITDA,
Non- GAAP EPS, Non-GAAP net income and adjusted cash from operations, which are
Non-GAAP financial measures. For a description of these Non-GAAP financial measures,
including the reasons management uses these measures, please see the section following
the accompanying tables titled “Exhibit A: Non-GAAP Financial Measures”. For a
reconciliation of these Non-GAAP financial measures to the most directly comparable
financial measures prepared in accordance with GAAP, please see Non-GAAP Financial
Measures and Non-GAAP Financial Guidance in the accompanying tables.
Defined Terms
More details on additional definitions used herein, such as total project backlog, awarded
backlog, contracted backlog, O&M backlog, 12-month backlog and assets in development
are provided in our periodic reports filed with the SEC.
About Ameresco, Inc.
Ameresco, Inc. (NYSE: AMRC) is a leading energy infrastructure company delivering
integrated solutions to create reliable power and modernize infrastructure. The company’s
Power Infrastructure business integrates energy resources across behind-the-meter and
utility-scale systems. Its Buildings & Public Infrastructure business modernizes the built
environment with smart, connected solutions that optimize performance and enhance
resilience. Ameresco is a trusted full lifecycle partner, delivering over $15 billion in solutions
and contracting over 5 GW of energy resources since its founding in 2000. Headquartered in
Massachusetts, Ameresco serves public and private sector customers across North America
and Europe. Learn more at www.ameresco.com.
Safe Harbor Statement
This release contains forward-looking statements within the meaning of Section 21E of the
Exchange Act, and Section 27A of the Securities Act. Statements that do not relate strictly to
historical or current facts are forward-looking. Without limiting the generality of the foregoing,
forward-looking statements contained herein specifically include expectations about market
conditions, pipeline, visibility, backlog and conversion thereof, pending agreements, new and
expanding market opportunities, financial guidance including estimated future revenues, net
income, adjusted EBITDA, Non-GAAP EPS, gross margin, effective tax rate, interest rate,
depreciation, tax attributes and capital investments; our expectations related to our
agreement with SCE including the impact of delays and any requirement to pay liquidated
damages, goals, strategies, investment objectives, plans and achievements and other
statements containing the words “projects,” “believes,” “anticipates,” “plans,” “expects,” “will”
and similar expressions .The forward-looking statements included herein involve risks and
uncertainties that could cause actual results to differ materially from projected results.
Accordingly, investors should not place undue reliance on forward-looking statements as a
prediction of actual results. The Company has based these forward-looking statements on
current expectations and assumptions about future events, taking into account all information
currently known by the Company. While the Company considers these expectations and
assumptions to be reasonable, they are inherently subject to significant business, economic,
competitive, regulatory and other risks and uncertainties, many of which are difficult to
predict and beyond the Company’s control. These risks and uncertainties include, but are
not limited to: (i) demand for our energy efficiency and infrastructure solutions and our ability
or inability to execute our strategic growth plan, including our ability to invest according to
plan, grow our businesses (including through joint ventures or other co-investment vehicles
and expand into new lines of business); (ii) the timing of, and ability to, enter into contracts
for awarded projects on the terms proposed or at all; (iii) the timing of work we do on projects
where we recognize revenue on a percentage of completion basis; (iv) the ability to perform
under signed contracts without delay and in accordance with their terms and the potential for
liquidated and other damages we may be subject to; (v) the fiscal health of the government
and the impact of any government shutdowns; (vi) our ability to complete and operate our
projects on a profitable basis and as committed to our customers; (vii) our cash flows from
operations and our ability to arrange financing to fund our operations and projects; (viii) our
customers’ ability to finance their projects and credit risk from our customers; (ix) our ability
to comply with covenants in our existing debt agreements; (x) the impact of macroeconomic
challenges, weather related events and climate change; (xi) our reliance on third parties for
our construction and installation work; (xii) availability and cost of labor and equipment; (xiii)
global supply chain challenges, component shortages and inflationary pressures; (xiv)
changes in federal, state and local government policies and programs related to our
business; (xv) the ability of customers to cancel or defer contracts included in our backlog;
(xvi) the output and performance of our energy plants and energy projects; (xvii)
cybersecurity incidents and breaches; (xviii) regulatory and other risks inherent to
constructing and operating energy assets; (xix) the effects of and ability to close our
acquisitions and joint ventures; (xx) seasonality in construction and in demand for our
products and services; (xxi) a customer’s decision to delay our work on, or other risks
involved with, a particular project; (xxii) the addition of new customers or the loss of existing
customers; (xxiii) market price of our Class A Common stock prevailing from time to time;
(xxiv) the nature of other investment opportunities presented to our Company from time to
time; (xxv) risks related to our international operation and international growth strategy; and
(xxvi) the other risks described in our periodic reports filed with the SEC, including under the
caption “Risk Factors” in Part I, Item 1A of our Annual Report. Except as required by law, we
undertake no obligation to update any forward-looking statements appearing in this press
release.
AMERESCO, INC.
CONDENSED CONSOLIDATED BALANCE SHEETS
(In thousands, except share amounts)
December
31,
2025
June 30,
2026
ASSETS
Current assets:
Cash and cash equivalents
Restricted cash
Accounts receivable, net
Accounts receivable retainage, net
Unbilled revenue
Inventory, net
Prepaid expenses and other current assets
Income tax receivable
(unaudited)
$
Project development costs, net
Total current assets
Federal ESPC receivable
Property and equipment, net
Energy assets, net
Deferred income tax assets, net
Goodwill, net
Intangible assets, net
Right-of-use assets, net
Restricted cash, non-current portion
138,333
87,125
252,600
36,517
889,726
12,642
235,861
3,265
24,211
$
$
71,785
92,515
257,856
53,618
799,109
12,609
239,865
2,166
23,010
Other assets
1,680,280
526,910
10,437
2,236,328
97,576
68,878
6,298
74,512
25,142
105,820
1,552,533
503,449
10,077
2,081,224
96,868
69,302
7,464
76,165
22,215
117,797
Total assets
$ 4,832,181
$ 4,537,094
$
$
LIABILITIES, REDEEMABLE NON-CONTROLLING INTERESTS AND STOCKHOLDERS' EQUITY
Current liabilities:
Current portions of long-term debt and financing lease liabilities, net
Accounts payable
Accrued expenses and other current liabilities
Current portions of operating lease liabilities
Deferred revenue
Income taxes payable
164,343
641,548
108,491
9,405
75,543
5,306
132,125
691,197
113,878
7,959
79,908
3,845
Total current liabilities
Long-term debt and financing lease liabilities, net of current portion, unamortized discount and debt
issuance costs
Federal ESPC liabilities
Deferred income tax liabilities, net
Deferred grant income
Long-term operating lease liabilities, net of current portion
Other liabilities
Redeemable non-controlling interests, net
Stockholders' equity:
Preferred stock, $0.0001 par value, 5,000,000 shares authorized, no shares issued and outstanding at
June 30, 2026 and December 31, 2025
Class A common stock, $0.0001 par value, 500,000,000 shares authorized, 37,168,046 shares issued
and 35,066,211 shares outstanding at June 30, 2026, 36,963,263 shares issued and 34,861,428 shares
outstanding at December 31, 2025
Class B common stock, $0.0001 par value, 144,000,000 shares authorized, 18,000,000 shares issued
and outstanding at June 30, 2026 and December 31, 2025
Additional paid-in capital
Retained earnings
Accumulated other comprehensive income (loss), net
1,004,636
1,028,912
1,794,492
527,957
1,031
4,991
53,080
94,900
—
1,749,708
478,970
2,943
5,385
55,938
91,003
1,419
—
—
3
3
2
565,164
688,127
(4,767)
(11,788)
2
395,656
696,737
(460)
(11,788)
1,236,741
114,353
1,351,094
1,080,150
42,666
1,122,816
$ 4,832,181
$ 4,537,094
Treasury stock, at cost, 2,101,835 shares at June 30, 2026 and December 31, 2025
Stockholders' equity before non-controlling interest
Non-controlling interests
Total stockholders’ equity
Total liabilities, redeemable non-controlling interests and stockholders' equity
AMERESCO, INC.
CONDENSED CONSOLIDATED STATEMENTS OF OPERATIONS
(In thousands, except per share amounts) (Unaudited)
Three Months Ended June
30,
2026
2025
Revenues
2026
2025
(Unaudited)
(Unaudited)
(Unaudited)
(Unaudited)
$
$
$
$
Cost of revenues
Gross profit
Earnings from unconsolidated entities
Selling, general and administrative expenses
Operating income
Interest expense and interest income, net
Other (income) expenses, net
Income before income taxes
Income tax expense (benefit)
Net income
Net income attributable to non-controlling interests and redeemable
non-controlling interests
Net income (loss) attributable to common shareholders
Net income (loss) per share attributable to common shareholders:
Basic
Diluted
Weighted average common shares outstanding:
Basic
Diluted
Six Months Ended June 30,
515,464
424,157
472,284
398,926
916,924
769,153
825,113
699,836
91,307
393
47,550
73,358
150
45,734
147,771
491
93,865
125,277
411
84,222
44,150
26,396
(2,290)
27,774
21,287
(6,131)
54,397
51,585
335
41,466
41,192
(7,926)
20,044
137
12,618
(2,900)
2,477
(3,047)
8,200
(1,712)
19,907
15,518
5,524
9,912
(14,089)
(2,531)
$
(10,189)
9,718
$
12,864
$
(8,565) $
7,381
$
$
0.18
0.18
$
$
0.24
0.24
$
$
(0.16) $
(0.16) $
0.14
0.14
52,987
53,835
(2,654)
52,638
52,821
52,937
52,937
52,591
52,897
AMERESCO, INC.
CONDENSED CONSOLIDATED STATEMENTS OF CASH FLOWS (in thousands) (Unaudited)
Six Months Ended June 30,
Cash flows from operating activities:
Net income
Adjustments to reconcile net income to net cash flows from operating activities:
Depreciation of energy assets, net
Depreciation of property and equipment
Increase in contingent consideration
Accretion of ARO liabilities
Amortization of debt discount and debt issuance costs
Amortization of intangible assets
Provision for credit losses
Gain on disposal of assets
Energy asset impairment
Non-cash production tax credits recognized
Non-cash project revenue related to in-kind leases
Earnings from unconsolidated entities
Unrealized loss (gain) from derivatives
Stock-based compensation expense
Deferred income taxes, net
Unrealized foreign exchange loss (gain)
Changes in operating assets and liabilities:
Accounts receivable
Accounts receivable retainage
Federal ESPC receivable
Inventory, net
Unbilled revenue
Prepaid expenses and other current assets
Income taxes receivable, net
Project development costs
Other assets
Accounts payable, accrued expenses and other current liabilities
Deferred revenue
Other liabilities
Cash flows from operating activities
Cash flows from investing activities:
Purchases of property and equipment
Capital investments in energy assets
Capital investments in major maintenance of energy assets
Proceeds from sale of investment tax credits
Contributions to equity method investments
Acquisitions, net of cash received
Cash flows from investing activities
Cash flows from financing activities:
Payments on long-term corporate debt financings
Proceeds from long-term corporate debt financings
Proceeds (payments) on senior secured revolving credit facility, net
Proceeds from long-term energy asset debt financings
Payments on long-term energy asset debt and financing leases
Proceeds from termination of interest rate swaps
Payments of debt discount and debt issuance costs
Proceeds from Federal ESPC projects
Net payments on energy asset receivable financing arrangements
Proceeds from exercises of options and ESPP
Contributions from non-controlling interests, net of fees
Distributions to non-controlling interest
Payments on debt and financing leases
Investment fund call option exercise
Distributions to redeemable non-controlling interests, net
Cash flows from financing activities
2026
2025
(Unaudited)
$
5,524
(Unaudited)
$
9,912
57,251
1013
—
248
3,696
1130
11
—
334
(6,958)
285
(491)
210
7,555
(2,485)
1272
46,839
1180
71
216
2,849
1120
9
(1,343)
—
—
(4,509)
(411)
(2,967)
6,595
(2,916)
(3,224)
4,026
12,721
12,395
(24,747)
374
(101,681)
12,131
(6,232)
(2,036)
(4,119)
(29,135)
(1,123)
(261)
(4,447)
(36,661)
(832)
18,479
(17,241)
(1,314)
(2,509)
(4,472)
(84,147)
7,207
4,618
(71,813)
(55,177)
(1,404)
(213,209)
(15,901)
20,411
(165)
—
(569)
(208,126)
(10,080)
70,788
(24,074)
(3,972)
(210,268)
(176,033)
(3,063)
45,000
3,000
235,077
(205,024)
—
(2,506)
48,110
(388)
1494
228,429
(2,290)
—
(622)
—
347,217
(15,500)
100,000
(32,000)
290,159
(154,223)
2,808
(6,763)
35,415
(207)
1298
3,799
(2,851)
—
—
—
221,935
(1,051)
2914
64,085
186,515
(6,361)
198,378
Effect of exchange rate changes on cash
Net increase (decrease) in cash, cash equivalents, and restricted cash
Cash, cash equivalents, and restricted cash, beginning of period
$
Cash, cash equivalents, and restricted cash, end of period
250,600
$
192,017
Non-GAAP Financial Measures (Unaudited, in thousands)
Three Months Ended June 30, 2026
Energy
Projects
Assets
O&M
Other Consolidated
$
4,746 $ (2,751) $ 8,299 $ (576) $
9,718
Adjusted EBITDA:
Net income (loss) attributable to common shareholders
Impact from non-controlling interests and redeemable non-controlling
interests (1)
(198)
Plus (less): Income tax provision (benefit)
Plus: Interest and other expenses, net
(4,921)
—
—
2,168
(2,601)
344
226
137
7,107
15,593
665
741
24,106
Plus: Depreciation and amortization
840
28,889
252
150
30,131
Plus: Stock-based compensation
2,511
494
233
141
3,379
2
1
326
128
$ 17,500
$ 34,831
Plus: Contingent consideration, restructuring and other charges
Adjusted EBITDA
4.6%
Adjusted EBITDA margin
$ 9,795 $ 683
45.9%
27.1%
(5,119)
457
$
3.0%
62,809
12.2%
(1) Non-controlling interests share of EBITDA differs from the non-controlling interest reported in net income due to the impacts of
interest, depreciation, taxes and amortization in our operating joint ventures.
Adjusted EBITDA:
Net income attributable to common shareholders
Three Months Ended June 30, 2025
Energy
Projects
Assets
O&M
Other
Consolidated
$ 4,933 $
3,426
$ 2,647
$ 1,858
$ 12,864
Impact from redeemable non-controlling interests
—
(450)
—
—
(450)
415
(3,416)
54
47
(2,900)
4,814
9,722
249
371
15,156
Plus: Depreciation and amortization
977
23,803
260
159
25,199
Plus: Stock-based compensation
2,845
499
222
184
3,750
Plus (less): Income tax provision (benefit)
Plus: Interest and other expenses, net
2,311
203
$ 16,295
$ 33,787
Plus: Contingent consideration, restructuring and other charges
Adjusted EBITDA
Adjusted EBITDA margin
Adjusted EBITDA:
Net income (loss) attributable to common shareholders
Impact from non-controlling interests and redeemable non-controlling
interests (1)
4.6%
15
$
(1)
3,447
53.7%
$
12.3%
2,618
2,528
$
11.2%
56,147
11.9%
Six Months Ended June 30, 2026
Energy
Projects
Assets
O&M
Other Consolidated
$
455 $ (19,422) $ 9,881 $ 521 $
(8,565)
(198)
(4,921)
—
—
(5,119)
533
(3,698)
72
46
(3,047)
Plus: Interest and other expenses, net
15,139
33,912
1,376
1,493
51,920
Plus: Depreciation and amortization
1,665
56,925
505
299
59,394
Plus: Stock-based compensation
5,532
1,126
547
350
7,555
Plus: Energy asset impairment
—
334
—
—
334
Plus: Contingent consideration, restructuring and other charges
216
589
3
2
810
$ 23,342
$ 64,845
$ 12,384
$ 2,711
$ 103,282
Plus (less): Income tax provision (benefit)
Adjusted EBITDA
Adjusted EBITDA margin
3.5%
47.5%
18.6%
6.4%
11.3%
(1) Non-controlling interests share of EBITDA differs from the non-controlling interest reported in net income due to the impacts of
interest, depreciation, taxes and amortization in our operating joint ventures.
Adjusted EBITDA:
Net income (loss) attributable to common shareholders
Impact from redeemable non-controlling interests
Six Months Ended June 30, 2025
Energy
Projects
Assets
O&M
Other
Consolidated
$ 5,326 $ (2,458) $ 3,380
$ 1,133
$
7,381
—
(975)
—
—
(975)
Plus (less): Income tax provision (benefit)
1,262
(3,225)
138
113
(1,712)
Plus: Interest and other expenses, net
8,967
22,853
607
839
33,266
Plus: Depreciation and amortization
1,941
46,345
539
314
49,139
Plus: Stock-based compensation
4,872
956
422
345
6,595
Plus: Contingent consideration, restructuring and other charges
Adjusted EBITDA
2,663
397
$ 25,031
$ 63,893
4.1%
Adjusted EBITDA margin
53.4%
23
$
5
5,109
$
9.7%
2,749
3,088
$
6.4%
96,782
11.7%
Three Months Ended June
Six Months Ended June 30,
30,
2026
2025
2026
2025
Non-GAAP net income and EPS:
Net income (loss) attributable to common shareholders
$
9,718
$
12,864
$
(8,565)
$
7,381
Adjustment for accretion of tax equity financing fees
—
(27)
(45)
(54)
Impact from redeemable non-controlling interests
547
(450)
547
(975)
Plus: Energy asset impairment
—
—
334
—
Plus: Contingent consideration, restructuring and other charges
457
2,528
810
3,088
Less: Income tax effect of Non-GAAP adjustments
(119)
(657)
(119)
(657)
Non-GAAP net income (loss)
Diluted net income (loss) per common share
$
10,603
$
14,258
$
(7,038)
$
8,783
$
0.18
$
0.24
$
(0.16)
$
0.14
0.02
Effect of adjustments to net income (loss)
$
0.03
0.02
$
0.27
$
(0.13)
$
0.16
Cash flows from operating activities
$ (107,209) $
(26,873)
$
(71,813)
$
(55,177)
Plus: proceeds from sales of ITC
20,411
70,788
20,411
70,788
Plus: proceeds from Federal ESPC projects
21,527
5,684
48,110
35,415
(65,271) $
49,599
Non-GAAP EPS
0.20
0.03
Non-GAAP Adjusted cash from operations:
Non-GAAP Adjusted cash from operations
$
$
(3,292)
$
51,026
Exhibit A: Non-GAAP Financial Measures
We use the Non-GAAP financial measures defined and discussed below to provide investors
and others with useful supplemental information to our financial results prepared in
accordance with GAAP. These Non-GAAP financial measures should not be considered as
an alternative to any measure of financial performance calculated and presented in
accordance with GAAP. For a reconciliation of these Non-GAAP measures to the most
directly comparable financial measures prepared in accordance with GAAP, please see NonGAAP Financial Measures and Non-GAAP Financial Guidance in the tables above.
We understand that, although measures similar to these Non-GAAP financial measures are
frequently used by investors and securities analysts in their evaluation of companies, they
have limitations as analytical tools, and investors should not consider them in isolation or as
a substitute for the most directly comparable GAAP financial measures or an analysis of our
results of operations as reported under GAAP. To properly and prudently evaluate our
business, we encourage investors to review our GAAP financial statements included above,
and not to rely on any single financial measure to evaluate our business.
Adjusted EBITDA and Adjusted EBITDA Margin
We define adjusted EBITDA as net income attributable to common shareholders, including
impact from non-controlling interests and redeemable non-controlling interests, before
income tax (benefit) provision, interest and other expenses net, depreciation and
amortization of intangible assets, accretion of asset retirement obligations, stock-based
compensation expense, energy asset and goodwill impairment, contingent consideration,
restructuring and other charges, gain or loss on sale of equity investment, and gain or loss
upon deconsolidation of a variable interest entity. We believe adjusted EBITDA is useful to
investors in evaluating our operating performance for the following reasons: adjusted
EBITDA and similar Non-GAAP measures are widely used by investors to measure a
company's operating performance without regard to items that can vary substantially from
company to company depending upon financing and accounting methods, book values of
assets, capital structures and the methods by which assets were acquired; securities
analysts often use adjusted EBITDA and similar Non-GAAP measures as supplemental
measures to evaluate the overall operating performance of companies; and by comparing
our adjusted EBITDA in different historical periods, investors can evaluate our operating
results without the additional variations of depreciation and amortization expense, accretion
of asset retirement obligations, stock-based compensation expense, impact from
redeemable non-controlling interests, contingent consideration, restructuring and asset
impairment charges. We define adjusted EBITDA margin as adjusted EBITDA stated as a
percentage of revenue.
Our management uses adjusted EBITDA and adjusted EBITDA margin as measures of
operating performance, because they do not include the impact of items that we do not
consider indicative of our core operating performance; for planning purposes, including the
preparation of our annual operating budget; to allocate resources to enhance the financial
performance of the business; to evaluate the effectiveness of our business strategies; and in
communications with the board of directors and investors concerning our financial
performance.
Non-GAAP Net Income and EPS
We define Non-GAAP net income and earnings per share (EPS) to exclude certain discrete
items that management does not consider representative of our ongoing operations,
including energy asset and goodwill impairment, contingent consideration, restructuring and
other charges, impact from redeemable non-controlling interest, gain or loss on sale of
equity investment, and gain or loss upon deconsolidation of a variable interest entity. We
consider Non-GAAP net income and Non-GAAP EPS to be important indicators of our
operational strength and performance of our business because they eliminate the effects of
events that are not part of the Company's core operations.
Non-GAAP Adjusted Cash from Operations
We define Non-GAAP adjusted cash from operations as cash flows from operating activities
plus proceeds from ITC sales and proceeds from Federal ESPC projects. Cash received in
payment of ITC sales are, as of our fiscal year 2025, treated as investing activities under
GAAP. Federal ESPC projects are treated as financing cash flows under GAAP. These cash
flows, however, correspond to benefits generated by the underlying assets and projects.
Thus, we believe that adjusting operating cash flow to include the cash generated from ITC
sales and by our Federal ESPC projects provides investors with a useful measure for
evaluating the cash generating ability of our core operating business. Our management uses
Non-GAAP adjusted cash from operations as a measure of liquidity because it captures all
sources of cash associated with our operations.
View source version on businesswire.com:
https://www.businesswire.com/news/home/20260803954891/en/
Media Relations
Leila Dillon, 508.661.2264, [email protected]
Investor Relations
Eric Prouty, AdvisIRy Partners, 212.750.5800,
[email protected]
Lynn Morgen, AdvisIRy Partners, 212.750.5800,
[email protected]
Source: Ameresco, Inc.






























 Designing Power: What Is a Powered Site and Why Does It Matter for Data Center...





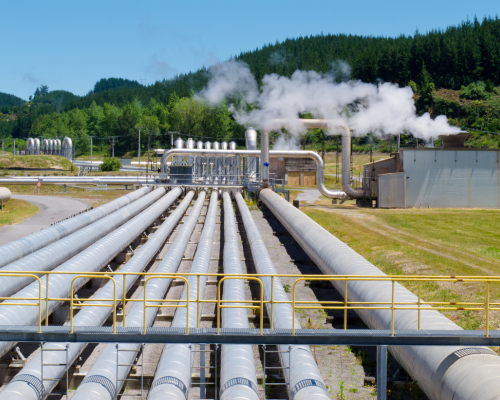
 Geothermal as Infrastructure: A Modernization Strategy for Campuses and Multi-Building...