Annual Written Affirmation
Bull 0
Bear 0
Routine
AMCR
Fiscal year ends June
Quarters are offset from the calendar — Q1 is Jul–Sep
|
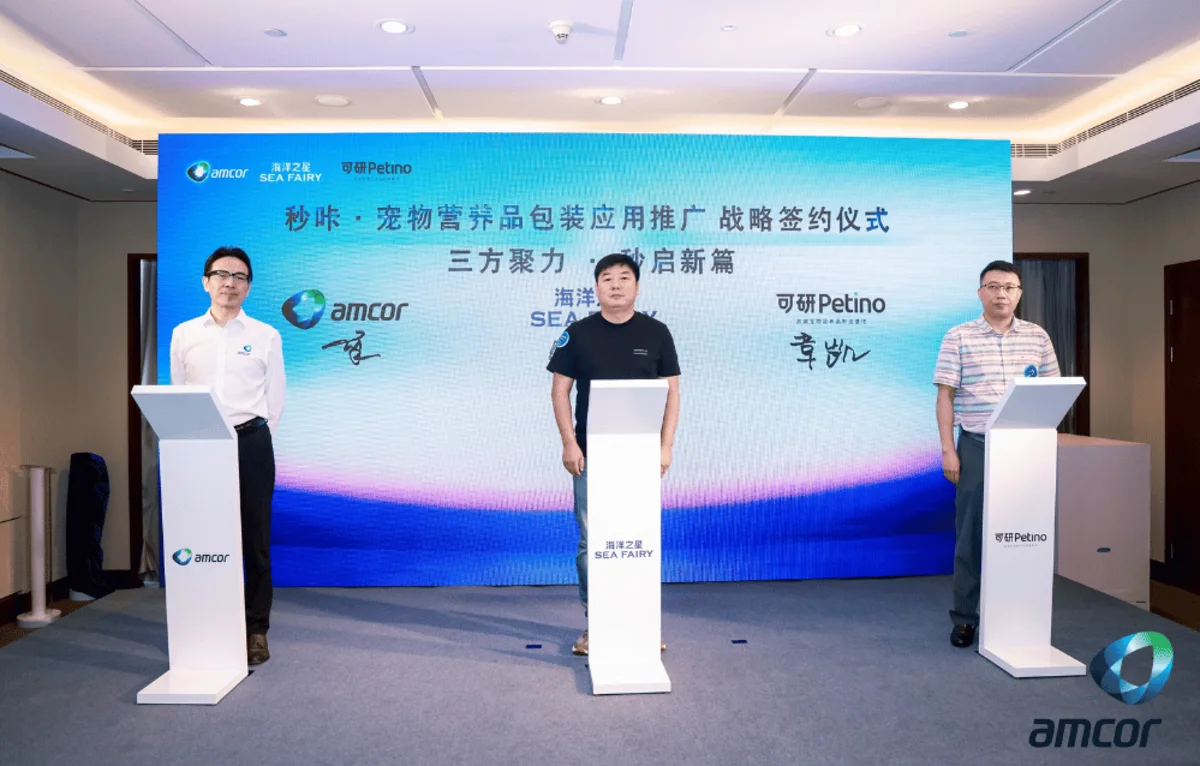
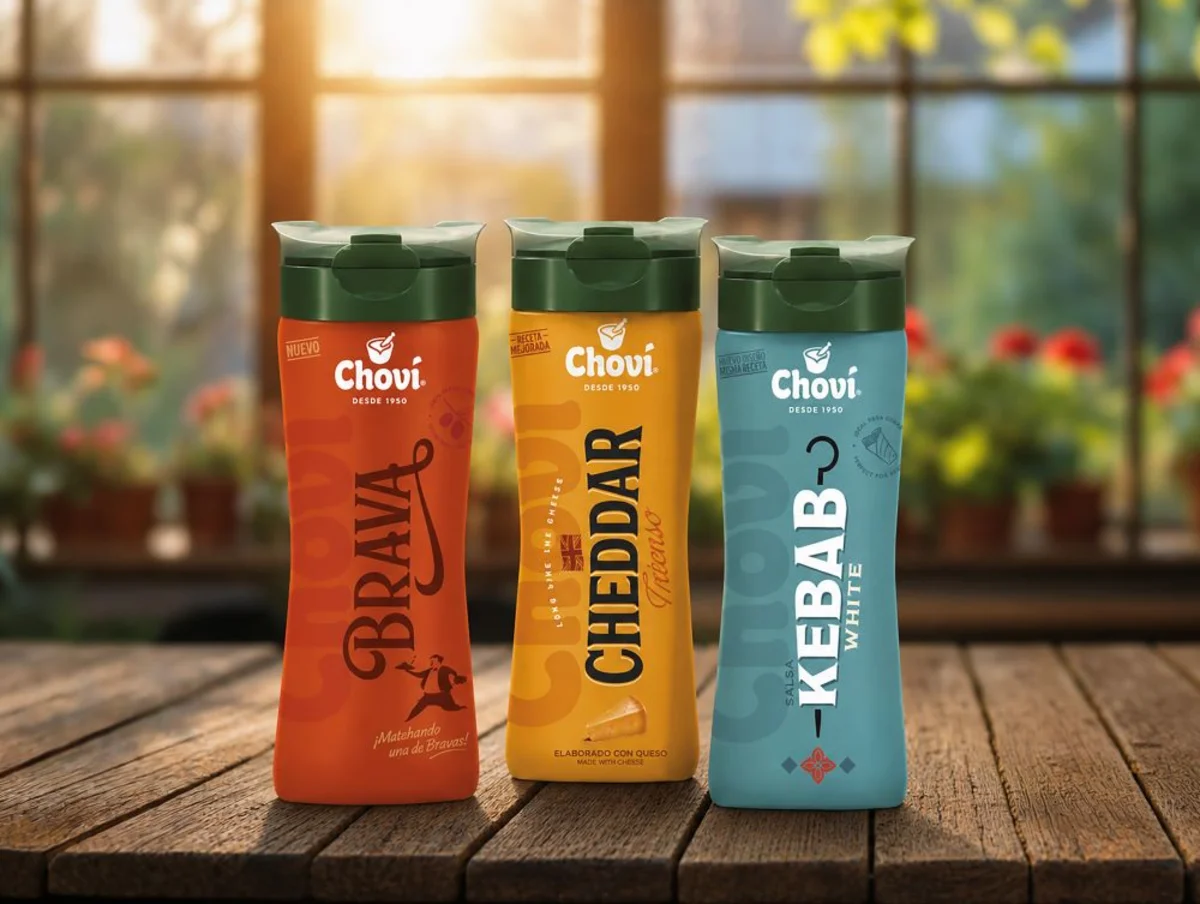
Amcor plc is a global packaging company that develops and produces flexible, rigid, and closure packaging solutions for consumer and healthcare products. The company serves customers in the food, beverage, pharmaceutical, and personal care sectors, offering materials, design, and manufacturing services. Amcor operates in multiple regions, providing local access to global brands. The company was formed through the combination of Amcor and Berry Global in 2025, following Amcor's acquisition of Bemis Company in 2019. Its history dates back to the 1860s with the founding of Australian Paper Manufacturers and J.M. Bemis & Company. Amcor partners with suppliers such as Dow to develop low-carbon packaging solutions and collaborates with brands like Choví and Sea Fairy for specialized packaging needs. Summarised from the company's own disclosures, fiscal year ended Oct 2026 |
Industry Packaging & Containers | Homepage amcor.com |
| Sector Consumer Cyclical | IR page amcor.com/investors | |
|
Tags
flexible packaging, rigid packaging, closures, food packaging, beverage packaging, pharmaceutical packaging, personal care packaging, sustainable packaging, packaging machinery, material science, Berry Global, Bemis Company, Australian Paper Manufacturers, J.M. Bemis & Company, Amcor Lift-Off, Optivate, Choví, Sea Fairy, Petino, Paolo Araldo
|
Press page amcor.com/media/news |
Metrics
| Valuation | |
|---|---|
| Market cap | $ 19.352B |
| Market cap (USD) | $ 19.352B |
| P/E | 15.02 |
| PEG | 7.36 |
| P/BV | 1.65 |
| P/S | 0.81 |
| P/OCF | 11.01 |
| P/FCF | 25.07 |
| Dividend yield | 7.4% |
| Turnover / mcap | — |
| Returns | |
|---|---|
| ROE | 9.4% |
| ROI | 10.3% |
| ROIC | 15.2% |
| Profit margin | 4.7% |
| Growth | |
|---|---|
| Revenue growing | Yes |
| Profits growing | Yes |
| Revenue up 3y | No |
| Revenue up 5y | No |
| Earnings growth 3y (net profit CAGR) | 2.0% |
| Quality | |
|---|---|
| Profitable | Yes |
| Margin expanding | No |
| Buying back stock | — |
| Diluting (TTM) | No |
| Debt/Equity | — |
| Podcast bulls (TTM) | Sign up |
| Podcast bears (TTM) | Sign up |
| Podcast sentiment (TTM) | Sign up |
| Podcast sentiment % (TTM) | Sign up |
| News sentiment (TTM) | 38 |
| Quality score | 22.2% |
| Insiders | |
|---|---|
| Buys, 1w | Sign up |
| Buys, 1m | Sign up |
| Buys, 1y | Sign up |
| Sells, 1w | Sign up |
| Sells, 1m | Sign up |
| Sells, 1y | Sign up |
Sign up to see this company's insider trades
Filed figures
Lines the statements and their notes report beside the headline figures, read from the filings' XBRL as filed (no restatement applied), with figures computed from one filing's own lines. Cash-flow lines carry their cash direction: an outflow is negative. Each period links to its filing; a figure's period, report date and tag are in its tooltip.
| Figure | Jun 2017 | Jun 2018 | Jun 2019 | Jun 2020 | Jun 2021 | Jun 2022 | Jun 2023 | Jun 2024 | Jun 2025 | Jun 2026 |
|---|---|---|---|---|---|---|---|---|---|---|
| Balance sheet detail | ||||||||||
| Trade receivables (USD) | — | 1.38B | 1.86B | 1.62B | 1.86B | 1.94B | 1.88B | 1.85B | 3.43B | 3.64B |
| ↳ YoY growth | +35.2% | -13.3% | +15.4% | +3.8% | -3.1% | -1.5% | +85.6% | +6.2% | ||
| ↳ 5y CAGR | +6.3% | -0.2% | +16.2% | +14.3% | ||||||
| Borrowings, current (USD) | — | 2.16B | 794M | 195M | 98M | 136M | 80M | 84M | 116M | 135M |
| Borrowings, non-current (USD) | — | 2.69B | 5.31B | 6.03B | 6.19B | 6.34B | 6.65B | 6.6B | 13.8B | 13.9B |
| Lease liabilities (USD) | — | — | 0.00 | 583M | 590M | 656M | 614M | 645M | 1.21B | 1.11B |
| Cash and deposits (USD) | 562M | 621M | 602M | 743M | 850M | 775M | 689M | 588M | 827M | 1.12B |
| Intangible assets (USD) | — | 325M | 2.31B | 1.99B | 1.84B | 1.66B | 1.52B | 1.39B | 7.4B | 6.59B |
| Right-of-use assets (USD) | — | — | 0.00 | 525M | 532M | 560M | 533M | 567M | 1.12B | 1.04B |
| Net debt (borrowings + leases - cash) (USD) | — | 4.23B | 5.5B | 6.06B | 6.02B | 6.36B | 6.66B | 6.74B | 14.3B | 14B |
| Cash flow detail | ||||||||||
| Operating cash flow (USD) | 909M | 871M | 776M | 1.38B | 1.46B | 1.53B | 1.26B | 1.32B | 1.39B | 2.15B |
| Purchases of property, plant and equipment (USD) | -379M | -365M | -332M | -400M | -468M | -527M | -526M | -492M | -580M | -922M |
| Change in receivables (cash effect) (USD) | -13.2M | 700,000 | -83.7M | 133M | -189M | -272M | 93M | -43M | -228M | -323M |
| Change in inventories (cash effect) (USD) | -48.1M | -95M | 3.2M | 25.6M | -112M | -626M | 248M | 95M | 0.00 | -329M |
| Change in payables (cash effect) (USD) | 138M | 137M | 121M | -48.1M | 342M | 711M | -429M | -43M | 220M | 570M |
| Dividends paid (cash effect) (USD) | -489M | -527M | -680M | -761M | -742M | -732M | -723M | -722M | -845M | -1.2B |
| Share buybacks (cash effect) (USD) | — | 0.00 | 0.00 | -537M | -351M | -601M | -432M | -30M | 0.00 | -1M |
| Interest paid (cash effect) (USD) | -188M | -209M | -220M | -212M | -146M | -155M | -276M | -336M | -329M | -611M |
| Income taxes paid (cash effect) (USD) | -160M | -150M | -148M | -304M | -321M | -256M | -225M | -253M | -261M | -451M |
| Share-based compensation (USD) | 26.5M | 21M | 18.6M | 34M | 58M | 63M | 54M | 32M | 74M | 83M |
| Operating cash flow before change in receivables (USD) | 922M | 871M | 860M | 1.25B | 1.65B | 1.8B | 1.17B | 1.36B | 1.62B | 2.47B |
| Free cash flow (OCF - PPE - intangibles) (USD) | 530M | 506M | 444M | 985M | 993M | 999M | 735M | 829M | 810M | 1.23B |
| Income detail | ||||||||||
| Research and development expense (USD) | 69.1M | 72.7M | 64M | 97.3M | 100M | 96M | 101M | 106M | 120M | 170M |
| ↳ 5y CAGR | +6.8% | +6.8% | +10.6% | +4.3% | +11.2% | |||||
| Total comprehensive income (USD) | 562M | 645M | 416M | 290M | 1.23B | 701M | 1.08B | 582M | 475M | 1.24B |
| Comprehensive income to owners (USD) | 579M | 655M | 424M | 285M | 1.22B | 691M | 1.07B | 572M | 468M | 1.24B |
| Provision for credit losses (USD) | — | — | — | 5M | -4M | — | — | — | — | — |
| Credit cost ratio (credit losses / average receivables) (%) | — | — | — | 0.3% | 0.2% | — | — | — | — | — |
| Reported | Sep 3, 2019 | Aug 27, 2020 | Aug 27, 2020 | Aug 24, 2021 | Aug 24, 2021 | Aug 18, 2022 | Aug 17, 2023 | Aug 16, 2024 | Aug 15, 2025 | Aug 14, 2026 |
Sign up to see institutional holdings
Sign UpPodcast Mentions
Sign up to see podcast mentions and sentiment
Sign UpMaterial events reported to the SEC on Form 8-K or 6-K, newest first. The link opens the filing itself on EDGAR. Announcements lodged with ASX, newest first, routine forms (director and substantial-holding notices, daily buy-back and quotation notices) included. The link opens the announcement on ASX. Press releases from the company's own website, newest first.










Prompts
Click prompts to add them under the company line, click again to take one out, then copy the result into your AI chat. Shared by Asian Century Stocks and Uncovered Thai Stocks. Thank you.
Amcor plc (ticker AMCR), listed in United States.
Copied
Company History
Name and ticker changes, and re-registrations under a new regulatory id. When a ticker stopped being used is not recorded, so former tickers are undated.
| Date | Change | Detail |
|---|---|---|
| Apr 26, 2019 | Acquired | Acquired Bemis Co Inc (CIK 11199). Its filings from before the deal are on its own company page, not shown here. |
| Oct 29, 2018 | Renamed | ARCTIC JERSEY Ltd → AMCOR PLC |
| Dec 31, 2013 | Reporting currency | Its AU reports are in USD instead of AUD from this period. Earlier figures are shown in USD, converted at each period end's exchange rate. |
ETFs Holding Amcor plc
Exchange-traded funds whose newest published daily portfolio holds one of the company's listings, largest weight first.
| ETF | Weight in ETF | Shares | Market value | As of |
|---|---|---|---|---|
| BEEX | 3.07% | 130,990 | $ 5.733M | Nov 17, 2026 |
| DIVY | 2.64% | 18,164 | $ 795.038K | Nov 17, 2026 |
| FDV | 2.42% | 474,577 | $ 21.299M | Jul 31, 2026 |
| PAYR | 2.33% | 29,610 | $ 1.329M | Jul 31, 2026 |
| KDVD | 1.32% | 2,565 | $ 111.193K | Jun 30, 2026 |
| RFDA | 1.01% | 18,094 | $ 830.334K | Aug 31, 2026 |
| DTAN | 0.72% | 3,588 | $ 155.899K | Nov 17, 2026 |
| CGDG | 0.55% | 754,827 | $ 33.039M | Nov 16, 2026 |
| CGIC | 0.55% | 322,833 | $ 14.13M | Nov 16, 2026 |
| LVDS | 0.40% | 11,062 | $ 480.644K | Nov 17, 2026 |
| GVLU | 0.32% | 18,938 | $ 828.916K | Nov 17, 2026 |
| TOUS | 0.31% | 107,597 | $ 4.829M | Jul 31, 2026 |
| BDVL short | -0.25% | -100,233 | $ -4.387M | Nov 16, 2026 |
| RAA | 0.17% | 23,610 | $ 1.023M | Jun 30, 2026 |
| JSTC | 0.12% | 8,369 | $ 366.311K | Nov 17, 2026 |
| TACU | 0.10% | 416 | $ 18.208K | Nov 17, 2026 |
| MODL | 0.09% | 20,878 | $ 905.061K | Jun 30, 2026 |
| DXUV | 0.09% | 125,384 | $ 5.492M | Nov 12, 2026 |
| DFSU | 0.08% | 43,851 | $ 1.921M | Nov 12, 2026 |
| DFLV | 0.08% | 138,426 | $ 6.063M | Nov 12, 2026 |
| DFAC | 0.07% | 1,425,324 | $ 62.429M | Nov 12, 2026 |
| DFUV | 0.07% | 250,963 | $ 10.992M | Nov 12, 2026 |
| GSPY | 0.07% | 11,785 | $ 515.829K | Nov 17, 2026 |
| IALT | 0.06% | 101,569 | $ 4.446M | Nov 16, 2026 |
| DCOR | 0.05% | 561,416 | $ 24.59M | Nov 12, 2026 |
| XMAG | 0.05% | 2,240 | $ 98.112K | Nov 13, 2026 |
| DFAU | 0.04% | 107,920 | $ 4.727M | Nov 12, 2026 |
| NTSD | 0.03% | 281 | $ 12.181K | Jun 30, 2026 |
| DFUS | 0.03% | 149,877 | $ 6.565M | Nov 12, 2026 |
| ACVF | 0.03% | 1,019 | $ 45.733K | Jul 31, 2026 |
| DFVX | 0.03% | 3,897 | $ 170.689K | Nov 12, 2026 |
| HCMT | 0.03% | 3,214 | $ 144.244K | Jul 31, 2026 |
| VOXP | 0.02% | 27 | $ 1,211.76 | Jul 31, 2026 |
| GDE | 0.02% | 2,140 | $ 98.205K | Aug 31, 2026 |
| JFLI | 0.02% | 234 | $ 10.167K | Nov 17, 2026 |
| SFGV | 0.02% | 4,815 | $ 210K | Nov 18, 2026 |
| MSLC | 0.02% | 17,497 | $ 802.937K | Aug 31, 2026 |
| NTSX | 0.02% | 6,038 | $ 261.747K | Jun 30, 2026 |
| AVLC | 0.01% | 3,969 | $ 173.723K | Nov 16, 2026 |
| EBI | 0.01% | 1,234 | $ 56.628K | Aug 31, 2026 |
| CORO | 0.00% | 292 | $ 12.764K | Nov 16, 2026 |
| NTRL short | 0.00% | -1,316 | $ 0.00 | Nov 16, 2026 |