ACN
Fiscal year ends August Quarters are offset from the calendar — Q1 is Sep–Nov

Accenture plc is a global professional services company that provides strategy, consulting, digital, technology, and operations services. The firm assists clients in transforming their businesses through the application of artificial intelligence, data analytics, and digital technologies. Accenture operates across multiple industries, serving clients in sectors such as financial services, healthcare, technology, and consumer goods. The company offers a broad range of capabilities, including advisory, engineering, delivery, and digital solutions. A recent addition to its portfolio is Accenture Construct, a global business focused on orchestrating capital projects from strategy through execution and operation. Accenture works with organizations to enhance growth, innovation, and resilience by leveraging advanced technologies and specialized expertise. The firm maintains joint ventures and investments to expand its service offerings and market reach. Its services are designed to help clients navigate complex business environments and achieve operational excellence through integrated technology and consulting solutions.

Summarised from the company's own disclosures

Industry Information Technology Services Homepage accenture.com
Sector Technology IR page investor.accenture.com
Tags
management consulting, digital transformation, artificial intelligence, cloud computing, data analytics, cybersecurity, capital project delivery, business process outsourcing, technology consulting, operations services, Accenture Construct
Press page —

Metrics

Valuation  
Market cap $ 168.721B
Market cap (USD) $ 168.721B
P/E 19.91
PEG 2.94
P/BV 5.34
P/S 2.27
P/OCF 13.65
P/FCF 14.52
Dividend yield <0.01%
Turnover / mcap —
Returns  
ROE 26.7%
ROI 26.4%
ROIC 27.0%
Profit margin 11.3%
Growth  
Revenue growing Yes
Profits growing Yes
Revenue up 3y Yes
Revenue up 5y Yes
Earnings growth 3y (net profit CAGR) 6.8%
Quality  
Profitable Yes
Margin expanding Yes
Buying back stock No
Diluting (TTM) No
Debt/Equity —
Podcast bulls (TTM) Sign up
Podcast bears (TTM) Sign up
Podcast sentiment (TTM) Sign up
Podcast sentiment % (TTM) Sign up
News sentiment (TTM) 35
Quality score 57.9%
Insiders  
Buys, 1w Sign up
Buys, 1m Sign up
Buys, 1y Sign up
Sells, 1w Sign up
Sells, 1m Sign up
Sells, 1y Sign up

Sign up to see this company's insider trades

Figure FY 2026 FY 2025 FY 2024 FY 2023 FY 2022 FY 2021 FY 2020 FY 2019 FY 2018 FY 2017 FY 2016 FY 2015 FY 2014 FY 2013 FY 2012 FY 2011 FY 2010 FY 2009 FY 2008
Revenue 74.183B 69.673B 64.896B 64.112B 61.594B 50.533B 44.327B 43.215B 41.603B 36.765B 34.798B 32.914B 31.875B 30.394B 29.778B 27.353B 23.094B 23.171B 25.314B
Net profit 8.367B 7.678B 7.265B 6.872B 6.877B 5.907B 5.108B 4.779B 4.06B 3.445B 4.112B 3.054B 2.941B 3.282B 2.554B 2.278B 1.781B 1.59B 1.692B
Free cash flow 11.621B 10.874B 8.615B 8.996B 8.823B 8.395B 7.616B 6.028B 5.408B 4.457B 4.079B 3.697B 3.164B 2.934B 3.885B 3.038B 2.853B — —

Figure FY 2026 FY 2025 FY 2024 FY 2023 FY 2022 FY 2021 FY 2020 FY 2019 FY 2018 FY 2017 FY 2016 FY 2015 FY 2014 FY 2013 FY 2012 FY 2011 FY 2010 FY 2009 FY 2008
Share price 175.98 283.98 330.02 311.89 300 317.2 224.2 188.19 161.01 129.26 113.12 102.82 78.66 74.73 59.81 54.79 40 35 41.72
Price performance 12m -0.38 -0.14 0.06 0.04 -0.05 0.41 0.19 0.17 0.25 0.14 0.1 0.31 0.05 0.25 0.09 0.37 0.14 -0.16 -0.04

Filed figures

Figure Aug 2017 Aug 2018 Aug 2019 Aug 2020 Aug 2021 Aug 2022 Aug 2023 Aug 2024 Aug 2025 Aug 2026
Balance sheet detail
Trade receivables (USD) 4.57B 5B 7.47B 7.19B 8.8B 10.5B 10.7B 11.9B 13.1B 14.2B
↳ YoY growth +12.2% +9.4% +49.5% -3.7% +22.3% +19.2% +2.0% +11.1% +10.0% +8.8%
↳ 5y CAGR +8.2% +8.4% +14.1% +13.4% +16.7% +18.1% +16.4% +9.7% +12.7% +10.1%
Borrowings, current (USD) 2.91M 5.34M 6.41M 7.82M 12.1M 9.18M 105M 946M 100M 99.7M
Borrowings, non-current (USD) 22.2M 19.7M 16.2M 54.1M 53.5M 45.9M 43.1M 78.6M 5.03B 10B
Lease liabilities (USD) — — 0.00 3.42B 3.44B 3.27B 3B 3.1B 3.03B 3.29B
Cash and deposits (USD) 4.13B 5.06B 6.13B 8.42B 8.17B 7.89B 9.05B 5B 11.5B 12.8B
Intangible assets (USD) 710M 687M 841M 1.03B 1.71B 1.93B 2.07B 2.9B 2.41B 2.91B
Right-of-use assets (USD) — — 0.00 3.18B 3.18B 3.02B 2.64B 2.76B 2.74B 3.01B
Net debt (borrowings + leases - cash) (USD) -4.1B -5.04B -6.1B -4.93B -4.66B -4.56B -5.9B -884M -3.31B 552M
Cash flow detail
Operating cash flow (USD) 4.97B 6.03B 6.63B 8.22B 8.98B 9.54B 9.52B 9.13B 11.5B 12.4B
Purchases of property, plant and equipment (USD) -516M -619M -599M -599M -580M -718M -528M -517M -600M -743M
Change in receivables (cash effect) (USD) -170M -476M -526M 722M -1.47B -2.41B 87.7M -602M -1.02B -1.28B
Change in payables (cash effect) (USD) 174M -168M 177M -360M 825M 374M -171M 46.5M -111M 270M
Dividends paid (cash effect) (USD) -1.57B -1.71B -1.86B -2.04B -2.24B -2.46B — — — —
Share buybacks (cash effect) (USD) -2.65B -2.64B -2.69B -2.92B -3.7B -4.12B -4.33B -4.52B -4.62B -7.52B
Interest paid (cash effect) (USD) -15.8M -19.7M -22.6M -28.5M -36.1M -46M -46.5M -37.2M -155M -266M
Income taxes paid (cash effect) (USD) -1.29B -1.37B -1.59B -1.36B -1.57B -1.78B -2.32B -2.39B -2.47B -2.64B
Share-based compensation (USD) 795M 977M 1.09B 1.2B 1.34B 1.68B 1.91B 1.94B 2.09B 2.1B
Operating cash flow before change in receivables (USD) 5.14B 6.5B 7.15B 7.49B 10.4B 12B 9.44B 9.73B 12.5B 13.6B
Free cash flow (OCF - PPE - intangibles) (USD) 4.46B 5.41B 6.03B 7.62B 8.4B 8.82B 9B 8.61B 10.9B 11.6B
Income detail
Research and development expense (USD) 704M 791M 800M 871M 1.12B 1.12B 1.3B 1.15B 817M 1.01B
↳ 5y CAGR +4.7% +2.0% +4.6% +6.8% +11.7% +9.8% +10.4% +7.5% -1.3% -2.0%
Total comprehensive income (USD) 4.23B 3.73B 4.58B 5.47B 6.13B 6.2B 7.46B 7.61B 7.93B 8.61B
Comprehensive income to owners (USD) 4.01B 3.58B 4.51B 5.39B 6.05B 6.11B 7.32B 7.45B 7.77B 8.46B
Reported Oct 26, 2017 Oct 24, 2018 Dec 19, 2019 Oct 22, 2020 Oct 15, 2021 Oct 12, 2022 Oct 12, 2023 Oct 10, 2024 Oct 10, 2025 Oct 16, 2026

Sign up to see institutional holdings

Sign Up

Podcast Mentions

Sign up to see podcast mentions and sentiment

Sign Up

NEW YORK and CHICAGO, Nov. 5, 2026 – Mondelēz International (Nasdaq: MDLZ) and Accenture (NYSE: ACN) are collaborating to transform Mondelēz's end-to-end Order-to-Cash process through agentic AI, and integration of new technologies. The transformation is designed to simplify operations, reimagine the customer experience, and enhance customer financial performance. The collaboration is expected to reshape how the organizations work together, with outcomes serving as the primary measure of success.

Order-to-Cash spans every stage from order placement through payment collection and plays a critical role in customer experience, revenue generation and cash flow. For Mondelēz, the process enables millions of transactions each year across customers, markets and distribution networks. For customers, a more streamlined Order-to-Cash process can mean quicker deliveries because it improves management, credit checks, fulfillment, invoicing, and collections.

By applying agentic AI across the end-to-end process, Mondelēz and Accenture are connecting customer service, supply chain and finance operations to streamline workflows, improve visibility and enable faster decision-making. The transformation is expected to accelerate payment collections, strengthen working capital performance and help teams resolve issues more quickly.

"Order-to-Cash is where customer demand becomes revenue, making it a critical driver of customer experience, cash flow and business performance day in and day out," said Filippo Catalano, chief information & digital officer, Mondelēz International. "Built on the digital foundation of our new global cloud ERP and powered by agentic AI on top of our process intelligence layer, we're transforming Order-to-Cash into a more connected, intelligent end-to-end flow that helps our teams work more efficiently, respond faster to customer needs and gain greater visibility into our operations. This transformation will help us improve service levels, strengthen our financial performance and create a more agile foundation for future growth."

"AI is creating new opportunities for Mondelēz to fundamentally reimagine how critical business processes operate, generate value and unlock greater returns from their operations," said Marco Ziegler, senior managing director and global client account lead for Mondelēz at Accenture. "Together with Mondelēz, we're transforming Order-to-Cash into a more connected, data-driven process that can accelerate cash collections, improve working capital, improve operational efficiency and deliver tangible business outcomes with measurable financial impact."

The initiative is expected to simplify day-to-day work by providing real-time insights across the Order-to-Cash process, improving accuracy, reducing costs and accelerating cash collections. Customer-facing teams will be better equipped to resolve issues faster, finance teams will have greater visibility into business performance, and leaders will have the insights needed to act more quickly. Beyond Order-to-Cash, the approach can be extended across other business functions to improve performance and support growth.

Sanjay Gurbuxani, global vice president, digital supply chain, Mondelēz International, added, “This collaboration marks a step change in how we operate—by embedding agentic AI into the heart of Order-to-Cash. We are not just improving a process, we are building the intelligent backbone for how Mondelēz serves customers and drives growth at scale.”

About Accenture
Accenture is a business reinvention and technology company. Our ambition is to be the reinvention partner of choice for our clients and lead in the safe, widespread adoption of AI, and to be the most client-focused, AI-enabled, great place to work in the world. Our approximately 814,000 people bring deep insights across industries and functions, with capabilities spanning strategy, process, operating model, change management, talent, data, technology and AI. We deliver this expertise through consulting, managed services, proprietary assets and platforms, and increasingly, software. We bring innovation and new solutions informed by our experience across industries, enabling us to apply relevant insights, capabilities and leading practices from adjacent sectors to address emerging business challenges and opportunities. We serve more than 9,000 clients and generated revenues of approximately $74 billion in fiscal year 2026. Visit us at accenture.com .

About Mondelēz International
Mondelēz International, Inc. (Nasdaq: MDLZ) empowers people to snack right in over 150 countries around the world. With 2025 net revenues of approximately $38.5 billion, MDLZ is leading the future of snacking with iconic global and local brands such as Oreo, Ritz, LU, CLIF Bar and Tate's Bake Shop biscuits and baked snacks, as well as Cadbury Dairy Milk, Milka and Toblerone chocolate. Mondelēz International is a proud member of the Dow Jones Best-in-Class North America and World Indices, formerly Dow Jones Sustainability Indices. Visit www.mondelezinternational.com or follow the company on X at x.com/MDLZ .

Forward-Looking Statements
Except for the historical information and discussions contained herein, statements in this news release may constitute forward-looking statements within the meaning of the Private Securities Litigation Reform Act of 1995. Words such as "may," "will," "should," "likely," "anticipates," "aspires," "expects," "intends," "plans," "projects," "believes," "estimates," "positioned," "outlook," "goal," "target" and similar expressions are used to identify these forward-looking statements. These statements are not guarantees of future performance nor promises that goals or targets will be met, and involve a number of risks, uncertainties and other factors that are difficult to predict and could cause actual results to differ materially from those expressed or implied. These risks include, without limitation, that the collaboration might not achieve its anticipated benefits and that risks and uncertainties related to the development and use of AI, including advanced AI, could harm our business, damage our reputation or give rise to legal or regulatory action, as well as the risks, uncertainties and other factors discussed under the "Risk Factors" heading in Accenture plc's most recent Annual Report on Form 10-K and other documents filed with or furnished to the Securities and Exchange Commission. Statements in this news release speak only as of the date they were made, and Accenture undertakes no duty to update any forward-looking statements made in this news release or to conform such statements to actual results or changes in Accenture's expectations.

# # #
Kbrw’s order management system, integrated by Accenture, will give Orange France’s customers more accurate stock availability and more reliable delivery dates across its sales channels

PARIS; Nov. 3, 2026 – Kbrw, a specialist in supply chain flow orchestration and execution, and Accenture (NYSE: ACN) were selected by Orange France to transform how it manages customers’ orders and inventory across its online channels, retail stores and B2B operations. Together, Kbrw and Accenture are helping Orange France to build a smoother and more responsive order fulfillment process for its customers.

The first phase of the new Order Management System (OMS) program enables Orange France’s customers to get more accurate information on product availability with more reliable delivery dates at the time of purchase of products such as smartphones, SIM cards and telecom equipment**.** This new system also supports services such as pre-ordering and inventory reservation.

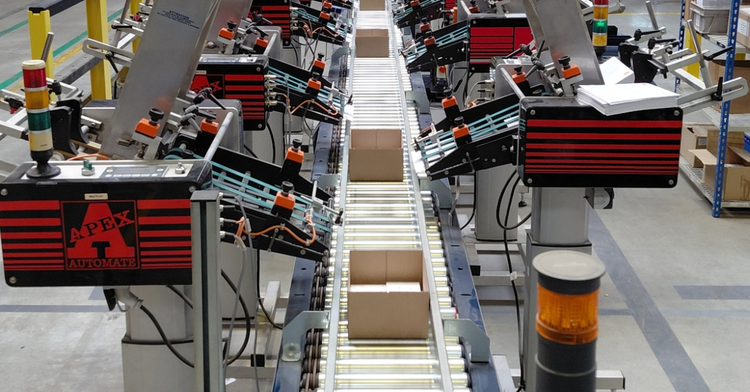
image

width

800px

caption

An automated preparation line supporting Orange France’s supply chain operations

The next phase will extend the system to replenishment orders for Orange’s retail stores. Business-to-business (B2B) and enterprise orders will follow in 2027.

Creating a connected fulfillment ecosystem
Orange France’s sales channels are supported by multiple warehouses and logistics service providers. Coordinating orders across this large network requires a single, consistent view of inventory.

To achieve this, Orange France is separating transactional functions from operational functions. Its Enterprise Resource Planning (ERP) system will remain the main record for transactional and financial processes, while Kbrw’s OMS will manage orders, inventory and fulfillment in real time.

“This new program gives us a single and consistent view of products that are in stock, in transit, or expected to arrive with projected inventory, helping us improve inventory planning and allocation across our sales channels. It also automates complex operational scenarios that previously required manual intervention, helping us to quickly respond to changing demand,” said Lionel Benezech, supply chain director at Orange France.

Once extended to B2B operations in 2027, the program will enable Orange France to deploy more flexible inventory reservation and allocation processes, improving coordination of stock across multiple warehouses and helping optimize product availability. Over time, the program will extend to after-sales services, providing greater visibility, traceability and control over equipment returns, repairs and refurbishment.

“The project carried out with Orange France perfectly embodies Kbrw’s DNA: helping companies orchestrate, automate, and adapt their operations in real time, as close as possible to operational reality. In a context where omnichannel complexity continues to grow, the ability to make and execute the right decisions in real time is becoming a key performance driver. By evolving its execution architecture, Orange France is giving itself the means to strengthen its customer promise, its operational efficiency, and its future agility,” said Philippe Romano, CEO and co-founder of Kbrw.

Accenture is supporting the program, integrating Kbrw’s OMS with Orange France’s existing technology environment and testing the solution to confirm the new capabilities work effectively across Orange France’s sales, inventory management and fulfillment processes.

“Orange France’s supply chain transformation shows what new execution architectures, connecting transactional systems with real-time order, inventory, and fulfillment orchestration, can deliver today: greater agility, more reliable service, and the ability to adapt in real time to customer needs. This is the kind of tangible and lasting value that Accenture is committed to co-creating with its clients and technology partners,” said Sandrine Jalliffier-Merlon, managing director and Orange France’s client account lead at Accenture.

About Kbrw
Founded in 2009, Kbrw is a French software publisher specializing in flow orchestration and real-time supply chain execution. Its solution enables companies to orchestrate and automate their decisions and operations in complex, high-volume environments. Kbrw's agentic execution engine helps organizations respond to disruptions and evolving needs through advanced business rule adaptation, decision support, and continuous improvement capabilities.

Kbrw has 185 employees. Present in more than 120 countries, the solution orchestrates more than $50 billion in transactions per year and serves major players in industry, retail, luxury, and telecommunications, including nearly 20% of CAC 40 groups such as Stellantis, Michelin, LVMH, Carrefour, and Orange. For more information: https://kbrw.com

About Accenture
Accenture is a business reinvention and technology company. Our ambition is to be the reinvention partner of choice for our clients and lead in the safe, widespread adoption of AI, and to be the most client-focused, AI-enabled, great place to work in the world. Our approximately 814,000 people bring deep insights across industries and functions, with capabilities spanning strategy, process, operating model, change management, talent, data, technology and AI. We deliver this expertise through consulting, managed services, proprietary assets and platforms, and increasingly, software. We bring innovation and new solutions informed by our experience across industries, enabling us to apply relevant insights, capabilities and leading practices from adjacent sectors to address emerging business challenges and opportunities. We serve more than 9,000 clients and generated revenues of approximately $74 billion in fiscal year 2026. Visit us at accenture.com .

# # #

Companies present concept of new “Physical AI Safety Suite” at NVIDIA GTC Berlin 2026*

BERLIN; Oct. 21, 2026 – TÜV SÜD, a globally recognized testing, inspection and certification organization headquartered in Germany, and Accenture (NYSE: ACN) are collaborating to accelerate the independent certification process for industrial automation with NVIDIA technologies.

At NVIDIA GTC Berlin 2026, the companies are presenting a joint concept of a “Physical AI Safety Suite” to help companies safely deploy physical AI equipment such as Autonomous Mobile Robots (AMR) alongside human workers faster. Using digital twins, AI agents and simulations, the Physical AI Safety Suite is designed to speed up the automation of factories and warehouses required to increase manufacturing productivity.

NVIDIA GT Berlin 2026: TÜV SÜD and Accenture use NVIDIA technologies to help deploy robots and other physical AI equipment safely alongside human workers faster.

Established industry standards provide the basis for ensuring that automated facilities are designed and operated safely. An example is ISO 3691-4, which specifies safety requirements for driverless industrial trucks and systems, including AMRs. In many industrial countries, certification against such norms is mandatory before companies can commission automated facilities and deploy new physical AI equipment. Even in markets where certification is voluntary, following industry-specific standards issued by recognized standards bodies is considered best practice.

But navigating the intricate web of standards can slow down the adoption of physical AI-enabled automation solutions. At a medium-sized production plant, the iterative coordination, validation and acceptance of safety concepts can take several weeks.

From manual to simulation testing

Presented at NVIDIA GTC Berlin, the Physical AI Safety Suite partially digitizes the manual assessment of facilities, equipment and preparation of certification packages, using digital twins and AI-powered simulations. TÜV SÜD estimates that the digital process could bring production online up to 30% sooner. Not only does it reduce physical dependencies such as installed equipment and site visits; companies can also address safety and certification issues earlier to avoid costly reworks in operation.

Using digital twins, AI agents and simulations, TÜV SÜD and Accenture’s Physical AI Safety Suite is designed to speed up the automation of factories and warehouses.

“Physical AI enables robotic systems to become increasingly adaptive while also paving the way for an independent, evidence-based digital certification process,” said Patrick Vollmer, CEO and Chairman of the Board at TÜV SÜD AG. “Through our Physical AI Safety Suite, which leverages simulation-generated evidence, we can support compliance-readiness much earlier in the engineering lifecycle without compromising the rigor safety standards require. Assessing automation concepts before the first robot is deployed reduces uncertainty in live operations and helps drive higher levels of safety, efficiency and performance across production and logistics.”

“Too often, companies test automation concepts against industry standards after the equipment, layouts and workflows have already been established,” said Sarat Maitin, Supply Chain and Engineering Lead for Accenture in Central and Eastern Europe. “The Physical AI Safety Suite brings these steps forward to when companies can still avoid safety incidents and costly rework. It also enables continuous monitoring of automated facilities. Both support faster deployment of physical AI-enabled automation needed to drive manufacturing productivity, particularly in Europe.”

Connected checks on three layers

The Physical AI Safety Suite concept assesses automation on three connected layers, with TÜV SÜD providing independent assessment and assurance, and retaining responsibility for certification:

Layer 1: Simulating industrial layouts – Where can companies deploy physical AI safely?

Using NVIDIA Omniverse libraries, the open Cosmos world model platform and the NVIDIA Isaac Sim open robotics framework, the Physical AI Safety Suite virtually assess routes, clearances, mixed-use zones and collaboration areas before robots are deployed or layouts are reconfigured. Then it generates a structured evidence package for TÜV SÜD review, covering operating-zone requirements, hazard and risk reduction standards, robot integration norms and control-system safety standards.

Layer 2: Adding robotic fleets – How does Physical AI operate safely?

Using NVIDIA Omniverse, Cosmos and Isaac Sim, the Physical AI Safety Suite simulates robotic fleets and their behaviors to identify operational constraints and potential hazards, such as workers becoming trapped by AMRs, before deployment. During operation, the layer uses the NVIDIA Halos safety platform and the NVIDIA IGX Thor edge AI platform to identify potentially hazardous situations beyond an individual robot’s view. AI agents built with the NVIDIA Halos Outside-In Safety Blueprint extend a robot’s perception to reason and act autonomously with facility-mounted cameras. This allows fleet management systems to respond earlier to improve safety and operational efficiency.

Layer 3: Individual robots – What is Physical AI allowed to do?

Even equipment complying with all applicable product regulations must be tested under its intended site-specific conditions, such as load, speed, floor conditions and lighting. Using Isaac Sim and Cosmos, the Physical AI Safety Suite creates and tests a long tail of certification-relevant scenarios that real-world testing could never practically cover. This, for example, allows engineering teams to find the best placement for safety sensors well before a physical prototype exists.

The Physical AI Safety Suite creates and tests a long tail of safety scenarios robots that real-world testing could never practically cover.

Physical AI describes a mix of technologies, including digital twins, simulations, sensors, robots and AI models, which enables robots and machines to sense, decide, act and improve constantly under changing conditions and operate more autonomously in real environments. Accenture recently established a Center of Excellence that incubates, builds, scales and deploys physical AI solutions for warehouses and production facilities.

Prompts

Accenture plc (ticker ACN), listed in United States.

Company History

Date Change Detail
— Predecessor Predecessor Accenture Sca (CIK 1143908) filed under its own registration; its figures are on its own company page, not shown here.
— Predecessor Predecessor Accenture Ltd (CIK 1134538) filed under its own registration; its figures are on its own company page, not shown here.

ETFs Holding Accenture plc

ETF Weight in ETF Shares Market value As of
CTIF 5.66% 46,450 $ 11.11M Nov 18, 2026
DIVY 5.51% 6,690 $ 1.657M Nov 17, 2026
TBG 4.26% 59,487 $ 14.23M Nov 18, 2026
GEND 3.80% 1,114 $ 184.835K Jul 31, 2026
ACEP 3.78% 15,559 $ 3.72M Nov 18, 2026
DDDD 3.57% 1,123 $ 278.167K Nov 17, 2026
DIVE 3.56% 7,177 $ 1.778M Nov 17, 2026
MBOX 2.92% 18,751 $ 4.49M Nov 18, 2026
SMRI 2.62% 76,174 $ 18.23M Nov 18, 2026
DVGR 2.49% 1,739 $ 420K Nov 18, 2026
RDVI 2.33% 359,487 $ 91.187M Nov 11, 2026
QVAL 2.31% 70,158 $ 16.79M Nov 18, 2026
CVRD 2.06% 5,300 $ 659.532K Jun 30, 2026
RUNN 1.74% 38,041 $ 7.219M Aug 31, 2026
ITAN 1.56% 8,064 $ 1.93M Nov 17, 2026
AQEC 1.49% 68,947 $ 8.58M Jun 30, 2026
JTEK 1.48% 243,552 $ 58.277M Nov 17, 2026
CLCV 1.48% 1,525 $ 253.028K Jul 31, 2026
JPEF 1.40% 113,484 $ 27.154M Nov 17, 2026
GOP 1.26% 4,444 $ 1.101M Nov 17, 2026
CVAR 1.24% 3,214 $ 533.267K Jul 31, 2026
HCOW 1.21% 1,587 $ 197.486K Jun 30, 2026
FDV 1.20% 63,612 $ 10.555M Jul 31, 2026
BAMD 1.16% 6,018 $ 1.142M Aug 31, 2026
CCOR 1.14% 1,911 $ 317.073K Jul 31, 2026
MKTN 1.12% 9,584 $ 1.193M Jun 30, 2026
WCEO 1.09% 657 $ 109.009K Jul 31, 2026
LQAI 1.01% 90 $ 22.496K Nov 12, 2026
SFGV 1.00% 48,545 $ 11.62M Nov 18, 2026
DSTL 0.99% 169,509 $ 21.094M Jun 30, 2026
LCLG 0.94% 6,102 $ 1.012M Jul 31, 2026
CGUS 0.85% 412,488 $ 102.173M Nov 16, 2026
HELO 0.82% 164,124 $ 39.272M Nov 17, 2026
GINX 0.78% 4,394 $ 833.805K Aug 31, 2026
JGRO 0.77% 290,758 $ 69.573M Nov 17, 2026
PAYR 0.74% 2,545 $ 422.266K Jul 31, 2026
VFVA 0.71% 36,004 $ 6.832M Aug 31, 2026
CGCV 0.70% 69,569 $ 17.232M Nov 16, 2026
RCGE 0.66% 2,704 $ 650K Nov 18, 2026
ACLC 0.62% 10,706 $ 2.032M Aug 31, 2026
VFMF 0.59% 30,560 $ 5.799M Aug 31, 2026
GSPY 0.57% 15,955 $ 3.952M Nov 17, 2026
JHDV 0.57% 556 $ 69.189K Jun 30, 2026
GVLU 0.56% 5,953 $ 1.475M Nov 17, 2026
JEPI 0.54% 1,034,114 $ 247.443M Nov 17, 2026
AFLG 0.51% 18,952 $ 4.694M Nov 16, 2026
JDIV 0.49% 255 $ 61.016K Nov 17, 2026
NANC 0.48% 5,210 $ 1.291M Nov 17, 2026
JUSA 0.44% 15,930 $ 3.812M Nov 17, 2026
FLSP 0.43% 32,400 $ 4.032M Jun 30, 2026
YOKE 0.41% 3,751 $ 900K Nov 18, 2026
IALT 0.40% 128,169 $ 31.747M Nov 16, 2026
JHAC 0.39% 112 $ 13.937K Jun 30, 2026
XMAG 0.35% 3,055 $ 763.597K Nov 13, 2026
DFLV 0.34% 104,573 $ 26.138M Nov 12, 2026
ACVF 0.34% 3,088 $ 512.361K Jul 31, 2026
OEI 0.32% 895 $ 148.498K Jul 31, 2026
CDX 0.31% 3,228.578 $ 772.534K Nov 17, 2026
VSLU 0.26% 11,388 $ 1.417M Jun 30, 2026
DYNF 0.25% 413,878 $ 102.518M Nov 16, 2026
LCTU 0.24% 10,812 $ 2.678M Nov 16, 2026
LDRX 0.23% 3,084 $ 585.22K Aug 31, 2026
DFUV 0.23% 141,556 $ 35.382M Nov 12, 2026
AVSU 0.22% 4,277 $ 1.059M Nov 16, 2026
STOX 0.21% 2,459 $ 466.62K Aug 31, 2026
DCOR 0.20% 364,407 $ 91.084M Nov 12, 2026
AVLC 0.20% 12,942 $ 3.206M Nov 16, 2026
JFLI 0.20% 401 $ 95.951K Nov 17, 2026
SFTY 0.19% 8,068 $ 1.531M Aug 31, 2026
AAUS 0.19% 4,131 $ 990K Nov 18, 2026
DFVX 0.19% 4,358 $ 1.089M Nov 12, 2026
ENHU 0.18% 68 $ 16.844K Nov 16, 2026
INRO 0.18% 4,287 $ 1.062M Nov 16, 2026
DFAU 0.18% 91,368 $ 22.837M Nov 12, 2026
TACU 0.17% 129 $ 31.953K Nov 17, 2026
APUE 0.17% 22,677 $ 4.303M Aug 31, 2026
APIE 0.17% 10,460 $ 1.985M Aug 31, 2026
AVUS 0.17% 99,638 $ 24.68M Nov 16, 2026
BDVL 0.16% 11,739 $ 2.908M Nov 16, 2026
GEW 0.14% 1,035 $ 196.402K Aug 31, 2026
IQSZ 0.13% 1,398 $ 231.956K Jul 31, 2026
HCMT 0.13% 4,272 $ 708.81K Jul 31, 2026
INCM 0.12% 16,182 $ 2.014M Jun 30, 2026
MSLC 0.11% 24,163 $ 4.585M Aug 31, 2026
MODL 0.10% 8,058 $ 1.003M Jun 30, 2026
DFUS 0.09% 81,152 $ 20.284M Nov 12, 2026
DFSU 0.09% 8,141 $ 2.035M Nov 12, 2026
CSHP 0.08% 1,254 $ 310.616K Nov 16, 2026
AVLV 0.07% 67,026 $ 16.602M Nov 16, 2026
DFAC 0.07% 237,193 $ 59.286M Nov 12, 2026
VOXP 0.06% 21 $ 3,484.32 Jul 31, 2026
THEQ 0.06% 84 $ 20.807K Nov 17, 2026
GDE 0.06% 1,403 $ 266.233K Aug 31, 2026
THRO 0.05% 22,213 $ 5.502M Nov 16, 2026
NTSX 0.03% 3,673 $ 457.068K Jun 30, 2026
DXUV 0.03% 6,963 $ 1.74M Nov 12, 2026
NTSD 0.02% 70 $ 8,710.80 Jun 30, 2026
NPFE 0.00% 184 $ 30.529K Jul 31, 2026
EBI 0.00% 57 $ 10.816K Aug 31, 2026
CORO 0.00% 386 $ 95.596K Nov 16, 2026