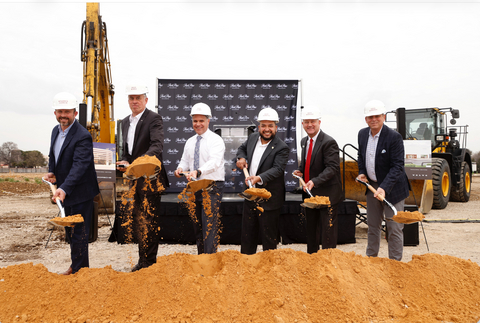
View Printable Version » All-time record annual Revenue of $18 billion Record fourth quarter Revenue of $4.7 billion, growth of 4% Record fourth quarter Gross Profit of $793 million, growth of 6% Same store Used Retail GPU of $1,749, growth of 18%…
View Printable Version »
- All-time record annual Revenue of $18 billion
- Record fourth quarter Revenue of $4.7 billion, growth of 4%
- Record fourth quarter Gross Profit of $793 million, growth of 6%
- Same store Used Retail GPU of $1,749, growth of 18%
- Same store Used Retail Gross Profit of $51 million, growth of 4%
- EPS of $3.10 per diluted share; adjusted EPS, a non-GAAP measure, of $6.67 per diluted share
- Net income of $60 million; adjusted net income, a non-GAAP measure, of $129 million
- Repurchased approximately 212,000 shares for $50 million
- Resumed Tekion transition with implementation across 15 additional stores
ATLANTA--(BUSINESS WIRE)--Feb. 5, 2026-- Asbury Automotive Group, Inc. (NYSE: ABG) (the “Company”), one of the largest automotive retail and service companies in the U.S., reported financial results for the fourth quarter of 2025.
“Our fourth quarter results wrapped up a productive year for Asbury,” said David Hult, Asbury’s President and Chief Executive Officer. “This year, we acquired $2.9 billion in annualized revenue, repurchased $100 million in shares and continued our transition to Tekion. We invested in our stores by deploying $186 million in capital expenditures and ended the year ahead of our leverage forecast, showing our discipline in running the business today with an eye towards our sustainable growth trajectory.”
The Company reported fourth quarter 2025 net income of $60 million ($3.10 per diluted share), a decrease of 53% from $129 million ($6.54 per diluted share) in fourth quarter 2024. The Company reported fourth quarter 2025 adjusted net income, a non-GAAP measure, of $129 million ($6.67 per diluted share), a decrease of 10% from $143 million ($7.26 per diluted share) in fourth quarter 2024. The Company also divested four stores during the fourth quarter 2025 as part of ongoing capital allocation and portfolio optimization efforts. These stores contributed an estimated annualized revenue of $150 million.
The financial measures discussed below include both GAAP and adjusted (non-GAAP) financial measures. Please see “Non-GAAP Financial Disclosure and Reconciliation, Same Store Data and Other Data” and the reconciliations for non-GAAP metrics used herein.
Adjusted net income for fourth quarter 2025 excludes, net of tax, non-cash asset impairments of $87 million ($4.50 per diluted share), net gain on divestitures of $26 million ($1.35 per diluted share), $5 million ($0.25 per diluted share) related to Tekion implementation expenses, $3 million ($0.15 per diluted share) related to non-cash fixed asset write-offs, and $1 million ($0.03 per diluted share) of professional fees related to the acquisition of the Herb Chambers Automotive Group.
Adjusted net income for fourth quarter 2024 excludes, net of tax, $11 million ($0.55 per diluted share) of non-cash asset impairments, $5 million ($0.25 per diluted share) of losses related to Hurricane Milton, and $1 million ($0.07 per diluted share) related to proceeds from the termination of a franchise.
Fourth Quarter 2025 Operational Summary
Total Company vs. 4th Quarter 2024:
- Revenue of $4.7 billion, increase of 4%
- Gross profit of $793 million, increase of 6%
- Gross margin increased 31 bps to 17.0%
- New vehicle revenue increase of 3%
- Used vehicle retail revenue increase of 1%; used vehicle retail gross profit increase of 16%
- Finance and insurance (F&I) per vehicle retailed (PVR) of $2,334
- Parts and service revenue increase of 12%; gross profit increase of 13%
- Selling, General and Administrative expenses (SG&A) as a percentage of gross profit of 66.7%
- Adjusted SG&A as a percentage of gross profit of 65.3%
- Operating margin of 2.7%
- Adjusted operating margin of 5.4%
Same Store vs. 4th Quarter 2024:
- Revenue of $4.0 billion, decrease of 6%
- Gross profit of $683 million, decrease of 5%
- Gross margin increased 26 bps to 17.0%
- New vehicle revenue decrease of 6%
- Used vehicle retail revenue decrease of 10%; used vehicle retail gross profit increase of 4%
- F&I PVR of $2,335
- Parts and service revenue increase of 2%; gross profit increase of 2%
- SG&A as a percentage of gross profit of 65.5%
- Adjusted SG&A as a percentage of gross profit of 64.1%
- Operating margin of 2.5%
- Adjusted operating margin of 5.6%
Full Year 2025 Results
For the full year 2025, the Company reported net income of $492 million ($25.13 per diluted share) compared to $430 million ($21.50 per diluted share) in the prior year, a 17% increase in EPS. Adjusted net income (a non-GAAP measure) for 2025 was $550 million ($28.10 per diluted share) compared to $545 million ($27.24 per diluted share) in the prior year, a 3% increase in adjusted EPS.
Total revenue for the full year 2025 was an all-time record of $18 billion. Transaction adjusted EBITDA for the full year 2025 was $1.1 billion. Adjusted operating cash flow for the full year was $651 million.
Liquidity and Leverage
As of December 31, 2025, the Company had cash and floorplan offset accounts of $180 million (which excludes $12 million of cash at Total Care Auto, Powered by Asbury) and availability under the used vehicle floorplan line and revolver of $747 million for a total of $927 million in liquidity. The Company’s transaction adjusted net leverage ratio was 3.2x at quarter end.
Share Repurchases
The Company repurchased approximately 212,000 shares for $50 million during the fourth quarter 2025. For the full year 2025, the Company repurchased approximately 433,000 shares for $100 million. As of December 31, 2025, the Company had approximately $176 million remaining on its share repurchase authorization.
The shares may be purchased from time to time in the open market, in privately negotiated transactions or in other manners as permitted by federal securities laws and other legal and contractual requirements. The extent to which the Company repurchases its shares, the number of shares and the timing of any repurchase will depend on such factors as Asbury’s stock price, general economic and market conditions, the potential impact on its capital structure, the expected return on competing uses of capital such as strategic dealership acquisitions and capital investments and other considerations. The program does not require the Company to repurchase any specific number of shares, and may be modified, suspended or terminated at any time without further notice.
Earnings Call
Additional commentary regarding the fourth quarter results will be provided during the earnings conference call on Thursday, February 5, 2026, at 9:00 a.m. ET.
The conference call will be simulcast live on the internet. The webcast, together with supplemental materials, and can be accessed by logging onto https://investors.asburyauto.com
. A replay and the accompanying materials will be available on this site for at least 30 days.
In addition, live audio will be accessible to the public. Participants may enter the conference call five to ten minutes prior to the scheduled start of the call by dialing:
|
|
| Domestic: |
(877) 407-2988 |
| International: |
+1 (201) 389-0923 |
| Passcode: |
13758044 |
About Asbury Automotive Group, Inc.
Asbury Automotive Group, Inc. (NYSE: ABG), a Fortune 500 company headquartered in Atlanta, GA, is one of the largest automotive retailers in the U.S. In late 2020, Asbury embarked on a multi-year plan to increase revenue and profitability strategically through organic operations, acquisitive growth and innovative technologies, with its guest-centric approach as Asbury’s constant North Star. As of December 31, 2025, Asbury operated 171 new vehicle dealerships, consisting of 223 franchises and representing 36 domestic and foreign brands of vehicles. Asbury also operates Total Care Auto, Powered by Asbury, a leading provider of service contracts and other vehicle protection products, and 39 collision repair centers. Asbury offers an extensive range of automotive products and services, including new and used vehicles; parts and service, which includes vehicle repair and maintenance services, replacement parts and collision repair services; and finance and insurance products, including arranging vehicle financing through third parties and aftermarket products, such as extended service contracts, guaranteed asset protection debt cancellation, and prepaid maintenance. Asbury is recognized as one of America’s Fastest Growing Companies 2024 by the Financial Times, one of the World’s Most Trustworthy Companies 2024 and 2025 by Newsweek, and one of America’s Most Successful Small-Cap Companies by Forbes for 2026.
For additional information, visit www.asburyauto.com
.
Forward-Looking Statements
This press release contains "forward-looking statements" within the meaning of the Private Securities Litigation Reform Act of 1995. Forward-looking statements are statements other than historical fact, and may include statements relating to goals, plans, objectives, beliefs, expectations and assumptions, projections regarding Asbury's financial position, liquidity, results of operations, cash flows, leverage, market position, the timing and amount of any stock repurchases, optimization of our dealership portfolio, revenue enhancement strategies, operational improvements, projections regarding the expected benefits of present and new technologies, the ability to implement those technologies, and the ability to transition to new technologies from existing systems; management’s plans, projections and objectives for future operations, scale and performance, integration plans and expected synergies from acquisitions, capital allocation strategy, and business strategy. These statements are based on management's current expectations and beliefs and involve significant risks and uncertainties that may cause results to differ materially from those set forth in the statements. These risks and uncertainties include, among other things, adverse outcomes with respect to current and future litigation and other proceedings; our inability to realize the benefits expected from recently completed transactions; our inability to promptly and effectively integrate completed transactions and the diversion of management’s attention from ongoing business and regular business responsibilities; our inability to complete future acquisitions or divestitures and the risks resulting therefrom; any supply chain disruptions impacting our industry and business; market factors and changes thereto, including changes related to trade; Asbury's relationships with, and the financial and operational stability of, vehicle manufacturers and other suppliers, including in response to the imposition of tariffs; acts of God and other natural disasters, including hurricanes; acts of war or similar incidents; the shortage of automotive parts and components, which may adversely impact supply from vehicle manufacturers and/or present retail sales challenges; risks associated with Asbury's indebtedness and our ability to comply with applicable covenants in our various financing agreements, or to obtain waivers of these covenants as necessary; risks associated with technology integration and implementation; risks related to competition in the automotive retail and service industries, general economic conditions both nationally and locally; governmental regulations and legislation, including changes in automotive state franchise laws and tariffs; our ability to execute our strategic and operational strategies and initiatives; our ability to leverage gains from Asbury’s dealership portfolio; our ability to capitalize on opportunities to repurchase Asbury’s debt and equity securities or purchase properties that Asbury currently leases; and our ability to stay within Asbury’s targeted range for capital expenditures. There can be no guarantees that Asbury's plans for future operations will be successfully implemented or that they will prove to be commercially successful.
These and other risk factors that could cause actual results to differ materially from those expressed or implied in our forward-looking statements are and will be discussed in Asbury's filings with the U.S. Securities and Exchange Commission from time to time, including its most recent annual report on Form 10-K and any subsequently filed quarterly reports on Form 10-Q. These forward-looking statements and such risks, uncertainties and other factors speak only as of the date of this press release. We undertake no obligation to publicly update any forward-looking statement, whether as a result of new information, future events or otherwise.
Non-GAAP Financial Disclosure and Reconciliation, Same Store Data and Other Data
In addition to evaluating the financial condition and results of our operations in accordance with GAAP, from time to time management evaluates and analyzes results and any impact on the Company of strategic decisions and actions relating to, among other things, cost reduction, growth, and profitability improvement initiatives, and other events outside of normal or "core" business and operations, by considering certain alternative financial measures not prepared in accordance with GAAP. These measures include "Adjusted income from operations," "Adjusted net income," "Adjusted operating margins," "Adjusted EBITDA," "Adjusted diluted earnings per share ("EPS")," "Adjusted SG&A," "Adjusted operating cash flow," "Transaction adjusted EBITDA" and "Transaction adjusted net leverage ratio." Further, management assesses the organic growth of our revenue and gross profit on a same store basis. We believe that our assessment on a same store basis represents an important indicator of comparative financial performance and provides relevant information to assess our performance at our existing locations.
Non-GAAP measures do not have definitions under GAAP and may be defined differently by and not be comparable to similarly titled measures used by other companies. As a result, any non-GAAP financial measures considered and evaluated by management are reviewed in conjunction with a review of the most directly comparable measures calculated in accordance with GAAP. Management cautions investors not to place undue reliance on such non-GAAP measures, but also to consider them with the most directly comparable GAAP measures. In their evaluation of results from time to time, management excludes items that do not arise directly from core operations or are otherwise of an unusual or non-recurring nature. Because these non-core, unusual or non-recurring charges and gains materially affect Asbury’s financial condition or results in the specific period in which they are recognized, management also evaluates and makes resource allocation and performance evaluation decisions based on the related non-GAAP measures excluding such items. In addition to using such non-GAAP measures to evaluate results in a specific period, management believes that such measures may provide more complete and consistent comparisons of operational performance on a period-over-period historical basis and a better indication of expected future trends. Management discloses these non-GAAP measures, and the related reconciliations, because it believes investors use these metrics in evaluating longer-term period-over-period performance, and to allow investors to better understand and evaluate the information used by management to assess operating performance.
Due to the significant effects that dealership acquisitions and divestitures have on our results of operations, and in order to provide more meaningful comparisons, we present herein "Transaction adjusted EBITDA" and "Transaction adjusted net leverage ratio" (collectively, the "Transaction Adjusted Metrics"), which reflect the effects of the dealership acquisitions and divestitures, if any, as if they had occurred on the first day of the last twelve-month periods being presented. For acquisitions, the pre-acquisition period amount being included in Transaction adjusted EBITDA is determined by pro-rating the forecasted adjusted EBITDA for the year following the acquisition(s). For divestitures, including divestitures due to requirements in connection with an acquisition, the adjusted EBITDA associated with the divestiture(s) is excluded from Transaction adjusted EBITDA. We believe the Transaction Adjusted Metrics provide relevant information to assess our performance at our existing dealership locations for the last twelve-month periods being presented.
The Transaction Adjusted Metrics do not include any adjustments for other events attributable to the dealership acquisitions or divestitures unless otherwise described. We cannot assure you that such financial information would not be materially different if such information were audited or that our actual results would not differ materially from the Transaction Adjusted Metrics if the dealership acquisitions or divestitures had been completed as of the beginning of the last twelve-month periods being presented.
Same store amounts consist of information from dealerships for identical months in each comparative period, commencing with the first month we owned the dealership. Additionally, amounts related to divested dealerships are excluded from each comparative period.
Amounts presented herein have been calculated using non-rounded amounts for all periods presented and therefore certain amounts may not compute or tie to prior presentation due to rounding.
|
|
|
|
|
|
|
|
|
|
|
|
|
|
|
|
|
|
|
|
|
|
| ASBURY AUTOMOTIVE GROUP, INC.CONSOLIDATED STATEMENTS OF INCOME (In millions, except per share data)(Unaudited) |
|
|
|
|
|
|
|
|
|
|
|
|
|
|
|
|
|
|
|
|
|
|
|
|
|
|
|
|
|
|
|
|
|
|
|
|
|
|
|
|
|
|
|
|
For the Three Months Ended December 31, |
|
|
|
|
|
|
|
% Change |
|
|
For the Twelve Months Ended December 31, |
|
|
|
|
|
|
|
% Change |
|
|
2025 |
|
|
|
2024 |
|
|
|
|
2025 |
|
|
|
2024 |
|
|
|
|
|
|
|
| REVENUE: |
|
|
|
|
|
|
|
|
|
|
|
|
|
|
|
|
|
|
|
|
|
| New vehicle |
$ |
2,525.3 |
|
|
$ |
2,457.1 |
|
|
3 |
% |
|
$ |
9,496.2 |
|
|
$ |
8,849.7 |
|
|
7 |
% |
| Used vehicle: |
|
|
|
|
|
|
|
|
|
|
|
|
|
|
|
|
|
|
|
|
|
| Retail |
|
1,114.6 |
|
|
|
1,098.9 |
|
|
1 |
% |
|
|
4,549.6 |
|
|
|
4,605.9 |
|
|
(1 |
)% |
| Wholesale |
|
177.0 |
|
|
|
159.6 |
|
|
11 |
% |
|
|
675.7 |
|
|
|
612.3 |
|
|
10 |
% |
| Total used vehicle |
|
1,291.6 |
|
|
|
1,258.5 |
|
|
3 |
% |
|
|
5,225.4 |
|
|
|
5,218.2 |
|
|
NM |
|
| Parts and service |
|
658.3 |
|
|
|
590.4 |
|
|
12 |
% |
|
|
2,506.8 |
|
|
|
2,354.7 |
|
|
6 |
% |
| Finance and insurance, net |
|
201.4 |
|
|
|
198.5 |
|
|
1 |
% |
|
|
770.6 |
|
|
|
766.0 |
|
|
1 |
% |
| TOTAL REVENUE |
|
4,676.5 |
|
|
|
4,504.5 |
|
|
4 |
% |
|
|
17,999.0 |
|
|
|
17,188.6 |
|
|
5 |
% |
| COST OF SALES: |
|
|
|
|
|
|
|
|
|
|
|
|
|
|
|
|
|
|
|
|
|
| New vehicle |
|
2,367.4 |
|
|
|
2,285.0 |
|
|
4 |
% |
|
|
8,874.2 |
|
|
|
8,209.3 |
|
|
8 |
% |
| Used vehicle: |
|
|
|
|
|
|
|
|
|
|
|
|
|
|
|
|
|
|
|
|
|
| Retail |
|
1,055.2 |
|
|
|
1,047.7 |
|
|
1 |
% |
|
|
4,310.3 |
|
|
|
4,377.3 |
|
|
(2 |
)% |
| Wholesale |
|
176.1 |
|
|
|
157.7 |
|
|
12 |
% |
|
|
656.0 |
|
|
|
595.4 |
|
|
10 |
% |
| Total used vehicle |
|
1,231.3 |
|
|
|
1,205.4 |
|
|
2 |
% |
|
|
4,966.3 |
|
|
|
4,972.7 |
|
|
NM |
|
| Parts and service |
|
272.5 |
|
|
|
250.4 |
|
|
9 |
% |
|
|
1,034.3 |
|
|
|
1,003.5 |
|
|
3 |
% |
| Finance and insurance |
|
12.4 |
|
|
|
13.9 |
|
|
(11 |
)% |
|
|
52.5 |
|
|
|
54.4 |
|
|
(3 |
)% |
| TOTAL COST OF SALES |
|
3,883.5 |
|
|
|
3,754.7 |
|
|
3 |
% |
|
|
14,927.3 |
|
|
|
14,240.0 |
|
|
5 |
% |
| GROSS PROFIT |
|
793.0 |
|
|
|
749.9 |
|
|
6 |
% |
|
|
3,071.7 |
|
|
|
2,948.6 |
|
|
4 |
% |
| OPERATING EXPENSES: |
|
|
|
|
|
|
|
|
|
|
|
|
|
|
|
|
|
|
|
|
|
| Selling, general and administrative |
|
528.7 |
|
|
|
476.9 |
|
|
11 |
% |
|
|
1,987.6 |
|
|
|
1,888.5 |
|
|
5 |
% |
| Depreciation and amortization |
|
23.0 |
|
|
|
19.2 |
|
|
20 |
% |
|
|
82.4 |
|
|
|
75.0 |
|
|
10 |
% |
| Asset impairments |
|
115.0 |
|
|
|
14.1 |
|
|
NM |
|
|
|
141.0 |
|
|
|
149.5 |
|
|
(6 |
)% |
| INCOME FROM OPERATIONS |
|
126.4 |
|
|
|
239.7 |
|
|
(47 |
)% |
|
|
860.6 |
|
|
|
835.6 |
|
|
3 |
% |
| OTHER EXPENSES: |
|
|
|
|
|
|
|
|
|
|
|
|
|
|
|
|
|
|
|
|
|
| Floor plan interest expense |
|
25.6 |
|
|
|
23.7 |
|
|
8 |
% |
|
|
91.2 |
|
|
|
89.9 |
|
|
1 |
% |
| Other interest expense, net |
|
52.4 |
|
|
|
44.2 |
|
|
18 |
% |
|
|
187.5 |
|
|
|
179.1 |
|
|
5 |
% |
| Gain on dealership divestitures, net |
|
(34.5 |
) |
|
|
— |
|
|
NM |
|
|
|
(80.2 |
) |
|
|
(8.6 |
) |
|
NM |
|
| Total other expenses, net |
|
43.6 |
|
|
|
68.0 |
|
|
(36 |
)% |
|
|
198.4 |
|
|
|
260.3 |
|
|
(24 |
)% |
| INCOME BEFORE INCOME TAXES |
|
82.8 |
|
|
|
171.7 |
|
|
(52 |
)% |
|
|
662.2 |
|
|
|
575.3 |
|
|
15 |
% |
| Income tax expense |
|
22.7 |
|
|
|
42.9 |
|
|
(47 |
)% |
|
|
170.2 |
|
|
|
145.0 |
|
|
17 |
% |
| NET INCOME |
$ |
60.0 |
|
|
$ |
128.8 |
|
|
(53 |
)% |
|
$ |
492.0 |
|
|
$ |
430.3 |
|
|
14 |
% |
| EARNINGS PER SHARE: |
|
|
|
|
|
|
|
|
|
|
|
|
|
|
|
|
|
|
|
|
|
| Basic— |
|
|
|
|
|
|
|
|
|
|
|
|
|
|
|
|
|
|
|
|
|
| Net income |
$ |
3.11 |
|
|
$ |
6.58 |
|
|
(53 |
)% |
|
$ |
25.20 |
|
|
$ |
21.58 |
|
|
17 |
% |
| Diluted— |
|
|
|
|
|
|
|
|
|
|
|
|
|
|
|
|
|
|
|
|
|
| Net income |
$ |
3.10 |
|
|
$ |
6.54 |
|
|
(53 |
)% |
|
$ |
25.13 |
|
|
$ |
21.50 |
|
|
17 |
% |
| WEIGHTED AVERAGE SHARES OUTSTANDING: |
|
|
|
|
|
|
|
|
|
|
|
|
|
|
|
|
|
|
|
|
|
| Basic |
|
19.3 |
|
|
|
19.6 |
|
|
|
|
|
|
19.5 |
|
|
|
19.9 |
|
|
|
|
| Restricted stock |
|
— |
|
|
|
0.1 |
|
|
|
|
|
|
— |
|
|
|
— |
|
|
|
|
| Performance share units |
|
0.1 |
|
|
|
— |
|
|
|
|
|
|
0.1 |
|
|
|
0.1 |
|
|
|
|
| Diluted |
|
19.4 |
|
|
|
19.7 |
|
|
|
|
|
|
19.6 |
|
|
|
20.0 |
|
|
|
|
| _____________________________ |
|
|
|
|
|
|
|
|
|
|
|
|
|
|
|
|
|
|
|
|
|
| NM—Not Meaningful |
|
|
|
|
|
|
|
|
|
|
|
|
|
|
|
|
|
|
|
|
|
|
|
|
|
|
|
|
|
|
|
|
|
|
|
|
| ASBURY AUTOMOTIVE GROUP, INC.Additional Disclosures-Consolidated (In millions)(Unaudited) |
|
|
|
|
|
|
|
|
|
|
|
|
|
|
|
|
|
|
|
|
|
|
|
|
|
|
|
|
|
|
December 31, 2025 |
|
|
|
December 31, 2024 |
|
|
|
Increase(Decrease) |
|
|
|
% Change |
|
| SELECTED BALANCE SHEET DATA |
|
|
|
|
|
|
|
|
|
|
|
|
|
|
| Cash and cash equivalents |
$ |
40.4 |
|
|
$ |
69.4 |
|
|
$ |
(29.0 |
) |
|
(42 |
)% |
| Inventory, net (a) |
|
2,135.8 |
|
|
|
1,978.8 |
|
|
|
157.0 |
|
|
8 |
% |
| Total current assets |
|
3,380.2 |
|
|
|
3,137.9 |
|
|
|
242.3 |
|
|
8 |
% |
| Floor plan notes payable |
|
2,027.0 |
|
|
|
1,694.7 |
|
|
|
332.3 |
|
|
20 |
% |
| Total current liabilities |
|
3,559.5 |
|
|
|
2,836.3 |
|
|
|
723.2 |
|
|
25 |
% |
| CAPITALIZATION: |
|
|
|
|
|
|
|
|
|
|
|
|
|
|
| Long-term debt (including current portion) |
$ |
3,572.0 |
|
|
$ |
3,138.6 |
|
|
$ |
433.4 |
|
|
14 |
% |
| Shareholders' equity |
|
3,891.9 |
|
|
|
3,502.1 |
|
|
|
389.8 |
|
|
11 |
% |
| Total |
$ |
7,463.9 |
|
|
$ |
6,640.7 |
|
|
$ |
823.2 |
|
|
12 |
% |
| _____________________________ |
|
|
|
|
|
|
|
|
|
|
|
|
|
|
| (a) Excluding $96.5 million and $58.7 million of inventory classified as assets held for sale as of December 31, 2025 and December 31, 2024, respectively. |
|
|
|
|
|
|
|
|
|
|
|
|
|
|
|
|
|
|
|
|
|
December 31, 2025 |
|
September 30, 2025 |
|
December 31, 2024 |
| Days Supply |
|
|
|
|
|
| New vehicle inventory |
52 |
|
58 |
|
49 |
| Used vehicle inventory |
38 |
|
35 |
|
37 |
| _____________________________ |
|
|
|
|
|
| Days supply of inventory is calculated based on new and used inventory, in units, at the end of each reporting period and a 30-day historical unit sales. |
|
|
|
|
|
|
|
|
|
|
|
| Brand Mix - New Vehicle Revenue by Brand |
|
|
|
|
|
|
|
|
|
|
|
|
For the Three Months Ended December 31, |
|
|
|
|
|
2025 |
|
|
2024 |
|
| Luxury |
|
|
|
|
|
| Lexus |
11 |
% |
|
10 |
% |
| Mercedes-Benz |
8 |
% |
|
8 |
% |
| BMW |
5 |
% |
|
3 |
% |
| Porsche |
3 |
% |
|
2 |
% |
| Land Rover |
2 |
% |
|
2 |
% |
| Other luxury |
7 |
% |
|
6 |
% |
| Total luxury |
36 |
% |
|
32 |
% |
| Imports |
|
|
|
|
|
| Toyota |
19 |
% |
|
18 |
% |
| Honda |
9 |
% |
|
8 |
% |
| Hyundai |
5 |
% |
|
6 |
% |
| Kia |
2 |
% |
|
2 |
% |
| Other imports |
4 |
% |
|
5 |
% |
| Total imports |
38 |
% |
|
40 |
% |
| Domestic |
|
|
|
|
|
| Ford |
12 |
% |
|
13 |
% |
| Chrysler, Dodge, Jeep, Ram |
7 |
% |
|
8 |
% |
| Chevrolet, Buick, GMC |
6 |
% |
|
8 |
% |
| Total domestic |
26 |
% |
|
28 |
% |
| Total New Vehicle Revenue |
100 |
% |
|
100 |
% |
|
|
|
|
|
|
|
For the Three Months Ended December 31, |
|
|
|
|
|
2025 |
|
|
2024 |
|
| Revenue mix |
|
|
|
|
|
| New vehicle |
54.0 |
% |
|
54.5 |
% |
| Used vehicle retail |
23.8 |
% |
|
24.4 |
% |
| Used vehicle wholesale |
3.8 |
% |
|
3.5 |
% |
| Parts and service |
14.1 |
% |
|
13.1 |
% |
| Finance and insurance, net |
4.3 |
% |
|
4.4 |
% |
| Total revenue |
100.0 |
% |
|
100.0 |
% |
| Gross profit mix |
|
|
|
|
|
| New vehicle |
19.9 |
% |
|
22.9 |
% |
| Used vehicle retail |
7.5 |
% |
|
6.8 |
% |
| Used vehicle wholesale |
0.1 |
% |
|
0.3 |
% |
| Parts and service |
48.7 |
% |
|
45.3 |
% |
| Finance and insurance, net |
23.8 |
% |
|
24.6 |
% |
| Total gross profit |
100.0 |
% |
|
100.0 |
% |
|
|
|
|
|
|
|
|
|
|
|
|
|
|
|
|
|
|
|
|
|
|
| ASBURY AUTOMOTIVE GROUP, INC.OPERATING HIGHLIGHTS-CONSOLIDATED (In millions)(Unaudited) |
|
|
|
|
|
|
|
|
|
|
|
|
|
|
|
|
|
|
|
|
|
|
|
|
|
|
|
|
|
|
|
|
|
|
|
|
|
|
|
|
|
|
|
|
For the Three Months Ended December 31, |
|
|
|
|
|
|
|
%Change |
|
|
For the Twelve Months Ended December 31, |
|
|
|
|
|
|
|
% Change |
|
|
2025 |
|
|
|
2024 |
|
|
|
|
2025 |
|
|
|
2024 |
|
|
|
|
|
|
|
| Revenue |
|
|
|
|
|
|
|
|
|
|
|
|
|
|
|
|
|
|
|
|
|
| New vehicle |
$ |
2,525.3 |
|
|
$ |
2,457.1 |
|
|
3 |
% |
|
$ |
9,496.2 |
|
|
$ |
8,849.7 |
|
|
7 |
% |
| Used vehicle: |
|
|
|
|
|
|
|
|
|
|
|
|
|
|
|
|
|
|
|
|
|
| Retail |
|
1,114.6 |
|
|
|
1,098.9 |
|
|
1 |
% |
|
|
4,549.6 |
|
|
|
4,605.9 |
|
|
(1 |
)% |
| Wholesale |
|
177.0 |
|
|
|
159.6 |
|
|
11 |
% |
|
|
675.7 |
|
|
|
612.3 |
|
|
10 |
% |
| Total used vehicle |
|
1,291.6 |
|
|
|
1,258.5 |
|
|
3 |
% |
|
|
5,225.4 |
|
|
|
5,218.2 |
|
|
NM |
|
| Parts and service |
|
658.3 |
|
|
|
590.4 |
|
|
12 |
% |
|
|
2,506.8 |
|
|
|
2,354.7 |
|
|
6 |
% |
| Finance and insurance, net |
|
201.4 |
|
|
|
198.5 |
|
|
1 |
% |
|
|
770.6 |
|
|
|
766.0 |
|
|
1 |
% |
| Total revenue |
$ |
4,676.5 |
|
|
$ |
4,504.5 |
|
|
4 |
% |
|
$ |
17,999.0 |
|
|
$ |
17,188.6 |
|
|
5 |
% |
| Gross profit |
|
|
|
|
|
|
|
|
|
|
|
|
|
|
|
|
|
|
|
|
|
| New vehicle |
$ |
157.9 |
|
|
$ |
172.1 |
|
|
(8 |
)% |
|
$ |
621.9 |
|
|
$ |
640.4 |
|
|
(3 |
)% |
| Used vehicle: |
|
|
|
|
|
|
|
|
|
|
|
|
|
|
|
|
|
|
|
|
|
| Retail |
|
59.4 |
|
|
|
51.2 |
|
|
16 |
% |
|
|
239.4 |
|
|
|
228.6 |
|
|
5 |
% |
| Wholesale |
|
0.9 |
|
|
|
1.9 |
|
|
(50 |
)% |
|
|
19.7 |
|
|
|
16.8 |
|
|
17 |
% |
| Total used vehicle |
|
60.3 |
|
|
|
53.1 |
|
|
14 |
% |
|
|
259.1 |
|
|
|
245.4 |
|
|
6 |
% |
| Parts and service |
|
385.9 |
|
|
|
340.1 |
|
|
13 |
% |
|
|
1,472.5 |
|
|
|
1,351.2 |
|
|
9 |
% |
| Finance and insurance, net |
|
189.0 |
|
|
|
184.6 |
|
|
2 |
% |
|
|
718.1 |
|
|
|
711.6 |
|
|
1 |
% |
| Total gross profit |
$ |
793.0 |
|
|
$ |
749.9 |
|
|
6 |
% |
|
$ |
3,071.7 |
|
|
$ |
2,948.6 |
|
|
4 |
% |
| Unit sales |
|
|
|
|
|
|
|
|
|
|
|
|
|
|
|
|
|
|
|
|
|
| New vehicle: |
|
|
|
|
|
|
|
|
|
|
|
|
|
|
|
|
|
|
|
|
|
| Luxury |
|
11,888 |
|
|
|
10,579 |
|
|
12 |
% |
|
|
40,818 |
|
|
|
36,827 |
|
|
11 |
% |
| Import |
|
24,065 |
|
|
|
24,593 |
|
|
(2 |
)% |
|
|
93,726 |
|
|
|
91,243 |
|
|
3 |
% |
| Domestic |
|
11,248 |
|
|
|
12,083 |
|
|
(7 |
)% |
|
|
46,660 |
|
|
|
45,148 |
|
|
3 |
% |
| Total new vehicle |
|
47,201 |
|
|
|
47,255 |
|
|
NM |
|
|
|
181,204 |
|
|
|
173,218 |
|
|
5 |
% |
| Used vehicle retail |
|
33,782 |
|
|
|
35,328 |
|
|
(4 |
)% |
|
|
143,126 |
|
|
|
150,698 |
|
|
(5 |
)% |
| Used to new ratio |
|
71.6 |
% |
|
|
74.8 |
% |
|
|
|
|
|
79.0 |
% |
|
|
87.0 |
% |
|
|
|
| Average selling price |
|
|
|
|
|
|
|
|
|
|
|
|
|
|
|
|
|
|
|
|
|
| New vehicle |
$ |
53,500 |
|
|
$ |
51,996 |
|
|
3 |
% |
|
$ |
52,406 |
|
|
$ |
51,090 |
|
|
3 |
% |
| Used vehicle retail |
$ |
32,993 |
|
|
$ |
31,106 |
|
|
6 |
% |
|
$ |
31,788 |
|
|
$ |
30,564 |
|
|
4 |
% |
| Average gross profit per unit |
|
|
|
|
|
|
|
|
|
|
|
|
|
|
|
|
|
|
|
|
|
| New vehicle: |
|
|
|
|
|
|
|
|
|
|
|
|
|
|
|
|
|
|
|
|
|
| Luxury |
$ |
6,772 |
|
|
$ |
7,118 |
|
|
(5 |
)% |
|
$ |
6,814 |
|
|
$ |
7,018 |
|
|
(3 |
)% |
| Import |
|
2,022 |
|
|
|
2,495 |
|
|
(19 |
)% |
|
|
2,302 |
|
|
|
2,601 |
|
|
(11 |
)% |
| Domestic |
|
2,551 |
|
|
|
2,931 |
|
|
(13 |
)% |
|
|
2,743 |
|
|
|
3,203 |
|
|
(14 |
)% |
| Total new vehicle |
|
3,344 |
|
|
|
3,641 |
|
|
(8 |
)% |
|
|
3,432 |
|
|
|
3,697 |
|
|
(7 |
)% |
| Used vehicle retail |
|
1,758 |
|
|
|
1,449 |
|
|
21 |
% |
|
|
1,672 |
|
|
|
1,517 |
|
|
10 |
% |
| Finance and insurance |
|
2,334 |
|
|
|
2,236 |
|
|
4 |
% |
|
|
2,214 |
|
|
|
2,197 |
|
|
1 |
% |
| Front end yield (1) |
|
5,016 |
|
|
|
4,939 |
|
|
2 |
% |
|
|
4,870 |
|
|
|
4,880 |
|
|
NM |
|
| Gross margin |
|
|
|
|
|
|
|
|
|
|
|
|
|
|
|
|
|
|
|
|
|
| Total new vehicle |
|
6.3 |
% |
|
|
7.0 |
% |
|
(75) bps |
|
|
|
6.5 |
% |
|
|
7.2 |
% |
|
(69) bps |
|
| Used vehicle retail |
|
5.3 |
% |
|
|
4.7 |
% |
|
67 bps |
|
|
|
5.3 |
% |
|
|
5.0 |
% |
|
30 bps |
|
| Parts and service |
|
58.6 |
% |
|
|
57.6 |
% |
|
102 bps |
|
|
|
58.7 |
% |
|
|
57.4 |
% |
|
136 bps |
|
| Total gross profit margin |
|
17.0 |
% |
|
|
16.6 |
% |
|
31 bps |
|
|
|
17.1 |
% |
|
|
17.2 |
% |
|
(9) bps |
|
| Operating expenses |
|
|
|
|
|
|
|
|
|
|
|
|
|
|
|
|
|
|
|
|
|
| Selling, general and administrative |
$ |
528.7 |
|
|
$ |
476.9 |
|
|
11 |
% |
|
$ |
1,987.6 |
|
|
$ |
1,888.5 |
|
|
5 |
% |
| Adjusted selling, general and administrative |
$ |
517.8 |
|
|
$ |
472.4 |
|
|
10 |
% |
|
$ |
1,974.9 |
|
|
$ |
1,877.0 |
|
|
5 |
% |
| SG&A as a % of gross profit |
|
66.7 |
% |
|
|
63.6 |
% |
|
307 bps |
|
|
|
64.7 |
% |
|
|
64.0 |
% |
|
66 bps |
|
| Adjusted SG&A as a % of gross profit |
|
65.3 |
% |
|
|
63.0 |
% |
|
230 bps |
|
|
|
64.3 |
% |
|
|
63.7 |
% |
|
64 bps |
|
| Income from operations as a % of revenue |
|
2.7 |
% |
|
|
5.3 |
% |
|
(262) bps |
|
|
|
4.8 |
% |
|
|
4.9 |
% |
|
(8) bps |
|
| Income from operations as a % of gross profit |
|
15.9 |
% |
|
|
32.0 |
% |
|
(1,603) bps |
|
|
|
28.0 |
% |
|
|
28.3 |
% |
|
(32) bps |
|
| Adjusted income from operations as a % of revenue |
|
5.4 |
% |
|
|
5.7 |
% |
|
(34) bps |
|
|
|
5.6 |
% |
|
|
5.8 |
% |
|
(16) bps |
|
| Adjusted income from operations as a % of gross profit |
|
31.8 |
% |
|
|
34.4 |
% |
|
(264) bps |
|
|
|
33.0 |
% |
|
|
33.8 |
% |
|
(78) bps |
|
| _____________________________ |
|
|
|
|
|
|
|
|
|
|
|
|
|
|
|
|
|
|
|
|
|
| (1) Front end yield is calculated as gross profit from new vehicles, used retail vehicles and finance and insurance (net), divided by combined new and used retail unit sales. |
|
|
|
|
|
|
|
|
|
|
|
|
|
|
|
|
|
|
|
|
|
|
|
|
|
|
|
|
|
|
|
|
|
|
|
|
|
|
|
|
|
|
|
| ASBURY AUTOMOTIVE GROUP, INC.SAME STORE OPERATING HIGHLIGHTS-CONSOLIDATED (In millions)(Unaudited) |
|
|
|
|
|
|
|
|
|
|
|
|
|
|
|
|
|
|
|
|
|
|
|
|
|
|
|
|
|
|
|
|
|
|
|
|
|
|
|
|
|
|
|
|
For the Three Months Ended December 31, |
|
|
|
|
|
|
|
% Change |
|
|
For the Twelve Months Ended December 31, |
|
|
|
|
|
|
|
% Change |
|
|
2025 |
|
|
|
2024 |
|
|
|
|
2025 |
|
|
|
2024 |
|
|
|
|
|
|
|
| Revenue |
|
|
|
|
|
|
|
|
|
|
|
|
|
|
|
|
|
|
|
|
|
| New vehicle |
$ |
2,186.2 |
|
|
$ |
2,333.8 |
|
|
(6 |
)% |
|
$ |
8,636.1 |
|
|
$ |
8,320.1 |
|
|
4 |
% |
| Used vehicle: |
|
|
|
|
|
|
|
|
|
|
|
|
|
|
|
|
|
|
|
|
|
| Retail |
|
941.9 |
|
|
|
1,049.2 |
|
|
(10 |
)% |
|
|
4,136.9 |
|
|
|
4,347.8 |
|
|
(5 |
)% |
| Wholesale |
|
144.5 |
|
|
|
156.2 |
|
|
(7 |
)% |
|
|
620.8 |
|
|
|
594.9 |
|
|
4 |
% |
| Total used vehicle |
|
1,086.4 |
|
|
|
1,205.4 |
|
|
(10 |
)% |
|
|
4,757.7 |
|
|
|
4,942.7 |
|
|
(4 |
)% |
| Parts and service |
|
569.0 |
|
|
|
558.4 |
|
|
2 |
% |
|
|
2,286.4 |
|
|
|
2,212.7 |
|
|
3 |
% |
| Finance and insurance, net |
|
178.6 |
|
|
|
191.7 |
|
|
(7 |
)% |
|
|
715.7 |
|
|
|
733.3 |
|
|
(2 |
)% |
| Total revenue |
$ |
4,020.2 |
|
|
$ |
4,289.3 |
|
|
(6 |
)% |
|
$ |
16,395.9 |
|
|
$ |
16,208.8 |
|
|
1 |
% |
| Gross profit |
|
|
|
|
|
|
|
|
|
|
|
|
|
|
|
|
|
|
|
|
|
| New vehicle |
$ |
130.9 |
|
|
$ |
163.7 |
|
|
(20 |
)% |
|
$ |
556.8 |
|
|
$ |
605.8 |
|
|
(8 |
)% |
| Used vehicle: |
|
|
|
|
|
|
|
|
|
|
|
|
|
|
|
|
|
|
|
|
|
| Retail |
|
51.5 |
|
|
|
49.6 |
|
|
4 |
% |
|
|
218.5 |
|
|
|
219.8 |
|
|
(1 |
)% |
| Wholesale |
|
3.1 |
|
|
|
2.0 |
|
|
53 |
% |
|
|
20.9 |
|
|
|
17.0 |
|
|
23 |
% |
| Total used vehicle |
|
54.6 |
|
|
|
51.7 |
|
|
6 |
% |
|
|
239.4 |
|
|
|
236.8 |
|
|
1 |
% |
| Parts and service |
|
330.7 |
|
|
|
323.8 |
|
|
2 |
% |
|
|
1,343.4 |
|
|
|
1,276.2 |
|
|
5 |
% |
| Finance and insurance, net |
|
166.3 |
|
|
|
177.8 |
|
|
(6 |
)% |
|
|
663.2 |
|
|
|
678.9 |
|
|
(2 |
)% |
| Total gross profit |
$ |
682.5 |
|
|
$ |
717.0 |
|
|
(5 |
)% |
|
$ |
2,802.7 |
|
|
$ |
2,797.8 |
|
|
NM |
|
| Unit sales |
|
|
|
|
|
|
|
|
|
|
|
|
|
|
|
|
|
|
|
|
|
| New vehicle: |
|
|
|
|
|
|
|
|
|
|
|
|
|
|
|
|
|
|
|
|
|
| Luxury |
|
9,294 |
|
|
|
10,120 |
|
|
(8 |
)% |
|
|
34,845 |
|
|
|
34,990 |
|
|
NM |
|
| Import |
|
22,121 |
|
|
|
23,311 |
|
|
(5 |
)% |
|
|
88,404 |
|
|
|
85,178 |
|
|
4 |
% |
| Domestic |
|
10,345 |
|
|
|
11,324 |
|
|
(9 |
)% |
|
|
43,376 |
|
|
|
42,065 |
|
|
3 |
% |
| Total new vehicle |
|
41,760 |
|
|
|
44,755 |
|
|
(7 |
)% |
|
|
166,625 |
|
|
|
162,233 |
|
|
3 |
% |
| Used vehicle retail |
|
29,444 |
|
|
|
33,564 |
|
|
(12 |
)% |
|
|
131,615 |
|
|
|
141,131 |
|
|
(7 |
)% |
| Used to new ratio |
|
70.5 |
% |
|
|
75.0 |
% |
|
|
|
|
|
79.0 |
% |
|
|
87.0 |
% |
|
|
|
| Average selling price |
|
|
|
|
|
|
|
|
|
|
|
|
|
|
|
|
|
|
|
|
|
| New vehicle |
$ |
52,351 |
|
|
$ |
52,146 |
|
|
NM |
|
|
$ |
51,830 |
|
|
$ |
51,285 |
|
|
1 |
% |
| Used vehicle retail |
$ |
31,990 |
|
|
$ |
31,261 |
|
|
2 |
% |
|
$ |
31,432 |
|
|
$ |
30,807 |
|
|
2 |
% |
| Average gross profit per unit |
|
|
|
|
|
|
|
|
|
|
|
|
|
|
|
|
|
|
|
|
|
| New vehicle: |
|
|
|
|
|
|
|
|
|
|
|
|
|
|
|
|
|
|
|
|
|
| Luxury |
$ |
6,739 |
|
|
$ |
7,138 |
|
|
(6 |
)% |
|
$ |
6,874 |
|
|
$ |
7,042 |
|
|
(2 |
)% |
| Import |
|
1,950 |
|
|
|
2,487 |
|
|
(22 |
)% |
|
|
2,268 |
|
|
|
2,622 |
|
|
(14 |
)% |
| Domestic |
|
2,433 |
|
|
|
2,960 |
|
|
(18 |
)% |
|
|
2,692 |
|
|
|
3,235 |
|
|
(17 |
)% |
| Total new vehicle |
|
3,135 |
|
|
|
3,658 |
|
|
(14 |
)% |
|
|
3,342 |
|
|
|
3,734 |
|
|
(11 |
)% |
| Used vehicle retail |
|
1,749 |
|
|
|
1,478 |
|
|
18 |
% |
|
|
1,660 |
|
|
|
1,558 |
|
|
7 |
% |
| Finance and insurance |
|
2,335 |
|
|
|
2,270 |
|
|
3 |
% |
|
|
2,224 |
|
|
|
2,238 |
|
|
(1 |
)% |
| Front end yield (1) |
|
4,897 |
|
|
|
4,995 |
|
|
(2 |
)% |
|
|
4,823 |
|
|
|
4,960 |
|
|
(3 |
)% |
| Gross margin |
|
|
|
|
|
|
|
|
|
|
|
|
|
|
|
|
|
|
|
|
|
| Total new vehicle |
|
6.0 |
% |
|
|
7.0 |
% |
|
(103) bps |
|
|
|
6.4 |
% |
|
|
7.3 |
% |
|
(83) bps |
|
| Used vehicle retail |
|
5.5 |
% |
|
|
4.7 |
% |
|
74 bps |
|
|
|
5.3 |
% |
|
|
5.1 |
% |
|
22 bps |
|
| Parts and service |
|
58.1 |
% |
|
|
58.0 |
% |
|
13 bps |
|
|
|
58.8 |
% |
|
|
57.7 |
% |
|
108 bps |
|
| Total gross profit margin |
|
17.0 |
% |
|
|
16.7 |
% |
|
26 bps |
|
|
|
17.1 |
% |
|
|
17.3 |
% |
|
(17) bps |
|
| Operating expenses |
|
|
|
|
|
|
|
|
|
|
|
|
|
|
|
|
|
|
|
|
|
| Selling, general and administrative |
$ |
447.3 |
|
|
$ |
454.0 |
|
|
(1 |
)% |
|
$ |
1,785.4 |
|
|
$ |
1,777.8 |
|
|
NM |
|
| Adjusted selling, general and administrative |
$ |
437.1 |
|
|
$ |
447.6 |
|
|
(2 |
)% |
|
$ |
1,782.9 |
|
|
$ |
1,764.3 |
|
|
1 |
% |
| SG&A as a % of gross profit |
|
65.5 |
% |
|
|
63.3 |
% |
|
222 bps |
|
|
|
63.7 |
% |
|
|
63.5 |
% |
|
16 bps |
|
| Adjusted SG&A as a % of gross profit |
|
64.1 |
% |
|
|
62.4 |
% |
|
162 bps |
|
|
|
63.6 |
% |
|
|
63.1 |
% |
|
55 bps |
|
| _____________________________ |
|
|
|
|
|
|
|
|
|
|
|
|
|
|
|
|
|
|
|
|
|
| (1) Front end yield is calculated as gross profit from new vehicles, used retail vehicles and finance and insurance (net), divided by combined new and used retail unit sales. |
|
|
|
|
|
|
|
|
|
|
|
|
|
|
|
|
|
|
|
|
|
|
|
|
|
|
|
|
|
|
|
|
|
|
|
|
|
|
|
|
|
|
|
|
|
| ASBURY AUTOMOTIVE GROUP, INC.SEGMENT REPORTING (Unaudited) |
|
|
|
|
|
|
|
|
|
|
|
|
|
|
|
|
|
|
|
|
|
|
|
|
|
|
|
|
|
|
|
|
|
|
|
|
|
|
|
|
|
|
|
|
|
|
|
|
For the Three Months Ended December 31, 2025 |
|
|
|
|
|
|
|
|
|
|
|
For the Three Months Ended December 31, 2024 |
|
|
|
|
|
|
|
|
|
|
|
Dealerships |
|
|
|
TCA |
|
|
|
Total |
|
|
|
Dealerships |
|
|
|
TCA |
|
|
|
Total |
|
|
|
(In millions) |
|
|
|
|
|
|
|
|
|
|
|
|
|
|
|
|
|
|
|
|
|
|
| Revenue from external customers |
$ |
4,595.1 |
|
|
$ |
81.5 |
|
|
$ |
4,676.5 |
|
|
$ |
4,427.4 |
|
|
$ |
77.1 |
|
|
$ |
4,504.5 |
|
| Intersegment revenue |
|
69.0 |
|
|
|
— |
|
|
|
69.0 |
|
|
|
55.5 |
|
|
|
— |
|
|
|
55.5 |
|
|
$ |
4,664.1 |
|
|
$ |
81.5 |
|
|
$ |
4,745.6 |
|
|
$ |
4,483.0 |
|
|
$ |
77.1 |
|
|
$ |
4,560.1 |
|
| Reconciliation of revenue |
|
|
|
|
|
|
|
|
|
|
|
|
|
|
|
|
|
|
|
|
|
|
|
| Elimination of inter-segment revenue |
|
|
|
|
|
|
|
|
|
(69.0 |
) |
|
|
|
|
|
|
|
|
|
|
(55.5 |
) |
| Total consolidated revenue |
|
|
|
|
|
|
|
|
$ |
4,676.5 |
|
|
|
|
|
|
|
|
|
|
$ |
4,504.5 |
|
|
|
|
|
|
|
|
|
|
|
|
|
|
|
|
|
|
|
|
|
|
|
|
|
| Less: |
|
|
|
|
|
|
|
|
|
|
|
|
|
|
|
|
|
|
|
|
|
|
|
| Cost of sales |
|
|
|
|
|
|
|
|
|
|
|
|
|
|
|
|
|
|
|
|
|
|
|
| New vehicle |
|
2,367.4 |
|
|
|
— |
|
|
|
|
|
|
|
2,285.0 |
|
|
|
— |
|
|
|
|
|
| Used vehicle |
|
1,231.3 |
|
|
|
— |
|
|
|
|
|
|
|
1,205.4 |
|
|
|
— |
|
|
|
|
|
| Parts and service |
|
280.8 |
|
|
|
— |
|
|
|
|
|
|
|
260.2 |
|
|
|
— |
|
|
|
|
|
| Finance and insurance |
|
— |
|
|
|
59.2 |
|
|
|
|
|
|
|
— |
|
|
|
57.7 |
|
|
|
|
|
| Selling, general and administrative expenses |
|
|
|
|
|
|
|
|
|
|
|
|
|
|
|
|
|
|
|
|
|
|
|
| Personnel costs |
|
332.4 |
|
|
|
— |
|
|
|
|
|
|
|
317.0 |
|
|
|
— |
|
|
|
|
|
| Rent and related expenses |
|
42.3 |
|
|
|
— |
|
|
|
|
|
|
|
39.2 |
|
|
|
— |
|
|
|
|
|
| Advertising |
|
17.8 |
|
|
|
— |
|
|
|
|
|
|
|
14.0 |
|
|
|
— |
|
|
|
|
|
| Other selling, general and administrative expense |
|
139.3 |
|
|
|
— |
|
|
|
|
|
|
|
108.9 |
|
|
|
— |
|
|
|
|
|
| Other segment items |
|
— |
|
|
|
1.6 |
|
|
|
|
|
|
|
— |
|
|
|
1.9 |
|
|
|
|
|
| Depreciation and amortization |
|
23.0 |
|
|
|
— |
|
|
|
|
|
|
|
19.1 |
|
|
|
0.1 |
|
|
|
|
|
| Floor plan interest expense |
|
25.6 |
|
|
|
— |
|
|
|
|
|
|
|
23.7 |
|
|
|
— |
|
|
|
|
|
| Segment operating income* |
$ |
204.2 |
|
|
$ |
20.6 |
|
|
$ |
224.8 |
|
|
$ |
210.5 |
|
|
$ |
17.4 |
|
|
$ |
227.9 |
|
|
|
|
|
|
|
|
|
|
|
|
|
|
|
|
|
|
|
|
|
|
|
|
|
| Reconciliation of segment operating income |
|
|
|
|
|
|
|
|
|
|
|
|
|
|
|
|
|
|
|
|
|
|
|
| Intersegment eliminations |
|
|
|
|
|
|
|
|
|
|
|
|
|
|
|
|
|
|
|
|
|
|
|
| Total intersegment revenue eliminations |
|
|
|
|
|
|
|
|
|
(69.0 |
) |
|
|
|
|
|
|
|
|
|
|
(55.5 |
) |
| Total intersegment cost of sales eliminations |
|
|
|
|
|
|
|
|
|
55.1 |
|
|
|
|
|
|
|
|
|
|
|
53.6 |
|
| Deferral of SG&A expense (related to capitalized contract costs offset by amortization) |
|
|
|
|
|
|
|
|
|
4.8 |
|
|
|
|
|
|
|
|
|
|
|
4.1 |
|
| Total intersegment eliminations |
|
|
|
|
|
|
|
|
|
(9.1 |
) |
|
|
|
|
|
|
|
|
|
|
2.1 |
|
| Asset impairments |
|
|
|
|
|
|
|
|
|
(115.0 |
) |
|
|
|
|
|
|
|
|
|
|
(14.1 |
) |
| Other interest expense, net |
|
|
|
|
|
|
|
|
|
(52.4 |
) |
|
|
|
|
|
|
|
|
|
|
(44.2 |
) |
| Gain on dealership divestitures, net |
|
|
|
|
|
|
|
|
|
34.5 |
|
|
|
|
|
|
|
|
|
|
|
— |
|
| Income before income taxes |
|
|
|
|
|
|
|
|
$ |
82.8 |
|
|
|
|
|
|
|
|
|
|
$ |
171.7 |
|
| ______________________________ |
|
|
|
|
|
|
|
|
|
|
|
|
|
|
|
|
|
|
|
|
|
|
|
| *Segment operating income is calculated as GAAP operating income, excluding the effects of asset impairments and including floor plan interest expense. |
|
|
|
|
|
|
|
|
|
|
|
|
|
|
|
|
|
|
|
|
|
|
|
|
|
|
|
|
|
|
|
|
|
|
|
|
|
|
|
|
|
|
|
|
|
|
|
|
For the Twelve Months Ended December 31, 2025 |
|
|
|
|
|
|
|
|
|
|
|
For the Twelve Months Ended December 31, 2024 |
|
|
|
|
|
|
|
|
|
|
|
Dealerships |
|
|
|
TCA |
|
|
|
Total |
|
|
|
Dealerships |
|
|
|
TCA |
|
|
|
Total |
|
|
|
(In millions) |
|
|
|
|
|
|
|
|
|
|
|
|
|
|
|
|
|
|
|
|
|
|
| Revenue from external customers |
$ |
17,672.9 |
|
|
$ |
326.1 |
|
|
$ |
17,999.0 |
|
|
$ |
16,885.0 |
|
|
$ |
303.6 |
|
|
$ |
17,188.6 |
|
| Intersegment revenue |
|
271.9 |
|
|
|
— |
|
|
|
271.9 |
|
|
|
222.5 |
|
|
|
— |
|
|
|
222.5 |
|
|
$ |
17,944.8 |
|
|
$ |
326.1 |
|
|
$ |
18,270.9 |
|
|
$ |
17,107.5 |
|
|
$ |
303.6 |
|
|
$ |
17,411.1 |
|
| Reconciliation of revenue |
|
|
|
|
|
|
|
|
|
|
|
|
|
|
|
|
|
|
|
|
|
|
|
| Elimination of inter-segment revenue |
|
|
|
|
|
|
|
|
|
(271.9 |
) |
|
|
|
|
|
|
|
|
|
|
(222.5 |
) |
| Total consolidated revenue |
|
|
|
|
|
|
|
|
$ |
17,999.0 |
|
|
|
|
|
|
|
|
|
|
$ |
17,188.6 |
|
|
|
|
|
|
|
|
|
|
|
|
|
|
|
|
|
|
|
|
|
|
|
|
|
| Less: |
|
|
|
|
|
|
|
|
|
|
|
|
|
|
|
|
|
|
|
|
|
|
|
| Cost of sales |
|
|
|
|
|
|
|
|
|
|
|
|
|
|
|
|
|
|
|
|
|
|
|
| New vehicle |
|
8,874.2 |
|
|
|
— |
|
|
|
|
|
|
|
8,209.3 |
|
|
|
— |
|
|
|
|
|
| Used vehicle |
|
4,966.3 |
|
|
|
— |
|
|
|
|
|
|
|
4,972.7 |
|
|
|
— |
|
|
|
|
|
| Parts and service |
|
1,071.2 |
|
|
|
— |
|
|
|
|
|
|
|
1,043.0 |
|
|
|
— |
|
|
|
|
|
| Finance and insurance |
|
— |
|
|
|
239.0 |
|
|
|
|
|
|
|
— |
|
|
|
223.4 |
|
|
|
|
|
| Selling, general and administrative expenses |
|
|
|
|
|
|
|
|
|
|
|
|
|
|
|
|
|
|
|
|
|
|
|
| Personnel costs |
|
1,299.3 |
|
|
|
— |
|
|
|
|
|
|
|
1,256.2 |
|
|
|
— |
|
|
|
|
|
| Rent and related expenses |
|
131.6 |
|
|
|
— |
|
|
|
|
|
|
|
142.3 |
|
|
|
— |
|
|
|
|
|
| Advertising |
|
68.8 |
|
|
|
— |
|
|
|
|
|
|
|
61.8 |
|
|
|
— |
|
|
|
|
|
| Other selling, general and administrative expense |
|
501.4 |
|
|
|
— |
|
|
|
|
|
|
|
441.0 |
|
|
|
— |
|
|
|
|
|
| Other segment items |
|
— |
|
|
|
7.2 |
|
|
|
|
|
|
|
— |
|
|
|
7.0 |
|
|
|
|
|
| Depreciation and amortization |
|
82.3 |
|
|
|
0.2 |
|
|
|
|
|
|
|
74.6 |
|
|
|
0.4 |
|
|
|
|
|
| Floor plan interest expense |
|
91.2 |
|
|
|
— |
|
|
|
|
|
|
|
89.9 |
|
|
|
— |
|
|
|
|
|
| Segment operating income* |
$ |
858.6 |
|
|
$ |
79.8 |
|
|
$ |
938.4 |
|
|
$ |
816.7 |
|
|
$ |
72.8 |
|
|
$ |
889.5 |
|
|
|
|
|
|
|
|
|
|
|
|
|
|
|
|
|
|
|
|
|
|
|
|
|
| Reconciliation of segment operating income |
|
|
|
|
|
|
|
|
|
|
|
|
|
|
|
|
|
|
|
|
|
|
|
| Intersegment eliminations |
|
|
|
|
|
|
|
|
|
|
|
|
|
|
|
|
|
|
|
|
|
|
|
| Total intersegment revenue eliminations |
|
|
|
|
|
|
|
|
|
(271.9 |
) |
|
|
|
|
|
|
|
|
|
|
(222.5 |
) |
| Total intersegment cost of sales eliminations |
|
|
|
|
|
|
|
|
|
223.3 |
|
|
|
|
|
|
|
|
|
|
|
208.5 |
|
| Deferral of SG&A expense (related to capitalized contract costs offset by amortization) |
|
|
|
|
|
|
|
|
|
20.7 |
|
|
|
|
|
|
|
|
|
|
|
19.7 |
|
| Total intersegment eliminations |
|
|
|
|
|
|
|
|
|
(27.9 |
) |
|
|
|
|
|
|
|
|
|
|
5.8 |
|
| Asset impairments |
|
|
|
|
|
|
|
|
|
(141.0 |
) |
|
|
|
|
|
|
|
|
|
|
(149.5 |
) |
| Other interest expense, net |
|
|
|
|
|
|
|
|
|
(187.5 |
) |
|
|
|
|
|
|
|
|
|
|
(179.1 |
) |
| Gain on dealership divestitures, net |
|
|
|
|
|
|
|
|
|
80.2 |
|
|
|
|
|
|
|
|
|
|
|
8.6 |
|
| Income before income taxes |
|
|
|
|
|
|
|
|
$ |
662.2 |
|
|
|
|
|
|
|
|
|
|
$ |
575.3 |
|
| ______________________________ |
|
|
|
|
|
|
|
|
|
|
|
|
|
|
|
|
|
|
|
|
|
|
|
| *Segment operating income is calculated as GAAP operating income, excluding the effects of asset impairments and including floor plan interest expense. |
|
|
|
|
|
|
|
|
|
|
|
|
|
|
|
|
|
|
|
|
|
|
|
|
|
|
|
|
|
|
|
|
|
|
|
|
|
|
|
| ASBURY AUTOMOTIVE GROUP, INC.Supplemental Disclosures(Unaudited) |
|
|
|
|
|
|
|
|
|
|
|
|
|
|
|
|
|
|
|
|
|
|
|
|
|
|
|
|
|
|
|
| The following tables provide reconciliations for our non-GAAP metrics: |
|
|
|
|
|
|
|
|
|
|
|
|
|
|
|
|
|
|
|
|
|
|
|
|
|
|
|
|
|
|
|
|
For the Three Months Ended |
|
|
|
|
|
|
|
For the Twelve Months Ended |
|
|
|
|
|
|
|
December 31, 2025 |
|
|
|
December 31, 2024 |
|
|
|
December 31, 2025 |
|
|
|
September 30, 2025 |
|
|
|
(Dollars in millions) |
|
|
|
|
|
|
|
|
|
|
|
|
|
|
| Adjusted leverage ratio: |
|
|
|
|
|
|
|
|
|
|
|
|
|
|
|
| Long-term debt (including current portion) |
|
|
|
|
|
|
|
|
$ |
3,572.0 |
|
|
$ |
3,605.3 |
|
| Cash and floor plan offset |
|
|
|
|
|
|
|
|
|
(192.0 |
) |
|
|
(140.8 |
) |
| TCA cash |
|
|
|
|
|
|
|
|
|
12.2 |
|
|
|
11.0 |
|
| Availability under our used vehicle floor plan facility |
|
|
|
|
|
|
|
|
|
— |
|
|
|
(8.3 |
) |
| Adjusted long-term net debt |
|
|
|
|
|
|
|
|
$ |
3,392.1 |
|
|
$ |
3,467.1 |
|
|
|
|
|
|
|
|
|
|
|
|
|
|
|
|
|
| Calculation of earnings before interest, taxes, depreciation and amortization ("EBITDA"): |
|
|
|
|
|
|
|
|
|
|
|
|
|
|
|
| Net income |
$ |
60.0 |
|
|
$ |
128.8 |
|
|
$ |
492.0 |
|
|
$ |
560.8 |
|
|
|
|
|
|
|
|
|
|
|
|
|
|
|
|
|
| Depreciation and amortization |
|
23.0 |
|
|
|
19.2 |
|
|
|
82.4 |
|
|
|
78.7 |
|
| Income tax expense |
|
22.7 |
|
|
|
42.9 |
|
|
|
170.2 |
|
|
|
190.4 |
|
| Swap and other interest expense |
|
52.4 |
|
|
|
44.3 |
|
|
|
187.5 |
|
|
|
179.6 |
|
| Earnings before interest, taxes, depreciation and amortization ("EBITDA") |
$ |
158.1 |
|
|
$ |
235.2 |
|
|
$ |
932.1 |
|
|
$ |
1,009.4 |
|
|
|
|
|
|
|
|
|
|
|
|
|
|
|
|
|
| Non-core items - expense (income): |
|
|
|
|
|
|
|
|
|
|
|
|
|
|
|
| Gain on dealership divestitures, net |
$ |
(34.5 |
) |
|
$ |
— |
|
|
$ |
(80.2 |
) |
|
$ |
(45.8 |
) |
| Proceeds from franchise termination |
|
— |
|
|
|
(1.9 |
) |
|
|
— |
|
|
|
(1.9 |
) |
| Asset impairments |
|
115.0 |
|
|
|
14.1 |
|
|
|
141.0 |
|
|
|
40.1 |
|
| Hurricane Milton losses |
|
— |
|
|
|
6.4 |
|
|
|
— |
|
|
|
6.4 |
|
| Insurance recovery |
|
— |
|
|
|
— |
|
|
|
(15.0 |
) |
|
|
(15.0 |
) |
| Professional fees associated with acquisition |
|
0.7 |
|
|
|
— |
|
|
|
15.4 |
|
|
|
14.7 |
|
| Tekion implementation expenses |
|
6.4 |
|
|
|
— |
|
|
|
8.6 |
|
|
|
2.2 |
|
| Fixed assets write-off |
|
3.8 |
|
|
|
— |
|
|
|
3.8 |
|
|
|
— |
|
| Total non-core items |
|
91.4 |
|
|
|
18.6 |
|
|
|
73.5 |
|
|
|
0.7 |
|
|
|
|
|
|
|
|
|
|
|
|
|
|
|
|
|
| Adjusted EBITDA |
$ |
249.6 |
|
|
$ |
253.8 |
|
|
$ |
1,005.6 |
|
|
$ |
1,010.2 |
|
|
|
|
|
|
|
|
|
|
|
|
|
|
|
|
|
| Impact of dealership acquisitions and divestitures |
|
|
|
|
|
|
|
|
$ |
56.7 |
|
|
$ |
77.5 |
|
| Transaction adjusted EBITDA |
|
|
|
|
|
|
|
|
$ |
1,062.3 |
|
|
$ |
1,087.7 |
|
|
|
|
|
|
|
|
|
|
|
|
|
|
|
|
|
| Transaction adjusted net leverage ratio |
|
|
|
|
|
|
|
|
|
3.2 |
|
|
|
3.2 |
|
|
|
|
|
|
|
|
|
|
|
|
|
|
|
|
|
|
|
|
|
|
|
|
|
|
|
|
|
|
Three Months Ended December 31, 2025 |
|
|
|
|
|
|
|
|
|
|
|
|
|
|
|
|
|
|
|
|
|
|
|
|
|
|
|
GAAP |
|
|
|
Gain on dealership divestitures, net |
|
|
|
Asset impairments |
|
|
|
Professional fees associated with acquisition |
|
|
|
Tekion implementation expenses |
|
|
|
Income tax effect |
|
|
|
Non-GAAP adjusted |
|
|
|
(In millions, except per share data) |
|
|
|
|
|
|
|
|
|
|
|
|
|
|
|
|
|
|
|
|
|
|
|
|
|
|
| Selling, general and administrative (SG&A) |
$ |
528.7 |
|
|
$ |
— |
|
|
$ |
(3.8 |
) |
|
$ |
(0.7 |
) |
|
$ |
(6.4 |
) |
|
$ |
— |
|
|
$ |
517.8 |
|
| Asset impairments |
$ |
115.0 |
|
|
$ |
— |
|
|
$ |
(115.0 |
) |
|
$ |
— |
|
|
$ |
— |
|
|
$ |
— |
|
|
$ |
— |
|
| Income from operations |
$ |
126.4 |
|
|
$ |
— |
|
|
$ |
118.8 |
|
|
$ |
0.7 |
|
|
$ |
6.4 |
|
|
$ |
— |
|
|
$ |
252.2 |
|
| Net income |
$ |
60.0 |
|
|
$ |
(34.5 |
) |
|
$ |
118.8 |
|
|
$ |
0.7 |
|
|
$ |
6.4 |
|
|
$ |
(22.1 |
) |
|
$ |
129.3 |
|
|
|
|
|
|
|
|
|
|
|
|
|
|
|
|
|
|
|
|
|
|
|
|
|
|
|
|
|
| Weighted average common share outstanding - diluted |
|
19.4 |
|
|
|
|
|
|
|
|
|
|
|
|
|
|
|
|
|
|
|
|
|
|
|
19.4 |
|
|
|
|
|
|
|
|
|
|
|
|
|
|
|
|
|
|
|
|
|
|
|
|
|
|
|
|
|
| Diluted EPS |
$ |
3.10 |
|
|
$ |
(1.35 |
) |
|
$ |
4.65 |
|
|
$ |
0.03 |
|
|
$ |
0.25 |
|
|
$ |
— |
|
|
$ |
6.67 |
|
|
|
|
|
|
|
|
|
|
|
|
|
|
|
|
|
|
|
|
|
|
|
|
|
|
|
|
|
| SG&A as a % of gross profit |
|
66.7 |
% |
|
|
|
|
|
|
|
|
|
|
|
|
|
|
|
|
|
|
|
|
|
|
65.3 |
% |
| Income from operations as a % of revenue |
|
2.7 |
% |
|
|
|
|
|
|
|
|
|
|
|
|
|
|
|
|
|
|
|
|
|
|
5.4 |
% |
|
|
|
|
|
|
|
|
|
|
|
|
|
|
|
|
|
|
|
|
|
|
|
|
|
|
|
|
| SG&A (Same Store) |
$ |
447.3 |
|
|
$ |
— |
|
|
$ |
(3.8 |
) |
|
$ |
— |
|
|
$ |
(6.4 |
) |
|
$ |
— |
|
|
$ |
437.1 |
|
| SG&A as a % of gross profit (Same Store) |
|
65.5 |
% |
|
|
|
|
|
|
|
|
|
|
|
|
|
|
|
|
|
|
|
|
|
|
64.1 |
% |
|
|
|
|
|
|
|
|
|
|
|
|
|
|
|
|
|
|
|
|
|
|
|
|
|
Three Months Ended December 31, 2024 |
|
|
|
|
|
|
|
|
|
|
|
|
|
|
|
|
|
|
|
|
|
|
|
GAAP |
|
|
|
Proceeds from franchise termination |
|
|
|
Asset impairments |
|
|
|
Hurricane Milton losses |
|
|
|
Income tax effect |
|
|
|
Non-GAAP adjusted |
|
|
|
(In millions, except per share data) |
|
|
|
|
|
|
|
|
|
|
|
|
|
|
|
|
|
|
|
|
|
|
| Selling, general and administrative (SG&A) |
$ |
476.9 |
|
|
$ |
1.9 |
|
|
$ |
— |
|
|
$ |
(6.4 |
) |
|
$ |
— |
|
|
$ |
472.4 |
|
| Income from operations |
$ |
239.7 |
|
|
$ |
(1.9 |
) |
|
$ |
14.1 |
|
|
$ |
6.4 |
|
|
$ |
— |
|
|
$ |
258.3 |
|
| Net income |
$ |
128.8 |
|
|
$ |
(1.9 |
) |
|
$ |
14.1 |
|
|
$ |
6.4 |
|
|
$ |
(4.3 |
) |
|
$ |
143.1 |
|
|
|
|
|
|
|
|
|
|
|
|
|
|
|
|
|
|
|
|
|
|
|
|
|
| Weighted average common share outstanding - diluted |
|
19.7 |
|
|
|
|
|
|
|
|
|
|
|
|
|
|
|
|
|
|
|
19.7 |
|
|
|
|
|
|
|
|
|
|
|
|
|
|
|
|
|
|
|
|
|
|
|
|
|
| Diluted EPS |
$ |
6.54 |
|
|
$ |
(0.07 |
) |
|
$ |
0.55 |
|
|
$ |
0.25 |
|
|
$ |
— |
|
|
$ |
7.26 |
|
|
|
|
|
|
|
|
|
|
|
|
|
|
|
|
|
|
|
|
|
|
|
|
|
| SG&A as a % of gross profit |
|
63.6 |
% |
|
|
|
|
|
|
|
|
|
|
|
|
|
|
|
|
|
|
63.0 |
% |
| Income from operations as a % of revenue |
|
5.3 |
% |
|
|
|
|
|
|
|
|
|
|
|
|
|
|
|
|
|
|
5.7 |
% |
|
|
|
|
|
|
|
|
|
|
|
|
|
|
|
|
|
|
|
|
|
|
|
|
| SG&A (Same Store) |
$ |
454.0 |
|
|
$ |
— |
|
|
$ |
— |
|
|
$ |
(6.4 |
) |
|
$ |
— |
|
|
$ |
447.6 |
|
| SG&A as a % of gross profit (Same Store) |
|
63.3 |
% |
|
|
|
|
|
|
|
|
|
|
|
|
|
|
|
|
|
|
62.4 |
% |
|
|
|
|
|
|
|
|
|
|
|
|
|
|
|
|
|
|
|
|
|
|
|
|
|
|
|
|
|
|
|
|
|
|
|
|
Twelve Months Ended December 31, 2025 |
|
|
|
|
|
|
|
|
|
|
|
|
|
|
|
|
|
|
|
|
|
|
|
|
|
|
|
|
|
|
|
|
|
|
GAAP |
|
|
|
Gain on dealership divestitures, net |
|
|
|
Asset impairments |
|
|
|
Insurance recovery |
|
|
|
Professional fees associated with acquisition |
|
|
|
Tekion implementation expenses |
|
|
|
Acquisition-related deferred tax true-up |
|
|
Income tax effect |
|
|
|
Non-GAAP adjusted |
|
|
|
(In millions, except per share data) |
|
|
|
|
|
|
|
|
|
|
|
|
|
|
|
|
|
|
|
|
|
|
|
|
|
|
|
|
|
|
|
|
|
| Selling, general and administrative (SG&A) |
$ |
1,987.6 |
|
|
$ |
— |
|
|
$ |
(3.8 |
) |
|
$ |
15.0 |
|
|
$ |
(15.4 |
) |
|
$ |
(8.6 |
) |
|
$ |
— |
|
$ |
— |
|
|
$ |
1,974.9 |
|
| Asset impairments |
$ |
141.0 |
|
|
$ |
— |
|
|
$ |
(141.0 |
) |
|
$ |
— |
|
|
$ |
— |
|
|
$ |
— |
|
|
$ |
— |
|
$ |
— |
|
|
$ |
— |
|
| Income from operations |
$ |
860.6 |
|
|
$ |
— |
|
|
$ |
144.8 |
|
|
$ |
(15.0 |
) |
|
$ |
15.4 |
|
|
$ |
8.6 |
|
|
$ |
— |
|
$ |
— |
|
|
$ |
1,014.4 |
|
| Net income |
$ |
492.0 |
|
|
$ |
(80.2 |
) |
|
$ |
144.8 |
|
|
$ |
(15.0 |
) |
|
$ |
15.4 |
|
|
$ |
8.6 |
|
|
$ |
2.3 |
|
$ |
(17.7 |
) |
|
$ |
550.1 |
|
|
|
|
|
|
|
|
|
|
|
|
|
|
|
|
|
|
|
|
|
|
|
|
|
|
|
|
|
|
|
|
|
|
|
|
| Weighted average common share outstanding - diluted |
|
19.6 |
|
|
|
|
|
|
|
|
|
|
|
|
|
|
|
|
|
|
|
|
|
|
|
|
|
|
|
|
|
|
19.6 |
|
|
|
|
|
|
|
|
|
|
|
|
|
|
|
|
|
|
|
|
|
|
|
|
|
|
|
|
|
|
|
|
|
|
|
|
| Diluted EPS |
$ |
25.13 |
|
|
$ |
(3.11 |
) |
|
$ |
5.62 |
|
|
$ |
(0.58 |
) |
|
$ |
0.60 |
|
|
$ |
0.33 |
|
|
$ |
0.12 |
|
$ |
— |
|
|
$ |
28.10 |
|
|
|
|
|
|
|
|
|
|
|
|
|
|
|
|
|
|
|
|
|
|
|
|
|
|
|
|
|
|
|
|
|
|
|
|
| SG&A as a % of gross profit |
|
64.7 |
% |
|
|
|
|
|
|
|
|
|
|
|
|
|
|
|
|
|
|
|
|
|
|
|
|
|
|
|
|
|
64.3 |
% |
| Income from operations as a % of revenue |
|
4.8 |
% |
|
|
|
|
|
|
|
|
|
|
|
|
|
|
|
|
|
|
|
|
|
|
|
|
|
|
|
|
|
5.6 |
% |
|
|
|
|
|
|
|
|
|
|
|
|
|
|
|
|
|
|
|
|
|
|
|
|
|
|
|
|
|
|
|
|
|
|
|
| SG&A (Same Store) |
$ |
1,785.4 |
|
|
$ |
— |
|
|
$ |
(3.8 |
) |
|
$ |
15.0 |
|
|
$ |
(5.1 |
) |
|
$ |
(8.6 |
) |
|
$ |
— |
|
$ |
— |
|
|
$ |
1,782.9 |
|
| SG&A as a % of gross profit (Same Store) |
|
63.7 |
% |
|
|
|
|
|
|
|
|
|
|
|
|
|
|
|
|
|
|
|
|
|
|
|
|
|
|
|
|
|
63.6 |
% |
|
|
|
|
|
|
|
|
|
|
|
|
|
|
|
|
|
|
|
|
|
|
|
|
|
|
|
|
|
|
|
|
|
Twelve Months Ended December 31, 2024 |
|
|
|
|
|
|
|
|
|
|
|
|
|
|
|
|
|
|
|
|
|
|
|
|
|
|
|
|
|
|
|
GAAP |
|
|
|
Gain on dealership divestitures, net |
|
|
|
Proceeds from franchise termination |
|
|
|
Asset impairments |
|
|
|
Hurricane Milton losses |
|
|
|
Hail damage |
|
|
|
Income tax effect |
|
|
|
Non-GAAP adjusted |
|
|
|
(In millions, except per share data) |
|
|
|
|
|
|
|
|
|
|
|
|
|
|
|
|
|
|
|
|
|
|
|
|
|
|
|
|
|
|
| Selling, general and administrative (SG&A) |
$ |
1,888.5 |
|
|
$ |
— |
|
|
$ |
1.9 |
|
|
$ |
— |
|
|
$ |
(6.4 |
) |
|
$ |
(7.1 |
) |
|
$ |
— |
|
|
$ |
1,877.0 |
|
| Income from operations |
$ |
835.6 |
|
|
$ |
— |
|
|
$ |
(1.9 |
) |
|
$ |
149.5 |
|
|
$ |
6.4 |
|
|
$ |
7.1 |
|
|
$ |
— |
|
|
$ |
996.7 |
|
| Net income |
$ |
430.3 |
|
|
$ |
(8.6 |
) |
|
$ |
(1.9 |
) |
|
$ |
149.5 |
|
|
$ |
6.4 |
|
|
$ |
7.1 |
|
|
$ |
(37.6 |
) |
|
$ |
545.1 |
|
|
|
|
|
|
|
|
|
|
|
|
|
|
|
|
|
|
|
|
|
|
|
|
|
|
|
|
|
|
|
|
|
| Weighted average common share outstanding - diluted |
|
20.0 |
|
|
|
|
|
|
|
|
|
|
|
|
|
|
|
|
|
|
|
|
|
|
|
|
|
|
|
20.0 |
|
|
|
|
|
|
|
|
|
|
|
|
|
|
|
|
|
|
|
|
|
|
|
|
|
|
|
|
|
|
|
|
|
| Diluted EPS |
$ |
21.50 |
|
|
$ |
(0.32 |
) |
|
$ |
(0.07 |
) |
|
$ |
5.62 |
|
|
$ |
0.24 |
|
|
$ |
0.27 |
|
|
$ |
— |
|
|
$ |
27.24 |
|
|
|
|
|
|
|
|
|
|
|
|
|
|
|
|
|
|
|
|
|
|
|
|
|
|
|
|
|
|
|
|
|
| SG&A as a % of gross profit |
|
64.0 |
% |
|
|
|
|
|
|
|
|
|
|
|
|
|
|
|
|
|
|
|
|
|
|
|
|
|
|
63.7 |
% |
| Income from operations as a % of revenue |
|
4.9 |
% |
|
|
|
|
|
|
|
|
|
|
|
|
|
|
|
|
|
|
|
|
|
|
|
|
|
|
5.8 |
% |
|
|
|
|
|
|
|
|
|
|
|
|
|
|
|
|
|
|
|
|
|
|
|
|
|
|
|
|
|
|
|
|
| SG&A (Same Store) |
$ |
1,777.8 |
|
|
$ |
— |
|
|
$ |
— |
|
|
$ |
— |
|
|
$ |
(6.4 |
) |
|
$ |
(7.1 |
) |
|
$ |
— |
|
|
$ |
1,764.3 |
|
| SG&A as a % of gross profit (Same Store) |
|
63.5 |
% |
|
|
|
|
|
|
|
|
|
|
|
|
|
|
|
|
|
|
|
|
|
|
|
|
|
|
63.1 |
% |
|
|
|
|
|
|
|
|
|
For the Year Ended December 31, |
|
|
|
|
|
|
|
2025 |
|
|
|
2024 |
|
|
|
(In millions) |
|
|
|
|
|
|
| Adjusted cash flow from operations: |
|
|
|
|
|
|
|
| Cash provided by operating activities |
$ |
775.2 |
|
|
$ |
671.2 |
|
| Change in Floor Plan Notes Payable—Non-Trade, net |
|
(57.2 |
) |
|
|
(5.2 |
) |
| Change in Floor Plan Notes Payable—Non-Trade associated with floor plan offset, used vehicle borrowing base changes adjusted for acquisition and divestitures |
|
(9.1 |
) |
|
|
71.9 |
|
| Change in Floor Plan Notes Payable—Trade associated with floor plan offset, adjusted for acquisition and divestitures |
|
(57.4 |
) |
|
|
(49.5 |
) |
| Adjusted cash flow provided by operating activities |
$ |
651.4 |
|
|
$ |
688.4 |
|

View source version on businesswire.com
: https://www.businesswire.com/news/home/20260205073949/en/
Investors & Reporters May Contact:
Joe Sorice
Sr. Manager, Investor Relations
(770) 418-8211
[email protected]
Source: Asbury Automotive Group, Inc.

Shop
Solutions
Support
Company
Copyright © 2026 Asbury Automotive Group.
Cookie Preferences
Built with love by the Digital Army Rangers
.
Cookie Preferences
We use cookies and other third-party technologies to perform analytics, improve your experience, measure site performance, and personalize content, and share information with such technology providers like analytic companies and advertisers. See the Privacy Policy
for more details. By continuing to use our site, you agree to our Terms
.
Got It