WLTH
Fiscal year ends January Quarters are offset from the calendar — Q1 is Feb–Apr

Wealthfront Corporation is a product-driven technology company that operates a digital financial solutions platform for digital natives, including Millennials and Gen Z. Founded in 2008, the company provides a suite of automated financial products designed to help clients build long-term wealth. Its core offerings include cash management services, investment advisory, borrowing and lending, and financial planning solutions. The platform utilizes proprietary technology infrastructure to deliver low-cost, fully automated services, allowing for rapid product iteration and reduced client fees. Wealthfront serves high-earning clients who prioritize savings and long-term investing, offering features such as 24/7 instant withdrawals via the RTP Network and FedNow. The company generates revenue primarily from fees associated with cash management and investment advisory assets, maintaining a business model focused on organic growth and high client retention through aligned incentives and transparent pricing.

Summarised from the company's own disclosures, fiscal year ended Apr 2026

Industry Financial Data & Stock Exchanges Homepage ir.wealthfront.com
Sector Financial Services IR page ir.wealthfront.com
Tags
robo-advisory, cash management, investment advisory, financial planning, digital banking, wealth management, automated investing, personal finance, Wealthfront Cash Account, Wealthfront Advisers LLC, RTP Network, FedNow
Press page —

Metrics

Valuation  
Market cap $ 1.565B
Market cap (USD) $ 1.565B
P/E -13.66
PEG —
P/BV 2.52
P/S 4.29
P/OCF 10.28
P/FCF —
Dividend yield —
Turnover / mcap —
Returns  
ROE -6.8%
ROI -23.3%
ROIC -23.3%
Profit margin -11.5%
Growth  
Revenue growing —
Profits growing —
Revenue up 3y —
Revenue up 5y —
Earnings growth 3y (net profit CAGR) —
Quality  
Profitable No
Margin expanding —
Buying back stock —
Diluting (TTM) —
Debt/Equity —
Podcast bulls (TTM) Sign up
Podcast bears (TTM) Sign up
Podcast sentiment (TTM) Sign up
Podcast sentiment % (TTM) Sign up
News sentiment (TTM) 18
Quality score -40.0%
Insiders  
Buys, 1w Sign up
Buys, 1m Sign up
Buys, 1y Sign up
Sells, 1w Sign up
Sells, 1m Sign up
Sells, 1y Sign up

Sign up to see this company's insider trades

Figure FY 2026
Revenue 364.993M
Net profit -42.066M

Figure FY 2026
Share price 13.59
P/OCF 13.42

Filed figures

Figure Jan 2023 Jan 2024 Jan 2025 Jan 2026
Balance sheet detail
Trade receivables (USD) — — 29.1M 33.1M
↳ YoY growth +13.7%
Borrowings, current (USD) — — — 181,000
Lease liabilities (USD) — — 13.4M 10.4M
Cash and deposits (USD) 67.5M 95.8M 143M 441M
Right-of-use assets (USD) — — 11.2M 8.7M
Net debt (borrowings + leases - cash) (USD) — — — -430M
Cash flow detail
Operating cash flow (USD) — 72.9M 123M 152M
Change in receivables (cash effect) (USD) — -9.31M -8.95M -4M
Share buybacks (cash effect) (USD) — 0.00 -37M -459,000
Interest paid (cash effect) (USD) — -17.4M -12.2M -9.13M
Income taxes paid (cash effect) (USD) — — — -2.49M
Share-based compensation (USD) — 11.8M 9.36M 260M
Operating cash flow before change in receivables (USD) — 82.2M 132M 156M
Income detail
Research and development expense (USD) — 57.6M 64.5M 212M
Reported Apr 24, 2026 Apr 24, 2026 Apr 24, 2026 Sep 14, 2026

Operating KPIs — quarters

KPI Oct 24 Jan 25 Apr 25 Jul 25 Oct 25 Jan 26 Apr 26 Jul 26
Customers 1,488 1,584 1,648 1,710 1,785 1,843 1,900 1,968
↳ YoY growth +20.0% +16.4% +15.3% +15.1%
Reported Jan 12, 2026 Mar 11, 2026 Jun 4, 2026 Sep 9, 2026 Jan 12, 2026 Mar 11, 2026 Jun 4, 2026 Sep 9, 2026

Operating KPIs — years

KPI Jan 2025 Jan 2026
Customers 1,584 1,843
↳ YoY growth +16.4%
Reported Mar 11, 2026 Mar 11, 2026

Sign up to see institutional holdings

Sign Up

Podcast Mentions

Sign up to see podcast mentions and sentiment

Sign Up

Wealthfront Corporation — Other Events Bull 3 Bear 0 Capital return

On October 20, 2026, the Board of Directors of Wealthfront Corporation (the “Company”) approved the repurchase of up to an additional $150.0 million of the Company’s common stock under the Company’s share repurchase program. This authorization is an increase to the existing $100.0 million repurchase authorization, which was originally approved by the Company’s Board of Directors in March 2026, of which approximately $18.3 million remained available as of October 20, 2026.

Repurchases under the program may be made in the open market, in privately negotiated transactions, or by other methods, with the amount and timing of repurchases to be determined at the Company’s discretion, depending on market conditions and corporate needs. Open market repurchases will be structured to occur in accordance with applicable federal and state securities laws, including within the pricing and volume conditions of Rule 10b-18 under the Securities Exchange Act of 1934, as amended. The Company may also, from time to time, enter into Rule 10b5-1 plans to facilitate repurchases of its shares under this authorization.

Wealthfront Reports September 2026 Monthly Metrics Bull 1 Bear 0 Routine

October 6, 2026

PDF Version

PALO ALTO, Calif., Oct. 06, 2026 (GLOBE NEWSWIRE) -- Wealthfront Corporation (Nasdaq: WLTH) today reported select monthly metrics for September 2026.

“We drove strong Net Deposits across the platform in September, reflecting the strength of our best-in-class products that give clients smart, reliable ways to build wealth across various macroeconomic environments,” said CEO David Fortunato. “September marked our third consecutive month of positive Cash Net Deposits. In the second half of the month, Cash Net Deposits benefited from a higher Cash Account APY after we immediately passed along the 25 basis point Fed rate hike, which was partially offset by clients making quarterly cash tax payments during the month. We remain focused on driving cross-product adoption in transition environments like we are in today, including by building on our proven success with client incentives that helped lift asset-weighted cross-product adoption month-over-month to just under 64% at the end of September.”

  • Total Platform Assets at the end of September 2026 were $100.5 billion, relatively flat since the end of August 2026 and an increase of 9% year-over-year.

  • Cash Management Assets at the end of September 2026 were $45.3 billion, relatively flat since the end of August 2026 and a decrease of 4% year-over-year.

  • Investment Advisory Assets at the end of September 2026 were $55.2 billion, a decrease of 1% from the end of August 2026 and an increase of 24% year-over-year.

  • Total Net Deposits in September 2026 were $532 million. This consisted of Cash Management Net Depositsof $194 million and Investment Advisory Net Depositsof $338 million.

  • Funded Clients at the end of September 2026 were 1.54 million, an increase of 1% from the end of August 2026 and 13% year-over-year.

| | Sep-26 | Aug-26 | Sep-25 | | MoM | YoY |

| Total Platform Assets (in $ M) | **$**100,466 | $100,899 | $92,025 | | (0.4%) | 9.2% |

| Cash Management Assets | $45,279 | $45,085 | $47,381 | | 0.4% | (4.4%) |

| Investment Advisory Assets | $55,188 | $55,814 | $44,644 | | (1.1%) | 23.6% |

| | | | | | | |

| Total Net Deposits (in $ M) | **$**532 | **$**605 | **$**513 | | NM | NM |

| Cash Management Net Deposits | $194 | $228 | $138 | | NM | NM |

| Investment Advisory Net Deposits | $338 | $378 | $375 | | NM | NM |

| | | | | | | |

| Funded Clients (in K) | 1,536 | 1,521 | 1,364 | | 1.0**%** | 12.6**%** |

Note: Subtotals may not add up to totals due to rounding.

Additional Commentary:

  • September 2026-end Annualized Cash Management Fee Rate: As of the end of September 2026, our annualized cash management fee rate was roughly 55 basis points.

  • **Expected F3Q27 Employer Tax Expenses Tied to Options Exercises by Former Employees:**As noted during the F2Q27 earnings call, F3Q27 results will include one-time employer tax expenses tied to options exercises by former employees ahead of a September exercise deadline. We now expect to incur roughly $1.2 million in one-time employer tax expenses tied to options exercises by former employees in F3Q27, predominantly within product development expenses. Note, while these expenses are tied to a one-time event, these expenses will be included in both GAAP and adjusted F3Q27 results.

Disclosures

For definitions and additional information regarding these metrics, please refer to Wealthfront’s full monthly metrics release, which is available at ir.wealthfront.com.

This monthly metrics report provides certain limited purpose monthly performance results of Wealthfront Corporation and its consolidated subsidiaries (“we,” “Wealthfront” or the “Company”). This information is presented without commentary and should be read in conjunction with our most recent quarterly and annual results and our filings with the U.S. Securities and Exchange Commission (the “SEC”), which are available under the “Financial Information” tab of our Investor Relations website at ir.wealthfront.com.

The information provided is unaudited and the information for the months in the most recent fiscal quarter is preliminary, based on our estimates and subject to completion of our financial closing procedures. During the course of the financial close process, the Company may identify items that would require it to make adjustments, which may have a material impact to the information presented in this monthly metrics report, and final results for the fiscal quarter, as reported in our quarterly and annual filings with the SEC, may vary from the information provided herein. Past performance is not necessarily indicative of future results, and due to the limited nature of this data, a consistent correlation to earnings should not be assumed.

We intend to make these monthly metrics reports available on a regular basis on our Investor Relations website. We expect monthly metrics reports regarding each of the first two months of each fiscal quarter to be available towards the beginning of the following month. We expect the monthly metric report for the third month of each fiscal quarter to be made available alongside our quarterly earnings announced for that completed quarter.

In addition to filings we make with the SEC, we use our Investor Relations website (ir.wealthfront.com), our X account (@Wealthfront), and our LinkedIn page (linkedin.com/company/wealthfront) as means of disclosing material non-public information and for complying with our disclosure obligations under Regulation FD.

About Wealthfront Wealthfront is a tech-driven financial platform helping digital natives turn their savings into wealth. Since pioneering the automated investing category in 2011, the company has grown into a leading consumer fintech that helps clients achieve their financial goals with innovative saving, investing, borrowing, and lending products. Wealthfront’s expanding suite of high-quality, low-cost offerings helps digital natives earn more on their savings, borrow at lower rates, and keep more of their returns. To learn more and get started, visit www.wealthfront.com or download the Wealthfront app.

September 9, 2026

PDF Version

Total Platform Assets up 12% year-over-year to $99.0 billion at the end of the quarter Funded clients up 14% year-over-year to 1.5 million at the end of the quarter Surpassed $100 billion in Total Platform Assets as of the end of August

PALO ALTO, Calif., Sept. 09, 2026 (GLOBE NEWSWIRE) -- Wealthfront Corporation (Nasdaq: WLTH), a tech-driven financial platform helping digital natives turn their savings into wealth, announced financial results for its fiscal second quarter ended July 31, 2026.

David Fortunato - CEO, President & Director:“Our focus on growing with clients through their wealth-building journeys has resulted in the purposeful construction of a durable business model that surpassed $100 billion in Total Platform Assets as of the end of August. We are extremely proud of this achievement and will continue supporting our clients with innovative products as they make significant life decisions such as buying homes and starting families. This quarter, we made further progress in automating the home mortgage origination process and enhanced our suite of family wealth management offerings with Custodial Accounts. We remain focused on shipping products aligned with our clients’ interests, and in doing so, believe we are in a strong position to achieve our goal of becoming the modern wealth manager for digital natives.”

Alan Imberman - CFO & Treasurer:“Our product-led growth strategy drove another strong quarter of adjusted free cash flow and enabled us to continue to invest in the organic build out of Wealthfront Home Lending, launch Custodial Accounts, and deliver several enhancements to our Cash Management and Investment Advisory products. During the quarter, we repurchased 3.3 million shares resulting in approximately $30 million of open market repurchases. We continue to maintain a strong and flexible capital position moving forward with cash balances above $450 million at quarter-end coupled with our strong adjusted free cash flow profile and debt-free balance sheet.”

Fiscal Second Quarter 2027 Results Summary

| | Three Months Ended July 31, | | |

| ($ in thousands, except per share amounts) | 2026 | | 2025 | | % change |

| GAAP | | | | | |

| Total revenue | $ | 91,874 | | | $ | 91,123 | | | 1 | % |

| Net income - diluted | | 17,562 | | | | 34,741 | | | (49 | )% |

| Net income margin - diluted (%) | | 19% | | | | 38% | | | |

| Diluted earnings per common share | $ | 0.10 | | | $ | 0.24 | | | (59 | )% |

| Net cash provided by operating activities | | 47,310 | | | | 38,924 | | | 22 | % |

| Operating cash flow conversion (%) | | 267% | | | | 112% | | | |

| Non-GAAP****1 | | | | | |

| Adjusted EBITDA | $ | 38,065 | | | $ | 44,759 | | | (15 | )% |

| Adjusted EBITDA margin (%) | | 41% | | | | 49% | | | |

| Adjusted free cash flow | | 28,293 | | | | 38,837 | | | (27 | )% |

| Adjusted free cash flow conversion (%) | | 74% | | | | 87% | | | |

| | | | | | | | | | |

1 Non-GAAP measure. Wealthfront’s reasons for use of the non-GAAP measure and a detailed reconciliation between the non-GAAP measure and the comparable GAAP amount are included at the end of this document in the section labeled ‘Non-GAAP Reconciliations’.

F2Q27 Financial Highlights

  • Quarterly total revenue of $91.9 million increased 1% year-over-year primarily due to a 12% year-over-year increase in Total Platform Assets to $99.0 billion. The difference between revenue growth and Total Platform Asset growth was primarily due to stronger growth in Investment Advisory Assets versus that of higher-fee Cash Management Assets. Investment Advisory Assets were $54.1 billion, up 30% year-over-year, and Cash Management Assetswere $44.9 billion, down 4% year-over-year. Total Platform Asset growth included Total Net Deposits of $1.1 billion in the quarter.

  • Funded Clientsof 1.51 million grew 14% year-over-year. Funded Accounts of 1.97 million grew 15% year-over-year.

  • GAAP expensesof $75.1 million increased from $51.8 million in the prior year quarter, with the increase due primarily to higher stock-based compensation (SBC) expense and higher product development expense. SBC expense was $16.4 million in the quarter versus $1.6 million in the prior year quarter, with this increase due primarily to the recognition of dual-trigger stock awards following the IPO, which took place in December 2025. Adjusted operating expenses1 of $58.7 million, which excludes SBC expense, increased 17% year-over-year, primarily due to higher adjusted product development expense. The increase in adjusted product development expense was primarily due to higher personnel-related expenses, including from increased headcount associated with the launch of Wealthfront Home Lending.

  • GAAP diluted net incomeof $17.6 million decreased from $34.7 million in the prior year quarter with the decline primarily due to higher GAAP expenses as a result of higher SBC expense from the recognition of dual-trigger stock awards following the IPO versus prior to the IPO. GAAP diluted net income marginwas 19%, a decrease from 38% in the prior year quarter driven primarily by the same SBC impact noted above.

  • GAAP diluted EPS was $0.10 compared to $0.24 in the prior year quarter primarily due to higher SBC expense tied to the recognition of dual-trigger stock awards following the IPO versus prior to the IPO.

  • Adjusted EBITDA1 of $38.1 million declined 15% year-over-year. Adjusted EBITDA margin1 was 41%, compared to 49% for the prior year quarter.

  • Net cash provided by operating activities was $47.3 million and Adjusted****free cash flow1 was $28.3 million. Adjusted free cash flow conversion ratio1 was 74% for the three months ended July 31, 2026. Note, adjusted free cash flow for the three months ended July 31, 2026 includes the typical, partial payment of employee cash bonuses in July.

1 Non-GAAP measure. Wealthfront’s reasons for use of the non-GAAP measure and a detailed reconciliation between the non-GAAP measure and the comparable GAAP amount are included at the end of this document in the section labeled ‘Non-GAAP Reconciliations’.

Recent****Business Highlights

  • **Surpassed $100 Billion in Total Platform Assets as of the end of August, doubling the figure in less than three years.**This milestone underscores digital natives’ commitment to proven, long-term saving and investing strategies as clients are building emergency funds, investing for retirement, and saving for their first homes, often at the same time. An analysis of clients on the platform from January 1, 2021, to January 1, 2026, shows that millennials have on average nearly tripled their wealth held on our platform over that time frame, and Gen Z clients have on average quintupled their wealth held on our platform over that time frame. Wealthfront will aim to continue to build high-quality products at industry-low fee rates in order to help turn clients’ savings into wealth and ensure that they achieve their financial goals.

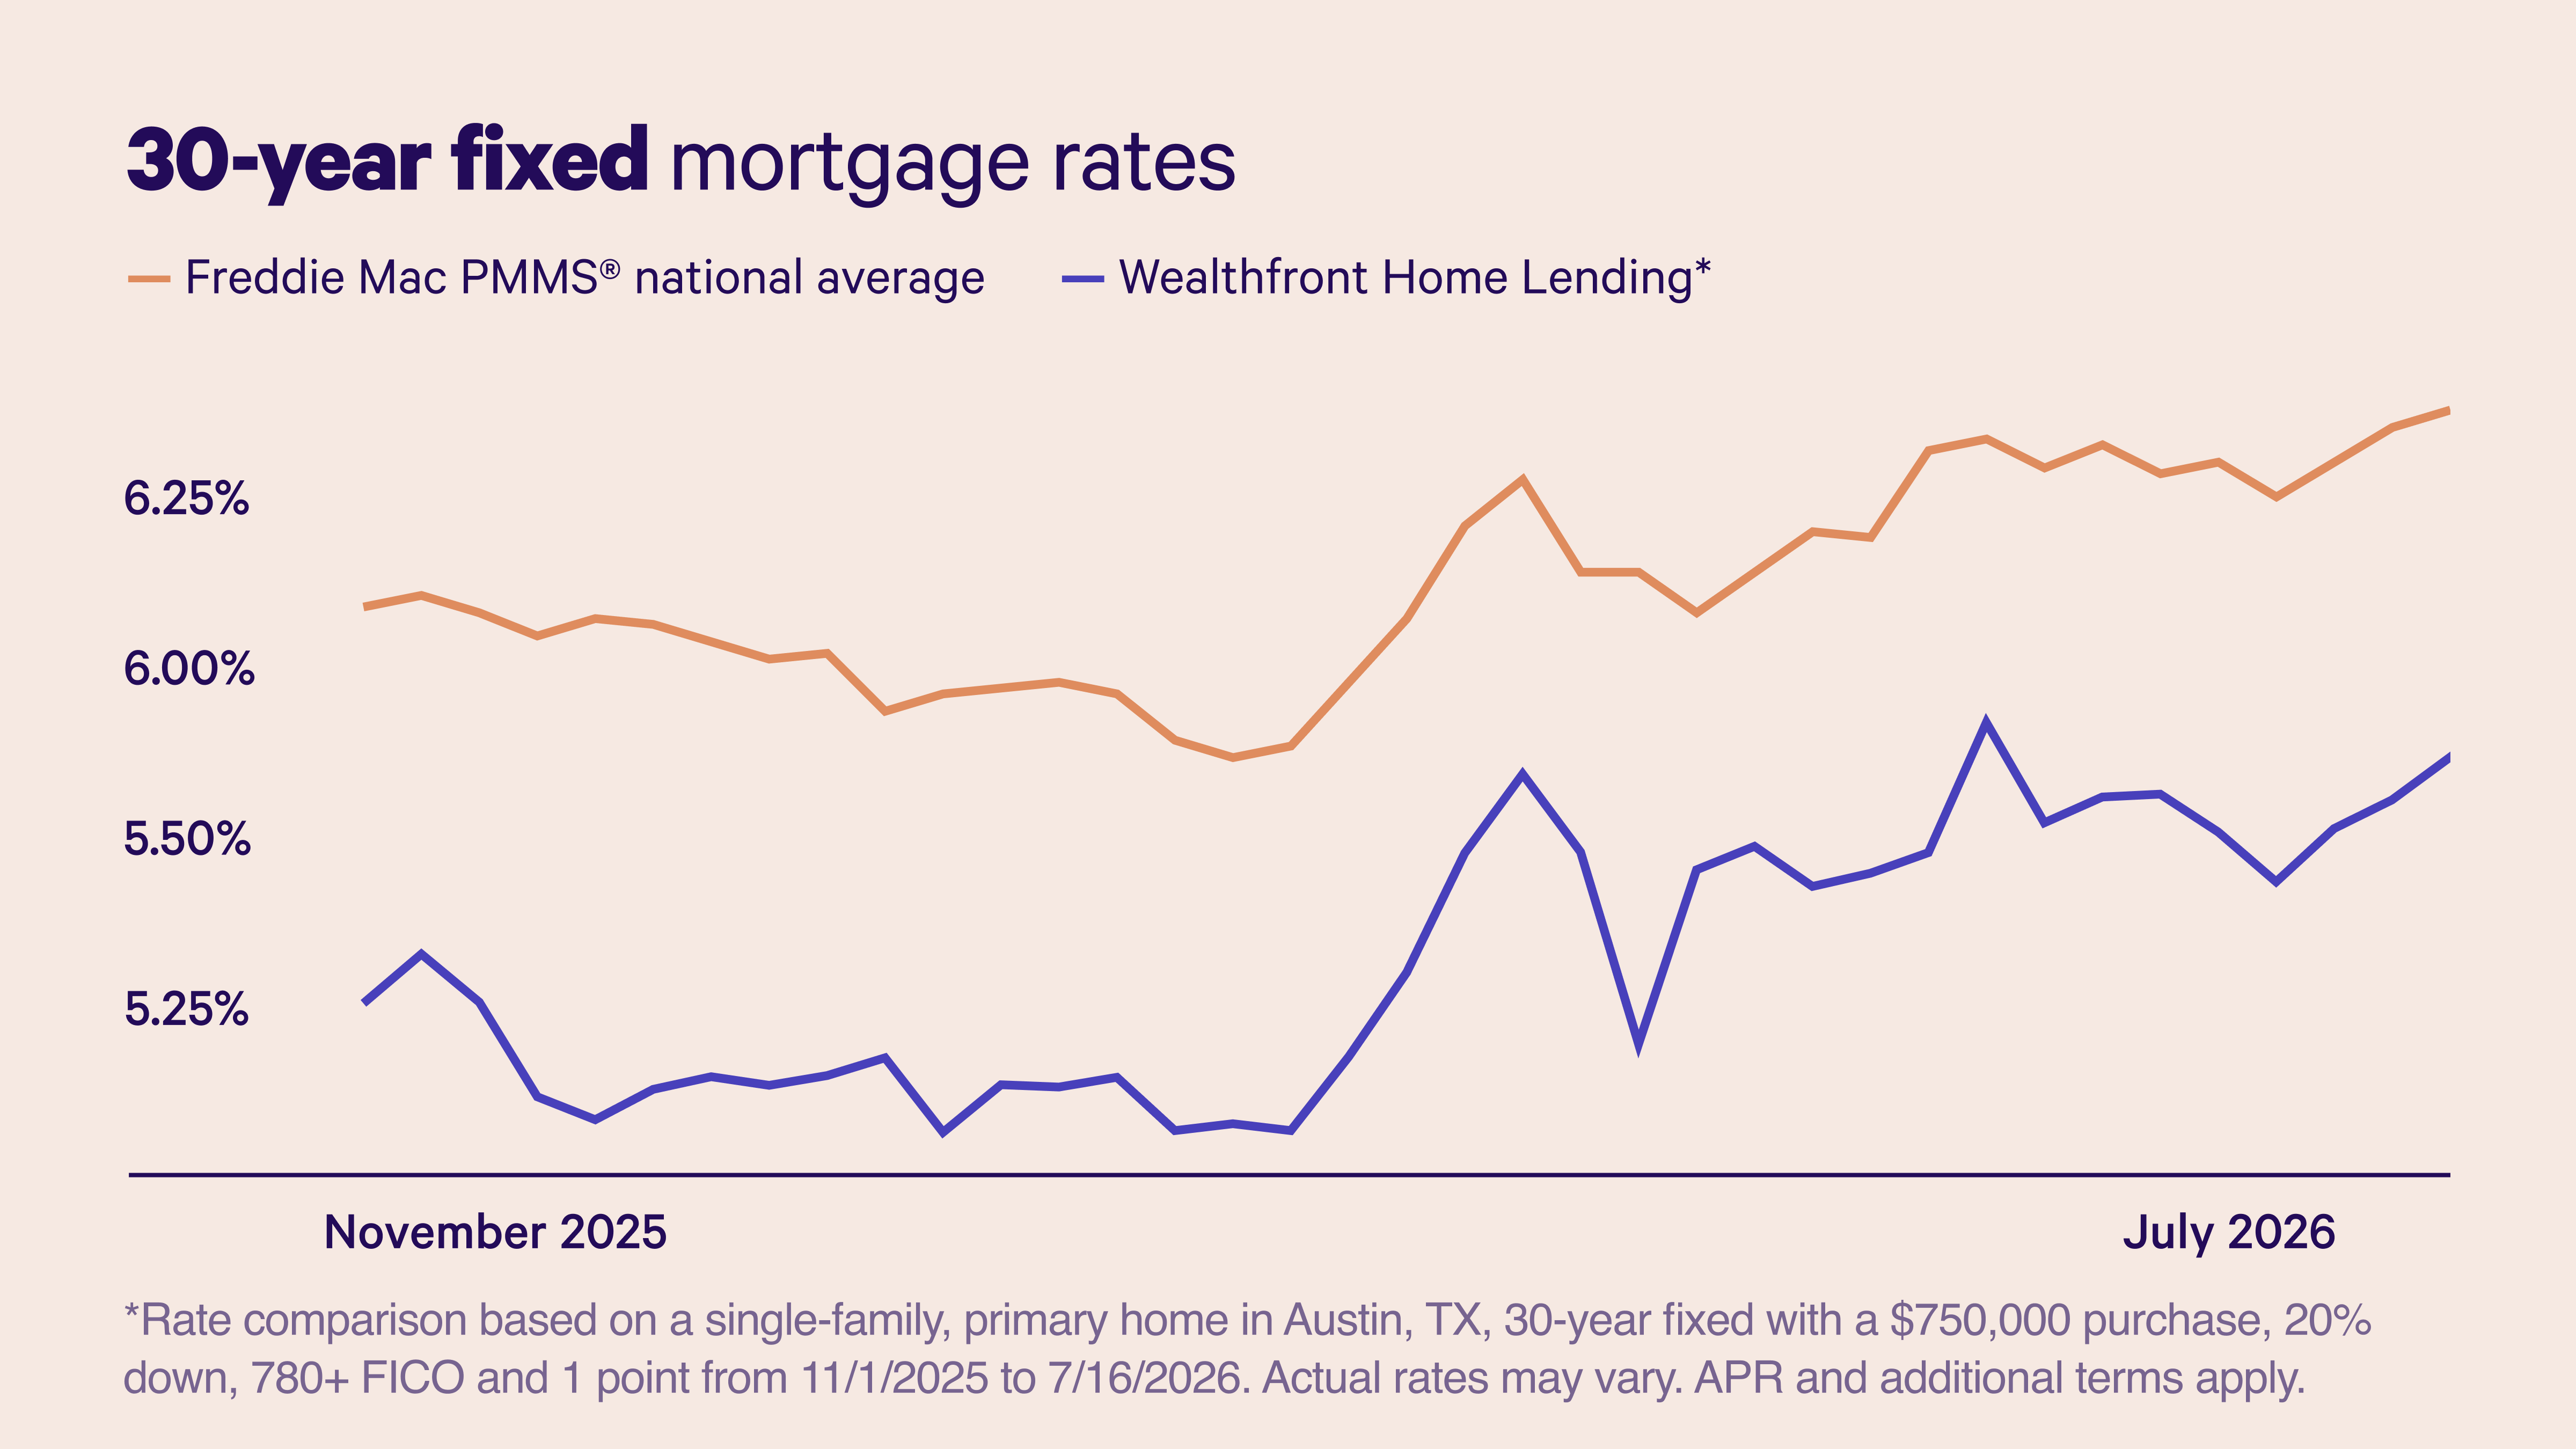
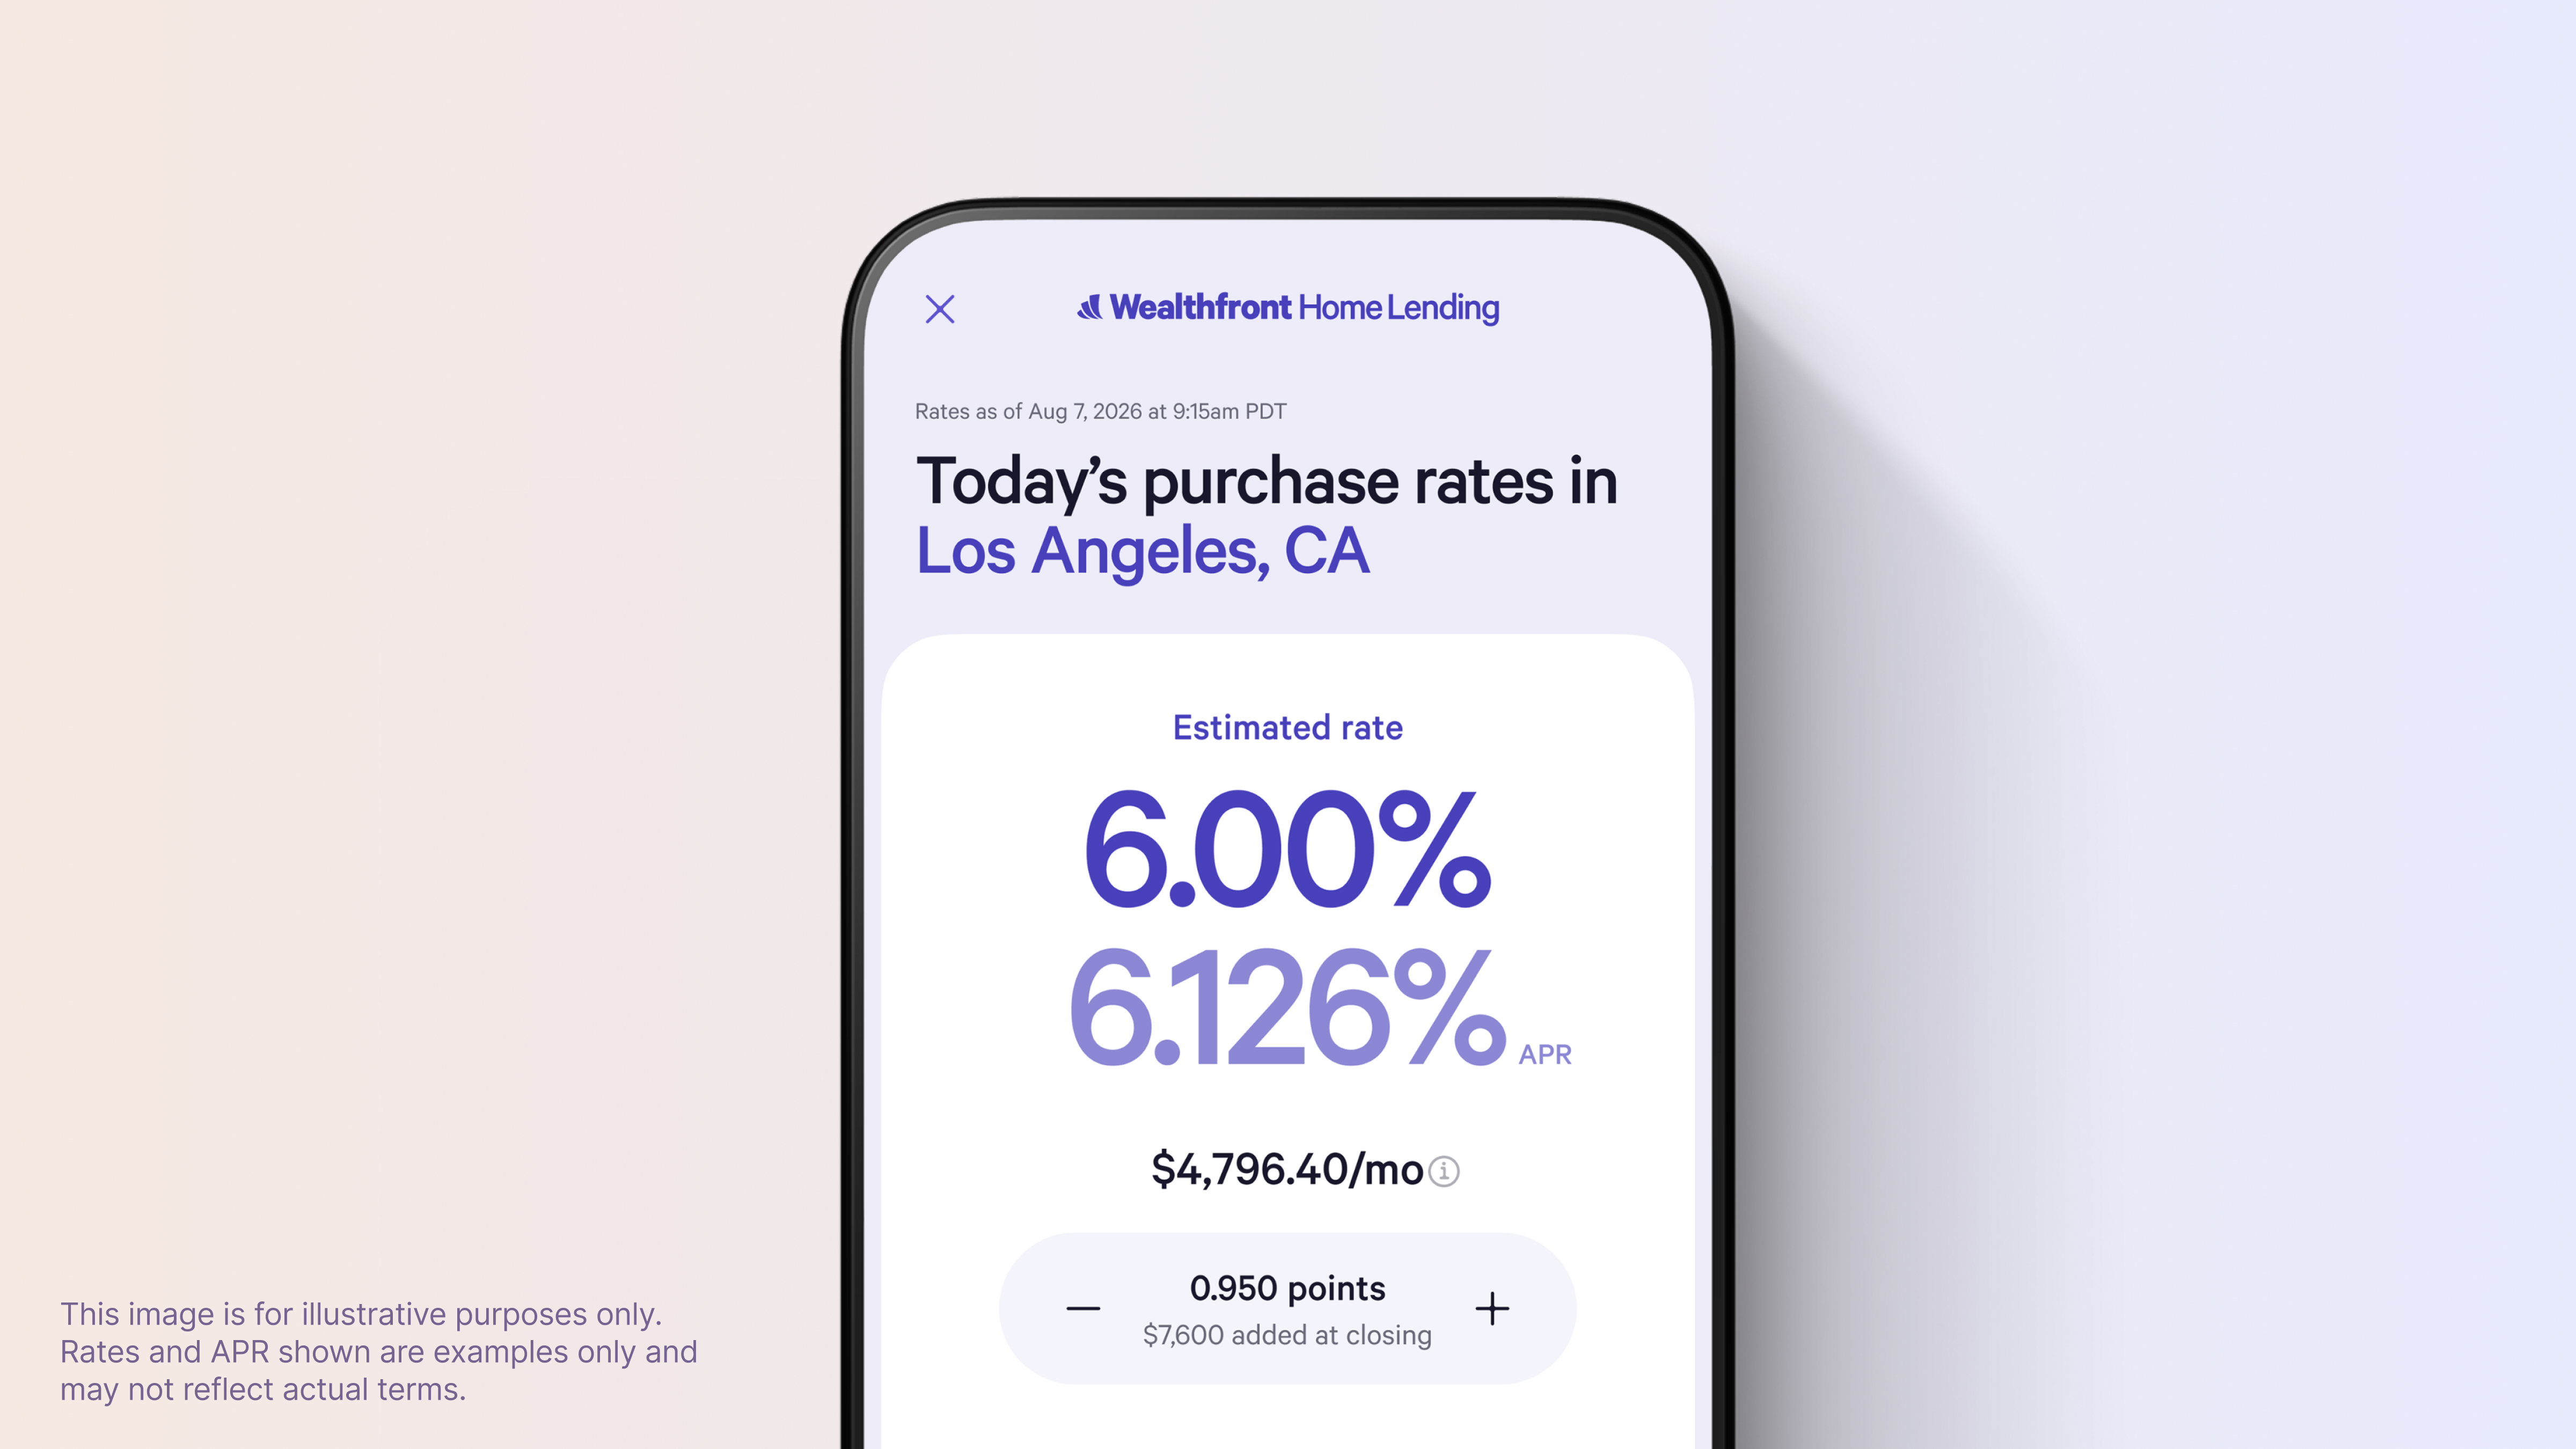
  • Launched general availability of Wealthfront Home Lending in Texas in early May and California in early August. Wealthfront Home Lending is now live in Colorado, Texas, and California, with expansions to Washington, Florida, Illinois, and Oregon planned in the coming months. Wealthfront Home Lending intends to deliver a fully digital home mortgage experience with below market rates. By building a fully digital product, removing unnecessary steps, and automating away most overhead, Wealthfront Home Lending aims to consistently offer rates at least 50 basis points below the national average, an objective it has delivered to clients on average since launch.

  • **Enhanced the digital experience for Wealthfront Home Lending with several automation improvements.**These improvements include the launch of a self-service scenarios tool that allows borrowers to explore custom loan configurations and lock in their rate autonomously online without loan officer intervention, smarter restricted stock unit (RSU) income verification processes, and a streamlined intake flow that pre-fills certain fields incorporating data from both Wealthfront accounts and linked accounts. These product enhancements reflect excellent progress towards Wealthfront Home Lending’s vision of delivering the first mortgage product designed to be handled entirely in a mobile app.

  • **Expanded suite of family wealth management offerings with Custodial Accounts.**The new offering is one of the only custodial accounts designed to lower a child’s future taxes. Wealthfront's software automates a Tax-Gain Harvesting strategy designed to consider the favorable federal tax treatment available to children, helping realize up to $1,350 in tax-free growth each year without requiring a federal tax return filing, increasing their cost basis, thereby reducing the amount of realized gain when the investment is later sold. Thanks to this strategy, when the funds are eventually withdrawn by the child years later, they may have less taxes to pay and can keep more of their returns. Wealthfront’s Custodial Account complements the existing 529 Education Savings Plans as well as Joint and Trust Cash and Investing Accounts in the ongoing expansion of family wealth management offerings.

1 Non-GAAP measure. Wealthfront’s reasons for use of the non-GAAP measure and a detailed reconciliation between the non-GAAP measure and the comparable GAAP amount are included at the end of this document in the section labeled ‘Non-GAAP Reconciliations’.

Conference Call

Wealthfront’s executive management team will host a live audio webcast beginning at 2:00 p.m. Pacific Time (5:00 p.m. Eastern Time) today to discuss the quarter’s financial results and business highlights. The live webcast as well as the earnings press release and earnings presentation can be found at https://ir.wealthfront.com. Following the call, a replay of the webcast will be available on the Wealthfront Investor Relations website.

About Wealthfront

Wealthfront is a tech-driven financial platform helping digital natives turn their savings into wealth. Since pioneering the automated investing category in 2011, the company has grown into a leading consumer fintech that helps clients achieve their financial goals with innovative saving, investing, borrowing, and lending products. Wealthfront’s expanding suite of high-quality, low-cost offerings helps digital natives earn more on their savings, borrow at lower rates, and keep more of their returns. To learn more and get started, visit www.wealthfront.com or download the Wealthfront app.

Prompts

Wealthfront Corporation (ticker WLTH), listed in United States.

ETFs Holding Wealthfront Corporation

ETF Weight in ETF Shares Market value As of
BPAY 3.36% 26,867 $ 293.119K Nov 16, 2026
GABF 1.52% 84,503 $ 755.457K Jun 30, 2026
FDFF 1.22% 62,600 $ 576.546K Aug 31, 2026
SMLL 0.90% 11,487 $ 123.141K Nov 13, 2026
AVSC 0.04% 124,763 $ 1.361M Nov 16, 2026
AVUS 0.00% 6,124 $ 66.813K Nov 16, 2026
BRTR 0.00% 1,619 $ 17.663K Nov 16, 2026
NTRL short 0.00% -14,467 $ 0.00 Nov 16, 2026