Willdan Group, Inc. is a provider of professional, technical, and consulting services to utilities, private industry, and public agencies. The company operates through two financial reporting segments: Energy and Engineering and Consulting. Its Energy segment offers services including energy efficiency consulting, program design and implementation, demand reduction, grid optimization, benchmarking analyses, construction management, and software and data analytics for long-term planning. The Engineering and Consulting segment provides municipal engineering, construction management, traffic and transportation engineering, plan reviews, grant support, and inspections. Willdan serves investor-owned and municipal electric utilities, state and local governments, school districts, and commercial and industrial firms. The company operates a nationwide network of offices across 22 U.S. states, the District of Columbia, the Canadian province of Alberta, and Puerto Rico, with significant business concentrations in California, New York, and Nevada. Founded in 1964, Willdan commenced providing energy efficiency services in 2008 and formed its current holding company structure in 2006.

Summarised from the company's own disclosures, fiscal year ended Feb 2026

Industry Engineering & Construction Homepage willdan.com
Sector Industrials IR page ir.willdangroup.com
Tags
energy efficiency, grid optimization, municipal engineering, traffic engineering, program management, data analytics, renewable energy planning, construction management, public finance, infrastructure consulting
Press page —

Metrics

Valuation  
Market cap $ 1.133B
Market cap (USD) $ 1.133B
P/E 17.89
PEG —
P/BV 3.05
P/S 1.46
P/OCF 15.70
P/FCF 17.57
Dividend yield —
Turnover / mcap —
Returns  
ROE 19.5%
ROI 14.9%
ROIC 12.5%
Profit margin 7.7%
Growth  
Revenue growing Yes
Profits growing Yes
Revenue up 3y Yes
Revenue up 5y No
Earnings growth 3y (net profit CAGR) —
Quality  
Profitable Yes
Margin expanding Yes
Buying back stock No
Diluting (TTM) Yes
Debt/Equity 16.6%
Podcast bulls (TTM) Sign up
Podcast bears (TTM) Sign up
Podcast sentiment (TTM) Sign up
Podcast sentiment % (TTM) Sign up
News sentiment (TTM) 66
Quality score 27.8%
Insiders  
Buys, 1w Sign up
Buys, 1m Sign up
Buys, 1y Sign up
Sells, 1w Sign up
Sells, 1m Sign up
Sells, 1y Sign up

Sign up to see this company's insider trades

Figure FY 2025 FY 2024 FY 2023 FY 2022 FY 2021 FY 2020 FY 2019 FY 2018 FY 2017 FY 2016 FY 2015 FY 2014 FY 2013 FY 2012 FY 2011 FY 2010 FY 2009 FY 2008 FY 2007 FY 2006 FY 2005
Revenue 681.552M 565.798M 510.095M 429.138M 353.755M 390.98M 443.099M 272.252M 273.352M 208.941M 135.103M 108.08M 85.51M 93.443M 107.165M 77.896M — — — 78.339M 67.263M
Net profit 52.557M 22.57M 10.926M -8.448M -8.417M -14.496M 4.841M 10.03M 12.129M 8.299M 4.259M 9.416M 2.63M -17.3M 1.83M 2.72M -5.575M — 2.144M 6.289M -1.381M
Free cash flow 70.697M 63.66M 29.289M -169K 1.304M 41.949M 4.984M 5.463M 8.891M 19.938M 5.627M 12.129M 907K 4.912M -1.078M -588K 1.768M — -917K 3.451M 2.68M

Figure FY 2025 FY 2024 FY 2023 FY 2022 FY 2021 FY 2020 FY 2019 FY 2018 FY 2017 FY 2016 FY 2015 FY 2014 FY 2013 FY 2012 FY 2011 FY 2010 FY 2009 FY 2008 FY 2007 FY 2006 FY 2005
Share price 103.66 38.09 21.5 17.85 35.2 41.7 31.78 34.98 23.94 22.59 8.38 13.49 5.31 2.2 3.9 4.05 2.35 1.65 6.71 10 —
Price performance 12m 1.72 0.77 0.2 -0.49 -0.16 0.31 -0.09 0.46 0.06 1.7 -0.38 1.54 1.41 -0.44 -0.04 0.72 0.42 -0.75 -0.33 — —

Filed figures

Figure Dec 2016 Dec 2017 Dec 2018 Dec 2019 Dec 2020 Dec 2021 Dec 2022 Dec 2023 Dec 2024 Dec 2025
Balance sheet detail
Trade receivables (USD) 30.3M 38.4M 61.3M 57.5M 60.4M 67.2M 60.2M 69.7M 65.6M 64.6M
↳ YoY growth +68.9% +26.9% +59.6% -6.3% +5.0% +11.3% -10.4% +15.7% -5.9% -1.5%
↳ 5y CAGR +12.5% +19.9% +36.0% +34.2% +27.5% +17.3% +9.4% +2.6% +2.7% +1.4%
Borrowings, current (USD) — — — — — 15M 16.9M 8.45M 10.1M 2.5M
Borrowings, non-current (USD) — — — — — 85.5M 90.5M 89M 79.4M 46M
Lease liabilities (USD) — — 544,000 24.5M 22M 17.7M 15.9M 16.7M 18.3M 20.8M
Cash and deposits (USD) 22.7M 14.4M 15.3M 5.45M 28.4M 11.2M 8.81M 23.4M 74.2M 65.9M
Intangible assets (USD) 5.94M 10.7M 44.4M 76.8M 64.3M 52.7M 41.5M 32M 29.4M 35.5M
Right-of-use assets (USD) — — — 22.3M 20.1M 15.2M 12.4M 12.5M 14M 16.6M
Net debt (borrowings + leases - cash) (USD) — — — — — 107M 115M 90.7M 33.6M 3.36M
Cash flow detail
Operating cash flow (USD) 21.6M 11.1M 7.57M 11.6M 47M 9.8M 9.43M 39.2M 72.1M 80.1M
Purchases of property, plant and equipment (USD) -1.66M -2.18M -2.11M -6.64M -5.08M -8.5M -9.6M -9.93M -8.41M -9.39M
Change in receivables (cash effect) (USD) 1.29M -7.41M 3.18M 11.6M -4.23M -14.2M 6.77M -10.3M 5.32M 7.75M
Change in payables (cash effect) (USD) 206,000 3.19M -1.58M -6.29M 7.37M -4.7M -7.84M 4.36M -831,000 7.74M
Interest paid (cash effect) (USD) -179,000 -111,000 -494,000 -4.17M -5.03M -3.55M -5.07M -10.2M -7.52M -5.41M
Income taxes paid (cash effect) (USD) -1.88M -2.75M -3.16M -4.05M -174,000 1.62M 1.12M 3.07M -1.32M -2.34M
Share-based compensation (USD) 1.24M 2.77M 6.26M 12.1M 16.1M 16.6M 8.37M 5.32M 7.39M 11.8M
Operating cash flow before change in receivables (USD) 20.3M 18.5M 4.39M -6,000 51.3M 24M 2.67M 49.5M 66.8M 72.3M
Free cash flow (OCF - PPE - intangibles) (USD) 19.9M 8.89M 5.46M 4.98M 41.9M 1.3M -169,000 29.3M 63.7M 70.7M
Income detail
Total comprehensive income (USD) — 12.1M 10M 4.45M -14.6M -7.97M -8.41M 10.3M 22.9M 52.6M
Comprehensive income to owners (USD) — — — — -14.6M -7.97M -8.41M 10.3M 22.9M 52.6M
Provision for credit losses (USD) 216,000 -189,000 470,000 1.05M 1.33M 102,000 243,000 826,000 740,000 308,000
Credit cost ratio (credit losses / average receivables) (%) 0.9% 0.6% 0.9% 1.8% 2.3% 0.2% 0.4% 1.3% 1.1% 0.5%
Reported Mar 10, 2017 Mar 6, 2020 Mar 6, 2020 Mar 6, 2020 Mar 10, 2023 Mar 10, 2023 Mar 10, 2023 Mar 8, 2024 Mar 7, 2025 Feb 27, 2026

Sign up to see institutional holdings

Sign Up

Podcast Mentions

Sign up to see podcast mentions and sentiment

Sign Up

Willdan Group Reports Third Quarter Results Bull 4 Bear 0 Results

ANAHEIM, Calif. –November 5, 2026 – Willdan Group, Inc. (“Willdan”) (Nasdaq: WLDN) today announced its financial results for the third quarter ended October 2, 2026.

Third Quarter 2026 Highlightsa

● Contract revenue of $214.5 million, up 17.9%.

● Net revenuec of $112.2 million, up 18.1%.

● Net income of $11.9 million, down 13.6%.

● Adjusted EBITDAc of $28.3 million, up 22.4%.

● GAAP Diluted EPS of $0.76, down 15.6%.

● Adjusted Diluted EPSc of $1.20, down 0.8%.

The nine months ended fiscal 2026 had one fewer week than the nine months ended fiscal 2025, thus normalized results are also presented.

Nine Months Year to Date 2026 Highlightsa, b

● Contract revenue of $600.7 million, up 18.3% (up 21.3% normalized).

● Net revenuec of $321.8 million, up 16.9% (up 19.9% normalized).

● Net income of $44.7 million, up 32.2% (up 35.6% normalized).

● Adjusted EBITDAc of $79.4 million, up 33.5% (up 36.9% normalized).

● GAAP Diluted EPS of $2.89, up 27.9%.

● Adjusted Diluted EPSc of $4.18, up 25.1%.

CEO Comments

“We delivered strong operational performance in the third quarter of 2026,” said Mike Bieber, Willdan’s President and Chief Executive Officer.

November 5, 2026|Press Release

The Willdan Newsroom

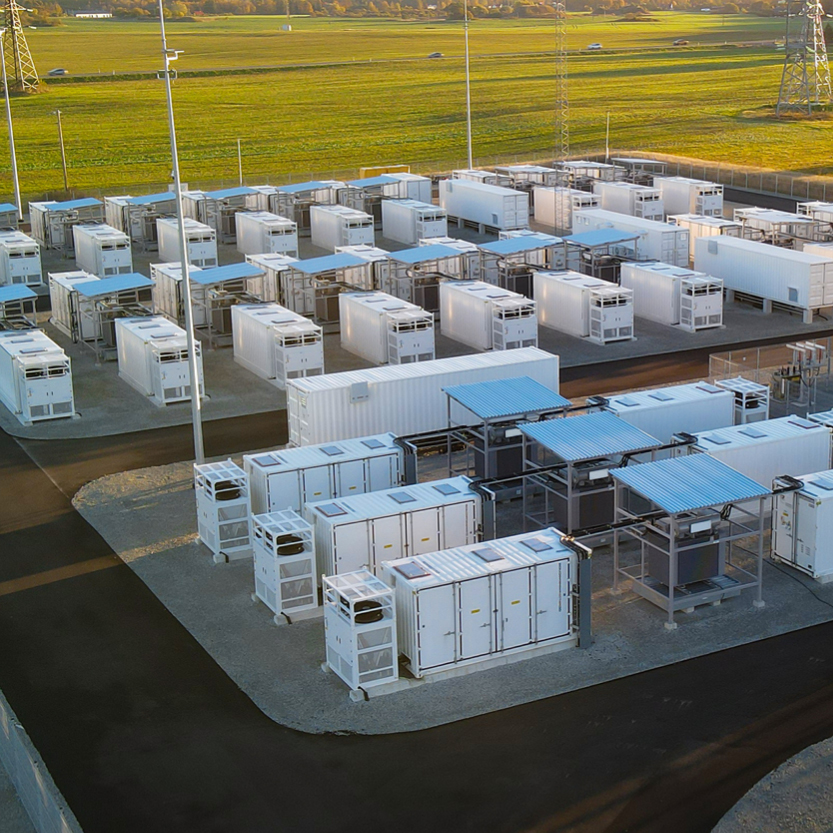
ANAHEIM, Calif.—(BUSINESS WIRE )—Willdan Group, Inc. (NASDAQ: WLDN) announced today that it has received limited notices to proceed for new substation and battery energy storage system (BESS) projects that add 643 MW in capacity.

The limited notices to proceed include engineering and procurement for the following projects:

  • Transformer Substation for a 100 MW Datacenter in CA
  • 75 MW BESS in TX
  • Transformer Substation for 300 MW of Renewables in TX
  • Transformer Substation for 88 MW of Renewables in IL
  • Transformer Substation for 80 MW of Renewables in IL

 “These awards reflect the expanding investment in energy infrastructure across the country,”

— said Mike Bieber, Willdan’s CEO.

“Willdan’s growing depth of expertise in high voltage design and construction management is in high demand as the information economy seeks solutions to grid constraints.”

About Willdan
Willdan is a technical services company focused on energy and infrastructure solutions. These solutions include energy planning and analytics, consulting, software, public finance, engineering, and program implementation. Willdan serves utilities, state and local governments, and commercial customers in the United States and Canada. For additional information, visit Willdan's website at www.willdan.com or follow Willdan on LinkedIn and Facebook .

Forward-Looking Statements 
Statements in this press release that are not purely historical are forward-looking statements within the meaning of the Private Securities Litigation Reform Act of 1995. It is important to note that Willdan’s actual results could differ materially from those in any such forward-looking statements. Factors that could cause actual results to differ materially include, but are not limited to, the risk factors listed from time to time in Willdan’s reports filed with the Securities and Exchange Commission, including, but not limited to, the Annual Report on Form 10-K filed for the year ended January 2, 2026. Willdan cautions investors not to place undue reliance on the forward-looking statements contained in this press release. Willdan disclaims any obligation to, and does not undertake to, update or revise any forward-looking statements in this press release.

November 5, 2026|Press Release

The Willdan Newsroom

ANAHEIM, Calif.—(BUSINESS WIRE )—Willdan Group, Inc. (NASDAQ: WLDN) announced today that it has been selected by the New York Power Authority (NYPA) as one of the 26 service providers for the Energy Services Program. The providers will service the program under ten-year value contracts, with projects assigned to qualified providers as needed. Willdan’s services may include energy audits, retro-commissioning, design-bid-build, design-build, and other energy-related services for NYPA customers. Potential customers span education, healthcare, government, housing, transportation, and other public and commercial facilities.

“Willdan is honored to be selected and to have supported energy-saving projects through NYPA for nearly two decades,”

— said Mike Bieber, Willdan’s CEO.

“NYPA has become one of Willdan’s largest customers. This program is expected to leverage our technical services and energy infrastructure capabilities to support New York State’s clean energy transition.”

About NYPA
The New York Power Authority is the largest state public power organization in the nation, operating 17 generating facilities and more than 1,550 circuit-miles of transmission lines. More than 80 percent of the electricity NYPA produces is clean renewable hydropower. NYPA finances its operations through the sale of bonds and revenues earned in large part through sales of electricity. For more information visit www.nypa.gov  and follow us on LinkedIn , Twitter , Facebook , Instagram , and Substack .

About Willdan
Willdan is a technical services company focused on energy and infrastructure solutions. These solutions include energy planning and analytics, consulting, software, public finance, engineering, and program implementation. Willdan serves utilities, state and local governments, and commercial customers in the United States and Canada. For additional information, visit Willdan's website at www.willdan.com or follow Willdan on LinkedIn and Facebook .

Forward-Looking Statements 
Statements in this press release that are not purely historical are forward-looking statements within the meaning of the Private Securities Litigation Reform Act of 1995. It is important to note that Willdan’s actual results could differ materially from those in any such forward-looking statements. Factors that could cause actual results to differ materially include, but are not limited to, the risk factors listed from time to time in Willdan’s reports filed with the Securities and Exchange Commission, including, but not limited to, the Annual Report on Form 10-K filed for the year ended January 2, 2026. Willdan cautions investors not to place undue reliance on the forward-looking statements contained in this press release. Willdan disclaims any obligation to, and does not undertake to, update or revise any forward-looking statements in this press release.

Prompts

Willdan Group, Inc. (ticker WLDN), listed in United States.

ETFs Holding Willdan Group, Inc.

ETF Weight in ETF Shares Market value As of
ASCE 1.62% 24,089 $ 1.905M Jun 30, 2026
NDOW 0.49% 4,343 $ 343.531K Jun 30, 2026
ORR 0.47% 24,583 $ 1.72M Nov 18, 2026
ESSC 0.21% 1,084 $ 74.287K Jul 31, 2026
SEIS 0.13% 9,760 $ 772.016K Jun 30, 2026
PSC 0.13% 37,712 $ 2.983M Jun 30, 2026
CCSO 0.12% 689 $ 48.32K Nov 17, 2026
AVSC 0.07% 29,624 $ 2.078M Nov 16, 2026
RESM 0.05% 24 $ 1,898.40 Jun 30, 2026
DFAS 0.02% 105,290 $ 7.358M Nov 12, 2026
MSSM 0.01% 518 $ 45.558K Aug 31, 2026
DFAT 0.01% 25,639 $ 1.792M Nov 12, 2026
DFSU 0.01% 1,788 $ 124.945K Nov 12, 2026
DFAC 0.00% 55,710 $ 3.893M Nov 12, 2026
DCOR 0.00% 17,590 $ 1.229M Nov 12, 2026
DXUV 0.00% 1,936 $ 135.288K Nov 12, 2026
DFAU 0.00% 3,014 $ 210.618K Nov 12, 2026
DFUS 0.00% 4,477 $ 312.853K Nov 12, 2026
EBI 0.00% 16 $ 1,407.20 Aug 31, 2026
AVUS 0.00% 2,152 $ 150.92K Nov 16, 2026