Share 7 minute read Terrorism, war, and floods have kept Vodafone’s Senior Manager of Satellite Engineering Cynthia Osuigwe busy over the past couple of years. The technologies that can broaden and strengthen both fixed and mobile communications…
Share
7 minute read
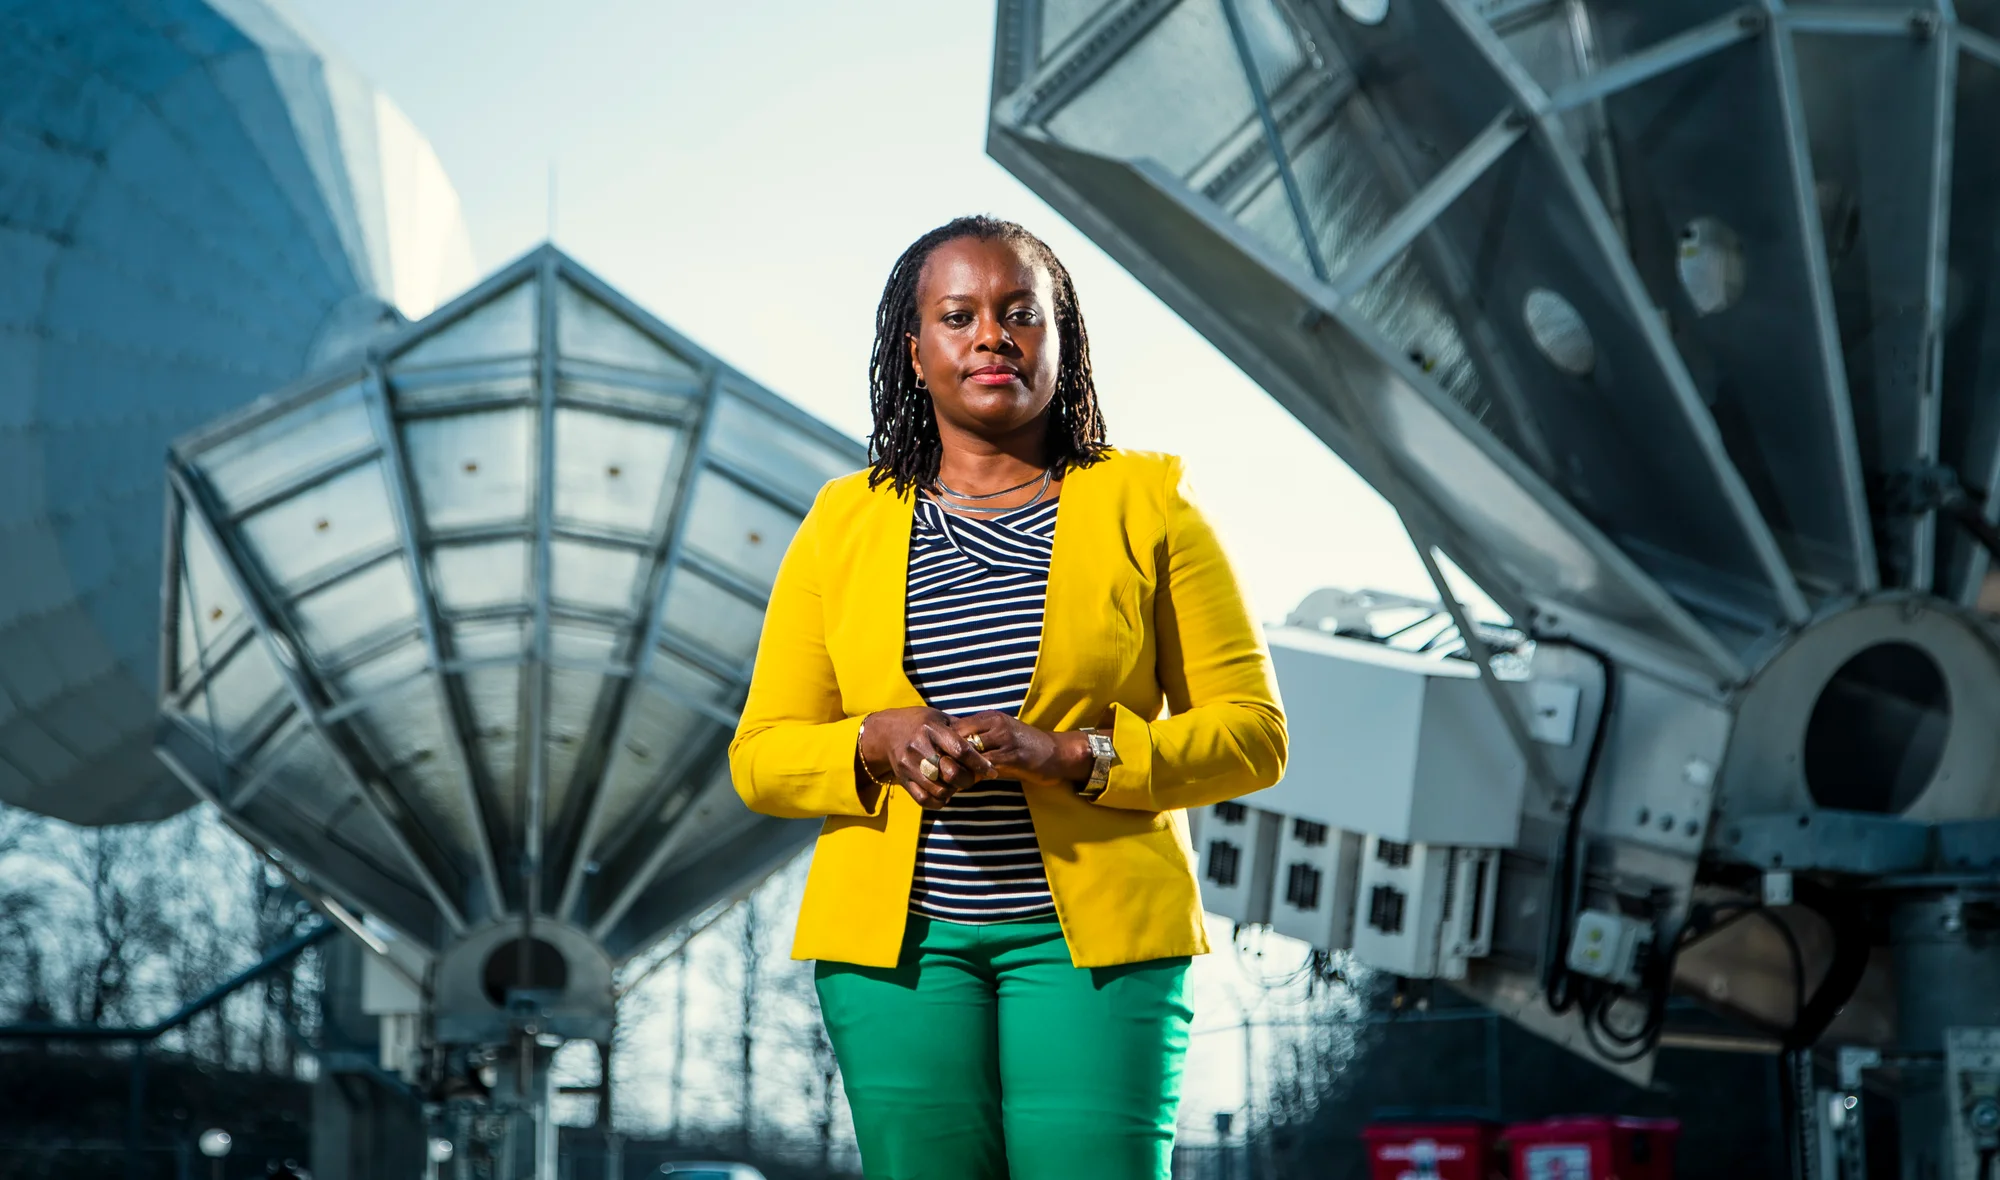
Terrorism, war, and floods have kept Vodafone’s Senior Manager of Satellite Engineering Cynthia Osuigwe busy over the past couple of years. The technologies that can broaden and strengthen both fixed and mobile communications are at the heart of Cynthia’s role. And it means more businesses and public sector organisations than ever are turning to Vodafone for added resilience as well as emergency connectivity in disaster struck locations using its satellite services.
Sometimes terrestrial connections are not enough. Where communities and businesses are unconnected, underserved and unserved, Vodafone’s satellite communications complement its land-based networks. It gives customers alternative connectivity as either a primary or secondary backup service, allowing Vodafone to lead in offering almost ubiquitous coverage.
Through wholesale agreements with operators of GEO (Geostationary Earth Orbit) satellites, and more recently, ones operating MEO (Medium Earth Orbit) satellites, Vodafone can offer fixed enterprise-grade satellite mobile backhaul (links between base stations and the core network) and satellite connectivity globally to the private and public sectors. And it’s thanks to engineers like Cynthia.
In Vogue
Speaking from Vodafone’s main earth station – a centre providing interconnections between satellites and ground-based communications networks (also known as a teleport) – in Oxfordshire, UK, Cynthia describes how satellite technology is back in vogue.
The upswing in demand for faster universal connectivity is presenting Vodafone with new opportunities both in space and here on earth. First, there’s a post-covid resumption in freight transport and with it the need to track valuable cargo, and secondly, greater political support is helping to fund membership of the digital society for more remote communities.
Also, the emergence of LEO (Low Earth Orbit) satellite technology is disrupting the current ecosystem and promises many benefits that can help overcome the challenge of meeting the ever-increasing customers data usage demands in tricky terrains unsuited to physical fibre optic cables. These benefits include higher throughput and greater bandwidth, lower latency, competitive pricing, a wider pool of end user terminals, and the flexibility to switch seamlessly between satellites.
Humanitarian Support
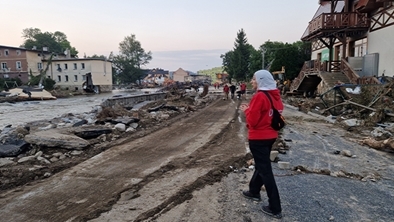
Whilst recent LEO satellite launches are grabbing the headlines, Cynthia is quick to point out that devasting environmental incidents such as the catastrophic floods in Europe in 2021, have also brought the technology to the fore. In a humanitarian or environmental disaster situation, satellite connectivity is ideal for allowing governments and NGO’s to quickly provide connectivity. Alongside direct communications, satellite connectivity can also enable relief organisations to survey aerial images across a wide area to best direct resources and relief efforts.
For example, the satellite engineering team, in collaboration with the Vodafone Foundation, explored and proposed a satellite-based solution to provide emergency connectivity following the recent earthquake in Turkey.
Cynthia explained: “Traditionally, we’ve provided satellite connectivity to firms and public sector organisations wishing to connect far flung offices and facilities back to their headquarters. More recently, governments recognise that satellites can help to bring remote places online, where the inhospitable terrain makes it almost impossible to construct a ground-based network.
“This might be in response to a disaster or simply connecting remote communities previously cut off from the Internet. Governments and large private companies now consider satellite a shrewd backup in support of terrestrial communications.”
Alongside government and NGO support, Vodafone is looking at opportunities to strengthen its existing strategic partnerships with satellite operators as well as forge new ones.
Space-based Network
In 2020, Vodafone invested in AST SpaceMobile having seen the potential of its planned low-latency, LEO space-based network, which aims to be the first in the world to connect directly to standard smartphones. Other LEO satellites either require specialist devices and dishes or will be limited initially to offering emergency text messaging and voice calls when in line of sight of a satellite.
Vodafone’s research and development team is working closely with AST SpaceMobile experts in Midland, Texas, on its test satellite, BlueWalker 3 (BW3), which successfully launched towards the end of last year.
“Once fully operational, it will allow Vodafone to provide direct-to-mobile phone coverage for customers in regions with little or no terrestrial signal,” Cynthia stated.
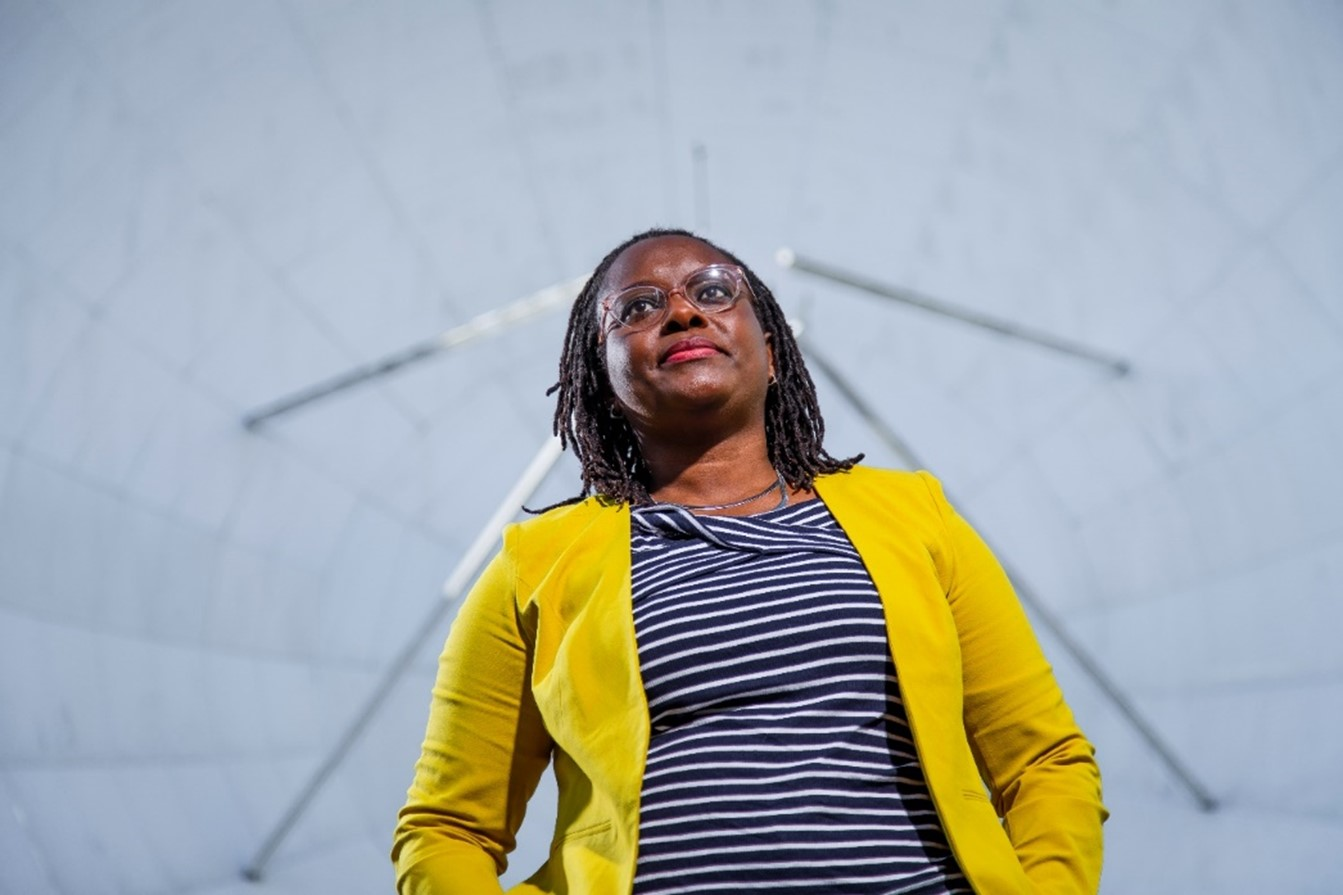
Vodafone is also ideally positioned to capitalise on the surge in demand for managed satellite services by enterprise customers, like utility companies, and the launch of new technologies. It is drawing on its in-house engineering expertise, partly inherited following the acquisition of Cable & Wireless Worldwide in 2012, which also included Vodafone’s earth station tucked away in a disused quarry in Oxfordshire.
Vodafone’s pedigree in satellite technology grew from there, and in 2018, Vodafone secured an opportunity to be one of the first companies to evaluate global satellite operator, Telesat’s Lightspeed LEO capability. The Vodafone satellite team, through a long term relationship with the University of Surrey, used its 5G test bed network in collaboration with Telesat to perform the World’s First 5G Backhaul Demo over LEO Satellite (vodafone.com)
.The demonstration supported video chatting, web browsing and simultaneous streaming of up to 8K video.
Cynthia also played a key part in establishing a secondary site to Vodafone’s main earth station which is situated at a third-party teleport in Warwickshire. This site is is one of many belonging to partners dotted around the globe, enabling Vodafone to provide almost ubiquitous coverage over land, sea and in the air to enterprise and governmental customers. Traditionally, the end user would use a fixed VSAT (Very Small Aperture Terminal) to receive the service, however, advances in technology has seen parabolic and flat panel antenna designs come on to the market in support of applications requiring mobility such as cruise ships.
Internet of Space
The strength of Vodafone’s partnerships means it has access to third party services to offer Internet of Things-type services over satellite connectivity. “Whether you are in utilities, banking, retail, oil and gas, environment monitoring or farming, having continuous access to an IoT service is essential,” explained Cynthia.
“But sometimes, business takes you to remote, rural or mountainous locations where fixed line or cellular access is limited or absent. Satellite IoT can help connect these areas and provide reliable back-up for business-critical uses.”
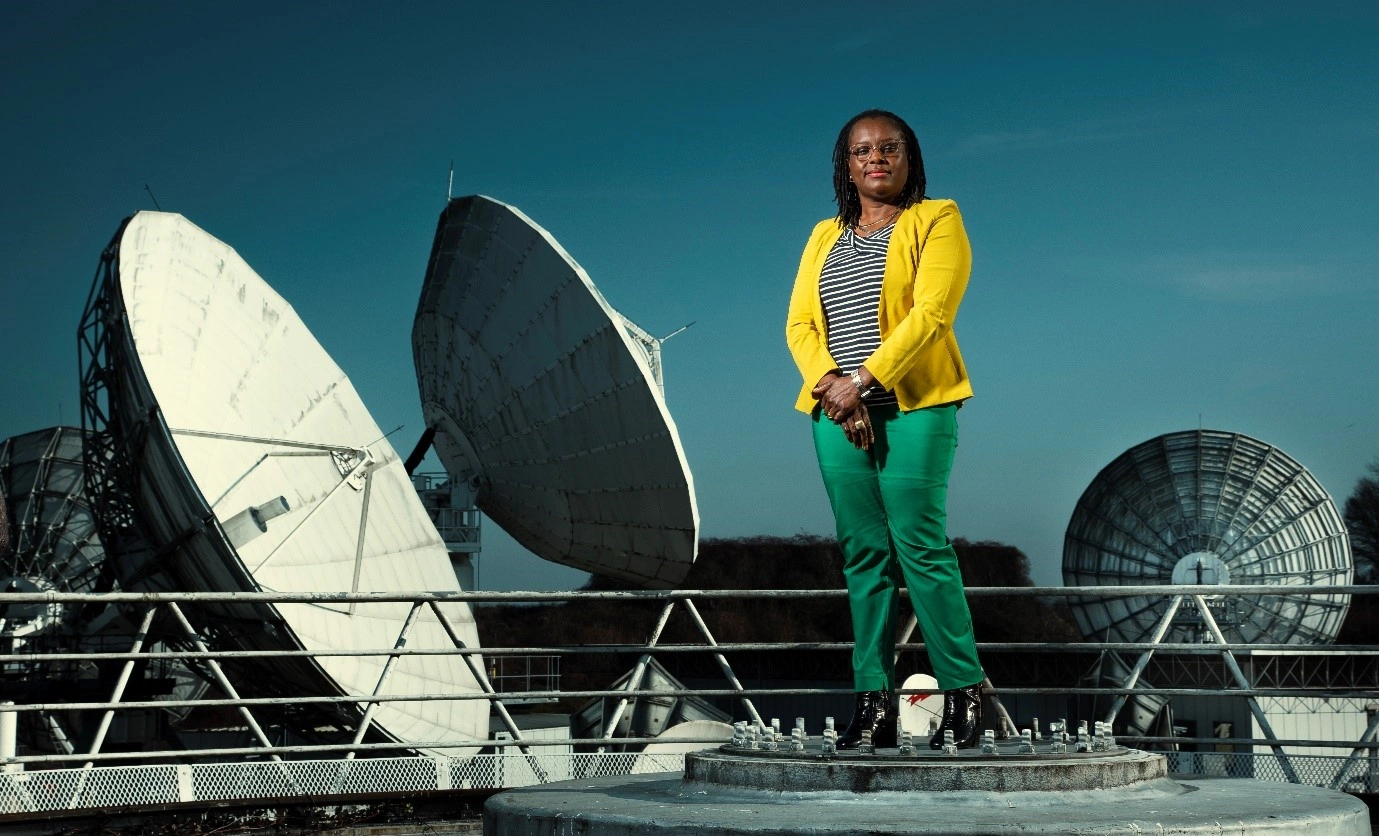
When Cynthia isn’t watching the latest rocket launches taking LEO satellites into the stratosphere, she is leading the continual transformation of Vodafone’s satellite engineering prowess. Cynthia is also responsible for the lifecycle management of the sixteen antennas at the earth station connected to GEO satellites which orbit the earth at more than 35,000 kilometres. These are the workhorses of satellite technology and can withstand tropical storms making them ideal for connecting facilities such as oil refineries across Africa and South America.
Solar Flares
Despite being in the vicinity of these dishes – some of which measure up to 16 metres in diameter – Cynthia is never without her terrestrial mobile phone. “We are always on hand to help customers and reassure them of continuity of service. An increase in solar flares or extreme cold can, as with other telecommunications networks, interfere with satellites, and it’s important to put our customers minds at ease and reroute important traffic if needed. Thankfully, solar activity is cyclical, and by planning for it, we can mostly mitigate any downtime.”
These days, Cynthia’s team is receiving more inquiries than ever across Vodafone serving several local markets. Her team manages all satellite connectivity demands and produces designs to ensure customers receive the best possible satellite connectivity solution depending on their needs.
With a university degree in electronics and telecommunications engineering, Cynthia’s career, which started in Nigeria as a service engineer fixing consumer electronics, has taken her on many different paths, helping her to develop the qualities needed to now lead Vodafone’s satellite engineering arm based in the UK.
Prior to this, on joining Vodafone in 2017, Cynthia oversaw the successful transformation of Vodafone’s satellite operations and secured ISO 27001 accreditation (the international standard for security management) for the earth station. Coupled with her work in the UK civil service and private sectors, Cynthia is well qualified to advise a diverse set of customers.
“It is incredible to think of the advances in satellite technology from when I was a telecom engineer in 2000 to now. Vodafone’s largest antenna built in 1981, and decommissioned in 2018, was used to provide a 256 kilobit-per-second circuit to Hong Kong. More recently, we can offer up to 150 megabit-per-second speeds on GEO satellites, and now LEO promises gigabit connectivity to almost anywhere in the world,” Cynthia explained.
Meteoric Rise
Despite the meteoric rise in satellite hype, Cynthia keeps her feet firmly on the ground. Outside of work, she spends her time parenting her teenage sons and mentoring young women and students who want to start a career in technology. She also readily admits she would make a great neighbour for anyone with issues with their satellite dish.
Africa
Connectivity
Digital Society
Health
Everyone.connected
People
Infrastructure
Innovation
Smartphone
Networks
Partnerships
Rural connectivity
Satellite
SDGs
Technology
More stories

20 Oct 2026
Technology
From connected to intelligent: How AI is transforming Vodafone's network
6 minute read
AI
Connectivity
Networks
AR / VR
19 Oct 2026
Technology
Four European operators sign Letter of Intent to explore a joint bid for Mobile Satellite Services spectrum and advance Direct-to-Device services
6 minute read
Corporate and Financial
Connectivity
Networks
Partnerships
Satellite

14 Oct 2026
Technology
Vodafone launches Express Capacity to quickly meet demand for data centre connectivity
3 minute read
Cloud
AI
Data
Vodafone Business
Connectivity
Europe
Networks
Our company
Our company
Investors
Investors
Vodafone websites
Vodafone websites
Share price
Share price
118.60 GBX
-0.8 (-0.67%)
21 Oct 2026 15:37 GMT
15.81 USD
-0.065 (-0.41%)
21 Oct 2026 15:47 EDT
Connect with us
© 2026 Vodafone Group
Vodafone Group Plc. Registered Office: Vodafone House. The Connection, Newbury, Berkshire RG14 2FN. Registered in England No 1833679
We use cookies to improve your experience on this site. Read our policy

Back to top
This website uses and stores cookies on your device to enhance site navigation, provide you with a better browsing experience as well as analyze site usage. By clicking "Accept All Cookies" or Modifiying the Cookie setting you can continue to browse the site, and you are consenting to cookies in the following categories, functional and Strictly Necessary Cookies as detailed in our Cookie Policy. The option "Reject All Cookies" will allow only the strictly necessary mandatory cookies which are essential to run the page. All other optional cookies are deactivated.
Cookies Settings
Reject All Accept All Cookies
Privacy Preference Center
When you visit any website, it may store or retrieve information on your browser, mostly in the form of cookies. This information might be about you, your preferences or your device and is mostly used to make the site work as you expect it to. The information does not usually directly identify you, but it can give you a more personalized web experience. Because we respect your right to privacy, you can choose not to allow some types of cookies. Click on the different category headings to find out more and change our default settings. However, blocking some types of cookies may impact your experience of the site and the services we are able to offer.
More information
Allow All
Manage Consent Preferences
Strictly Necessary Cookies
Always Active
These cookies are necessary for the website to function and cannot be switched off in our systems. They are usually only set in response to actions made by you which amount to a request for services, such as setting your privacy preferences, logging in or filling in forms. You can set your browser to block or alert you about these cookies, but some parts of the site will not then work. These cookies do not store any personally identifiable information.
Cookies Details
Performance Cookies
Performance Cookies
These cookies allow us to count visits and traffic sources so we can measure and improve the performance of our site. They help us to know which pages are the most and least popular and see how visitors move around the site. All information these cookies collect is aggregated and therefore anonymous. If you do not allow these cookies we will not know when you have visited our site, and will not be able to monitor its performance. Where you have provided your consent, our website uses Adobe Target, a web analytics and testing service. For this purpose, cookies are installed on your browsers. These cookies will collect data, such as browser and device information, your interaction with the website, your IP address, visited websites, and date and time of server request. This information is used for the purpose of evaluating your use of the website, to perform testing and optimization activities (including A/B testing), and to deliver personalized content dynamically during your visit. You can withdraw your consent at any time with effect for the future by disabling cookies on our website under "Manage your Cookies".
Cookies Details
Functional Cookies
Functional Cookies
These cookies enable the website to provide enhanced functionality and personalisation. They may be set by us or by third party providers whose services we have added to our pages. If you do not allow these cookies then some or all of these services may not function properly.
Cookies Details
Targeting Cookies
Targeting Cookies
These cookies may be set through our site by our advertising partners. They may be used by those companies to build a profile of your interests and show you relevant adverts on other sites. They do not store directly personal information, but are based on uniquely identifying your browser and internet device. If you do not allow these cookies, you will experience less targeted advertising.
Cookies Details
Back Button
Cookie List
Search Icon
Filter Icon
Clear
Apply Cancel
Consent Leg.Interest
checkbox label label
checkbox label label
checkbox label label
Confirm My Choices











 _High-resolution versions of these images can be downloaded from the
 Egypt
 مصر
 Ethiopia
 Kenya
 Moçambique
 Lesotho
 South Africa
 RD Congo
 Tanzania (EN)
 India
 Türkiye
 Shqipëri
 Česká Republika
 Deutschland
 Ελλάδα
 Ireland
 Nederland
 United Kingdom
 Portugal
 România