Download as PDF March 31, 2026 CHEYENNE, Wyo., March 31, 2026 /PRNewswire/ -- U.S. Gold Corp. ("US Gold" or the "Company") (NASDAQ: USAU) is pleased to announce the results of its Feasibility Study (the "FS") for the development of its wholly-owned…
Download as PDF
March 31, 2026
CHEYENNE, Wyo., March 31, 2026 /PRNewswire/ -- U.S. Gold Corp. ("US Gold" or the "Company") (NASDAQ: USAU) is pleased to announce the results of its Feasibility Study (the "FS") for the development of its wholly-owned CK Gold Project ("CK" or the "Project"), located in southeast Wyoming 20-mile from Cheyenne.
U.S. Gold Commentary on 2026 CK Gold Project Feasibility Study Highlights:
- Solid Project returns: After-tax net present value ("NPV") 5% of $632 million ("M") and 27% after-tax internal rate of return ("IRR") using base case metal prices of $3,250 per ounce ("/oz") gold ("Au"), $4.50/lb copper ('Cu"), and $40/oz silver ("Ag"); After-tax NPV(5) of $1.30 billion ("B") and 45% after-tax IRR using recent spot metal prices of $4,500/oz Au, $5.50/lb Cu and $70/oz Ag.
- Fully permitted: All required permits to begin construction are in-hand. $5M reclamation bond in place to cover first year of planned construction.
- Initial 11-yr mine-life: Current fully permitted mine plan focused on 1.6 million1 ("Moz") of contained gold equivalent ("AuEq") ounces, as stated in Mineral Reserves.
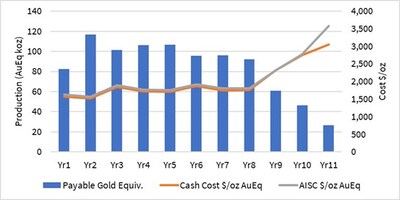
- Attractive production profile focused on early higher grades: After 1 year of ramp up, average sales of 102 thousand ounces ("koz") AuEq from year 2 to 8, with average life of mine ("LOM") sales of 85 koz AuEq at total cash costs of $1,748/oz AuEq. Ore body shows low LOM strip ratio of 0.89:1 with minimal pre-stripping.
- Simple, robust, financeable Project: Total initial capital cost of $394 M (excludes $28 M of preproduction owners' cost and includes contingency of $47 million) and sustaining capital of $35 M over the LOM; well understood regulatory jurisdiction with stability and an exceptional location for infrastructure, manpower and support services.
- Competitive Project metrics3**:** Base case post tax NPV-to-capex ratio of 1.6 and payback of 2.5 years; spot price NPV-to-capex ratio and payback improve to 3.3 and 1.6 years, respectively.
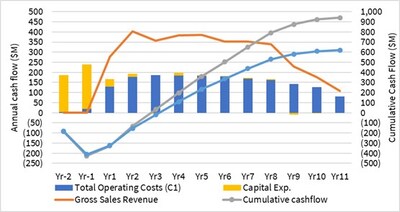
- Strong free cash-flow profile in early years2**:** Excellent profitability after initial ramp up at beginning of mine life; Year 2-8 average after-tax free cash flow of $160 M; continuation into additional resources and further anticipated resource extensions at depth.
- **Simple, compact Project layout and processing: ~**80-acre open pit is the source of ore and waste rock to mine facilities all within a 1.5-mile haul. The ore is fed to a primary crusher or low-grade stockpile. Primary crushed ore is ground in a semi-autogenous grinding (SAG) - ball mill comminution circuit prior to flotation, regrind of rougher concentrate before final flotation to produce a clean gold rich copper concentrate. Dry-stack tailings enhance the most efficient use of water.
- Significant benefits to State and local communities: Excellent local support for Project development built upon years of engagement and 2.1% royalty payments earmarked for grades K-12 education; an average of 198 direct permanent jobs are expected to be created at CK.
- No cultural impacts revealed: The surrounding land was settled as the railroad developed 3-miles to the south of the Project in the 1860's. The State mineral and surface leases are surrounded by ranch land currently operated by the fifth generation of the original owners. Archaeological surveys have identified no significant artifacts or sites in the Project area.
- Significant scarcity value: CK is one of the few fully permitted large-scale precious metals projects in the U.S. at the Feasibility Study level and is actively being advanced.
- Visibility on short and long-term growth: Significant measured and indicated resource material has been excluded from the initial mine plan to avoid impacting a dry drainage channel. With known resources at depth, mine expansion at depth and along strike will be the focus of future plans and expansion to the permitted activity; CK is one of the few permitted undeveloped gold and copper resources in the U.S. with a discernable pathway to expansion.
- Aggregate Potential: Additional revenue from aggregate production has largely been excluded from the feasibility study. Anticipate increased aggregate sales into the Rocky Mountain region as the gold and copper mine progresses.
- Reclamation Savings: Potential to reduce reclamation costs as the city and state consider the use of the ultimate pit as recreation and water reservoir.
- Excellent timing: With the FS now complete and full permits in hand, the Project is positioned to advance in a current gold–copper-silver price environment that is one of the strongest in history, supported by favorable U.S. sentiment toward domestic production and mineral security tailwinds.
(1) Gold equivalent calculated using mineral reserve reporting criteria metal prices: $2,100/oz Au, $4.10/lb Cu and $27/oz Ag See this news release for metal grades, recoveries and tons.
(2) See Cautionary Note Regarding Non-GAAP Financial Measures.
(3) NPV-to-capex ratio calculated as after-tax Project NPV5% divided by total initial capital cost.
George Bee, President, CEO and Director of US Gold commented: "The Feasibility Study is the culmination of 5-years of work to engineer and permit a U.S. domestic project ready for immediate development. CK is one of the most compelling, resilient, and capital-efficient copper-gold-silver projects in the U.S. ready for development. The FS outlines a technically simple, low risk, phased development with outstanding economics, including a rapid 2.5-year payback, strong early free cash flow profile, and a relatively modest capex and reasonable NPV-to-capex ratio. Importantly, the FS is delivered with all permits in hand at an opportune time. While the FS reflects an 11-year plan followed by closure, it represents only the beginning for CK. The Project also hosts a considerable mineral resource beyond the current mine, offering expansion opportunities that remain open, and a multi-decade opportunity to provide rock aggregate to the local market and beyond.
The feasibility-level engineering, metallurgy, and capital and operating costing have been conducted with a view to continuing into a smooth transition to detailed engineering and Project execution once Project financing is secured. With permits already in place, delivery of the FS allows interested parties to assess the Project from a number of avenues for Project financing including debt, equity, off-take and other vehicles to secure the initial capital. With a manageable capex quantum, relatively low execution risk, advancing CK provides the Company with the ability to generate long-term value for our shareholders, the State or Wyoming, and the communities in the vicinity of the Project. CK is expected to support an average workforce of approximately 198 direct high-quality, long-term jobs over the life-of-mine and beyond. We look forward to providing further updates as the Project progresses with financing and construction in 2026."
US Gold will host a conference call and webcast to discuss the FS on Wednesday, April 1, 2026 at 4:00 PM Eastern Time / 1:00 PM Pacific Time, featuring a presentation from the senior management team and a live Q&A session. A recording will be available on US Gold's corporate website. To register for the webcast, please use the following link (call details are listed below): US Gold Feasibility Study Webcast
Feasibility Study Summary
The FS confirms robust economics for a low-cost, large-scale, conventional open pit feeding a simple copper-gold concentrator process plant, with competitive operating costs and high rate of return. The FS outlines total production of: 931 koz AuEq over an 11-year operating mine life (followed by two years of closure), resulting in an average LOM annual production profile of 85 koz AuEq per annum at an AISC of $1785/oz AuEq. The Project generates an after-tax NPV5% of $632 M with an after-tax IRR of 27% at base case gold, copper and silver prices of $3,250/oz, $4.50/lb and $40/oz, respectively.
The Company retained Halyard-Micon International, Inc. ("Halyard") as lead engineer, along with other engineering consultants, to complete the FS and prepare a technical report summary in accordance with U.S. Securities and Exchange Commission's Regulation S-K, Subpart 1300 disclosure requirements for registrants with material mining operations ("S-K 1300"). The FS is derived from updated mineral resource estimate effective December 12, 2025. The effective date of the FS is March 30, 2026, and a technical report summary prepared in accordance with S-K 1300 will be available on the Company's website and will be filed with the Company's next Annual Report on Form 10-K to be filed with the U.S. Securities and Exchange Commission.
CK Feasibility Study Highlights1
|
|
| Mining |
|
| Total Tonnage Mined (k ton) |
140,597 |
| Total Tonnage Moved (includes stockpile and waste rehandle) |
163,546 |
| Total Ore Mined (k ton) |
74,527 |
| Strip Ratio (Waste: Ore) |
0.89 |
| Operating Mine Life (years) |
11 |
| Contained |
|
| Contained Gold (koz Au) |
1,015 |
| Contained Copper (lbs Cu) |
259,880 |
| Contained Silver (koz Ag) |
3,031 |
| Contained Gold Equivalent (Moz AuEq) |
1.4 |
| Production |
|
| Plant Metal Recovery |
|
| LOM Average Gold Recovery (%) |
71.5 % |
| LOM Average Copper Recovery (%) |
80.6 % |
| LOM Average Silver Recovery (%) |
68.7 % |
| Payable Metals |
|
| LOM Gold Payable (koz Au) |
707.2 |
| LOM Copper Payable (klbs) |
186,726 |
| LOM Silver Payable (koz Ag) |
1,874 |
| LOM Gold Equivalent Payable (koz AuEq) |
931 |
| Avg. Annual Gold Payable (koz Au) - Yr 1 to Yr 11 |
64.3 |
| Avg. Annual Copper Payable (Mlbs) - Yr 1 to Yr 11 |
17 |
| Avg. Annual Silver Payable (koz Ag) - Yr 1 to Yr 11 |
170 |
| Avg. Annual Gold Equivalent Payable (koz AuEq) - Yr 1 to Yr 11 |
85 |
| Avg. Annual Gold Payable (koz Au) - Yr 2 to Yr 8 |
77 |
| Avg. Annual Copper Payable (Mlbs) - Yr 2 to Yr 8 |
21 |
| Avg. Annual Silver Payable (koz Ag) - Yr 2 to Yr 8 |
189 |
| Avg. Annual Gold Equivalent Payable (koz AuEq) - Yr 2 to Yr 8 |
102 |
| Costs per Ton |
|
| Mining Costs ($/t mined total) |
3.88 |
| Mining Costs ($/t processed) |
7.33 |
| Processing Costs – including tailings placement ($/t processed) |
9.59 |
| G&A Costs ($/t processed) |
1.54 |
| Total Site Operating Cost ($/t processed) |
18.46 |
|
|
| LOM Total Cash Cost, net-of-copper-silver-by-product ($/oz Au)2 |
1,007 |
| LOM Total Cash Cost, co-product ($/oz AuEq)2 |
1,748 |
| LOM AISC, net-of-copper-silver by-product ($/oz Au)2 |
1,094 |
| LOM AISC, co-product ($/oz AuEq)2 |
1,814 |
| Capital Expenditure (incl. Contingency) |
|
| Initial Capital – incl. Contingency ($M)3 |
394 |
| Pre-production Owners Costs ($M) |
28 |
| Sustaining Capital – incl. Contingency ($M) |
35 |
| Reclamation Cost ($M) |
27 |
| Base Case Metal Price Assumptions |
|
| Gold Price ($/oz) |
3,250 |
| Copper Price ($/lb) |
4.50 |
| Silver Price ($/oz) |
40.00 |
| Base Case Project Economics |
|
| After-Tax IRR (%) |
27 |
| After-Tax NPV5% ($M) |
632 |
| Payback Period (years) |
2.5 |
| Average Annual Operating Net Free Cash Flow ($M)2 – Yr 1 to Yr 11 |
124 |
| LOM Total Net Free Cash Flow ($M) (including capital investment and closure) |
967 |
|
|
|
|
|
|
|
(1) |
Gold equivalent calculated using net smelter return ("NSR") value of payable metals at base case metal prices: $3,250/oz Au, $4.50/lb Cu and $40/oz Ag. |
|
(2) |
See Cautionary Note Regarding Non-GAAP Financial Measures. |
|
(3) |
Assumes contractor mining. |
|
|
|
|
|
|
|
|
| Average Process Recovery |
|
Gold |
Silver |
Copper |
| Oxide Ore (11% of total reserve) |
|
67.0 % |
60.0 % |
25.0 % |
| Mixed Ore (9% of total reserve) |
|
67.0 % |
70.0 % |
73.0 % |
| Sulfide Ore (80% of total reserve) |
|
73.0 % |
70.0 % |
91.0 % |
CK Gold Project Production and Operating Cost Profile1,2
|
|
|
|
(1) |
Gold equivalent calculated using NSR value of payable metals at base case metal prices: $3,250/oz Au, $4.50/lb Cu, and $40/oz Ag. |
|
(2) |
See Cautionary Note Regarding Non-GAAP Financial Measures. |
CK Gold Project After-tax Cash Flow Profile (base case)1,2
|
|
|
|
(1) |
Cash flow profile shown using base case metal prices: $3,250/oz Au, $4.50/lb Cu, and $40/oz Ag. |
|
(2) |
See Cautionary Note Regarding Non-GAAP Financial Measures. |
CK Gold Project After-Tax NPV, IRR and Payback Sensitivity Table
|
|
|
|
|
|
| Gold PriceUS$/oz |
Pre-tax |
|
After Tax |
|
Payback(years) |
| NPV |
IRR |
NPV |
IRR |
|
|
| 1,500 |
(126) |
0.0 % |
(147) |
0.0 % |
15.8 |
| 2,000 |
127 |
10.2 % |
98 |
8.5 % |
5.6 |
| 2,500 |
380 |
19.2 % |
320 |
16.8 % |
3.8 |
| 3,000 |
633 |
27.1 % |
528 |
23.8 % |
2.9 |
| (Base Case) 3,250 |
759 |
30.7 % |
632 |
27.0 % |
2.5 |
| 3,500 |
886 |
34.3 % |
737 |
30.2 % |
2.2 |
| 4,000 |
1,139 |
41.0 % |
946 |
36.3 % |
1.8 |
| 4,500 |
1,392 |
47.4 % |
1,155 |
42.0 % |
1.6 |
| 5,000 |
1,645 |
53.5 % |
1,363 |
47.4 % |
1.4 |
| 5,500 |
1,898 |
59.4 % |
1,569 |
52.5 % |
1.3 |
| 6,000 |
2,151 |
65.0 % |
1,774 |
57.5 % |
1.1 |
Property Description, Location and Access
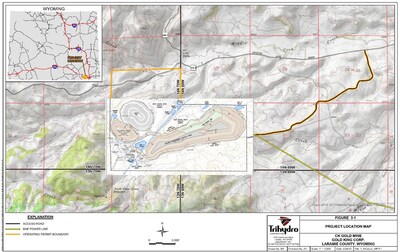
The Project, within the historic Silver Crown mining district, is located within southeastern Wyoming in Laramie County approximately 20 miles west of Cheyenne, Wyoming's state capital. The Project is two miles off the paved Happy Jack state road and situated near U.S. Interstates 80 and 25, a 1.5 hour drive from Denver. The Project is accessed via 4.5-miles of private road east from Laramie County Road 210.
CK Gold Project Location Map
Mineral Resource Estimate
The current mineral resource estimate for gold, copper, and silver at the Project was previously disclosed in the S-K 1300 Technical Report Summary for the Project, dated February 10, 2025, which was filed on a Form 8-K dated February 14, 2025. The supporting drillhole database incorporates data from all US Gold drilling programs, comprising 59 drillholes totaling 60,132 ft, as well as drilling completed by previous operators. US Gold drilling spans four programs: two holes totaling 2,030 ft in 2017; eight holes totaling 8,090 ft in 2018; 25 holes totaling 20,449 ft in 2020; and 24 holes totaling 29,562 ft in 2021.
For the current FS, Mark Shutty, CPG, MAIG, utilized Leapfrog Geo/Edge software (version 2024.1) to construct and update the geological models of the CK deposit. The constraining pit shell and in-pit resource reporting were completed using MinePlan (version 16.5), incorporating updated metal prices, operating cost parameters, and metallurgical recovery assumptions, with the underlying geological and grade model otherwise unchanged from the prior estimate.
The mineral resource estimate was developed using the following standard procedures:
- Import of topographic data to establish a digital terrain model of current surface conditions.
- Import and validation of drillhole interval datasets using Leapfrog Geo tools, including review of assay, survey, and density data.
- Construction of implicit three-dimensional geological and mineralized domain models using Leapfrog Geo, interpretation of oxidation state based on visual and geochemical logging, and assignment of bulk density values by domain.
- Evaluation and modeling of experimental variograms aligned with observed mineralization trends, establishing anisotropic ranges of sample influence for grade estimation.
- A 3D model with 20 ft x 20 ft x 30 ft block dimensions was defined to accommodate the CK deposit and optimization pit shell while facilitating the use of a 30' bench height mining unit.
- Estimation and validation of gold, copper, and silver grades within the three-dimensional block model using Ordinary Kriging.
- Classification of mineral resources into confidence categories (measured, indicated, and inferred) based on drill spacing, geological continuity, and estimation quality metrics.
- Application of economic and geometric constraints for resource reporting within an optimized pit shell, as described in the accompanying footnotes.
Beginning in 2020, US Gold facilitated the relogging of all available legacy drill core to ensure consistent interpretation of rock types across the 2020 and 2021 drilling programs. US Gold's geologic datasets were used to evaluate samples and construct three-dimensional geological models in Leapfrog Geo. The primary lithologic model includes Proterozoic granodiorite with varying intensities of potassic alteration and mylonitic fabrics. Mafic dikes, younger pegmatites, and undifferentiated veins represent smaller volumes within the mineralized granodiorite domain. Mafic dike bodies were constructed in Leapfrog Geo as discrete volumes; pegmatites and veins were not modeled separately and were assigned the host rock type, as drilling density is insufficient to model either as throughgoing features. Unmineralized domains were also modeled, including a metasediment unit east of the Copper King Fault and overlying Quaternary cover.
Metallurgical testing of mineralized rock indicates that sulfide recovery is a function of oxidation state. During core logging, geologists visually estimated the oxidation state and categorized it as either oxide, mixed, or sulfide. The oxidation boundary contacts were modeled in Leapfrog Geo to encompass logged oxidation intervals and modeled structures, resulting in a series of surfaces used to code the block model.
Raw gold, copper, and silver assays were evaluated within the resource drillhole database with histogram and probability plots to identify statistical outliers. These data are generally reflective of a single sample population with few outliers. Outliers were examined to ensure they were not the result of a database transcription error and were geologically reasonable; the location of high-grade samples with respect to nearby samples, lithology, and oxidation was reviewed ahead of establishing capping thresholds, which generally occur at distribution changes noted in the individual metal probability plots. Au is capped at 0.32 oz/t, Cu is capped at 3.0 % and Ag is capped at 0.58 oz/t resulting in a metal reduction of 0.28%, 0.36% and 1.54% respectively.
Section showing blocks >0.2 g/t (>0.006 oz/t) AuEq with Nested Resource and Reserve Pit

Mineral Resources Statement - Inclusive of Reserves
|
|
|
|
|
|
|
|
|
|
|
Mass |
Gold (Au) |
|
Copper (Cu) |
|
Silver (Ag) |
|
Au Equivalent (AuEq) |
|
| Tons (000's) |
Oz (000's) |
oz/st |
lbs (millions) |
% |
Oz (000's) |
oz/st |
Oz (000's) |
oz/st |
|
| Measured (M) |
39,914 |
627 |
0.0157 |
144 |
0.18 |
1,862 |
0.0467 |
879 |
0.0220 |
| Indicated (I) |
58,585 |
582 |
0.0099 |
177 |
0.15 |
2,178 |
0.0372 |
911 |
0.0156 |
| M + I |
98,499 |
1,209 |
0.0123 |
322 |
0.16 |
4,040 |
0.0410 |
1,790 |
0.0182 |
|
|
|
|
|
|
|
|
|
|
| Inferred |
47,088 |
407 |
0.009 |
142 |
0.15 |
1,436 |
0.0300 |
677 |
0.0140 |
|
|
|
|
|
|
|
|
|
|
|
|
|
|
|
|
|
|
|
|
|
|
|
|
|
|
|
|
|
|
|
1. |
Mineral resources are estimated using Ordinary Kriging, constrained by geological domains based on lithology and mineralization controls. The underlying datasets supporting the resource estimate, including drill hole surveys, assay data, and density measurements, have been reviewed, validated, and verified by the Qualified Person. Database corrections made since the Preliminary Feasibility Study, including downhole survey corrections, were confirmed as non-material through sensitivity analysis; the pre-1997 assay quality assessment is addressed in Section 9 of the Technical Report Summary. |
|
|
|
|
|
|
|
|
|
|
|
|
|
|
|
|
|
|
|
|
|
|
|
|
|
|
|
|
2. |
Mineral resources are reported in short tons within an optimized pit shell, using AuEq cutoff grades of 0.22 g/t (0.00642 oz/st) for oxide material, 0.21 g/t (0.00613 oz/st) for mixed material, and 0.20 g/t (0.00583 oz/st) for sulfide material. No dilution or mining recovery factors have been applied. Resources are reported inclusive of mineral reserves; resources exclusive of reserves are summarized below. |
|
|
|
|
|
|
|
|
|
|
|
|
|
|
|
|
|
|
|
|
|
|
|
|
|
|
|
|
3. |
AuEq grades were calculated using long-term consensus metal prices of $3,000/oz Au, $4.40/lb Cu, and $35/oz Ag, after application of a 2.1% NSR royalty, yielding realized prices of $2,937/oz Au, $4.31/lb Cu, and $34.27/oz Ag. Metallurgical recoveries represent mill recovery to concentrate and vary by oxidation domain as follows: |
|
|
|
|
|
|
|
|
|
|
|
|
|
|
Metal |
Oxide |
Mixed |
Sulfide |
|
|
|
|
|
|
|
|
|
|
|
Au |
67 % |
70 % |
73 % |
|
|
|
|
|
|
|
|
|
|
|
Cu |
22 % |
75 % |
90 % |
|
|
|
|
|
|
|
|
|
|
|
Ag |
55 % |
65 % |
72 % |
|
|
|
|
|
|
|
|
|
|
|
Smelter payability factors of 98% Au, 97% Cu, and 95% Ag, as detailed in the concentrate offtake assumptions in Section 13, are applied as separate deductions in the reserve economic analysis and are not embedded in the above recovery figures. Domain-specific AuEq conversion factors, derived from the ratio of each metal's NSR contribution to gold's NSR contribution, are: Oxide - Ag 0.009577 g/g, Cu 0.330 g/%; Mixed - Ag 0.010833 g/g, Cu 1.078 g/%; Sulfide - Ag 0.011507 g/g, Cu 1.240 g/%. LOM average recoveries of 72.5% Au, 85% Cu, and 72% Ag, as reported in the Major Design Criteria (Section 14), reflect the scheduled ore feed mix, which is weighted toward sulfide material, and differ from simple domain averages due to mine sequence. |
|
|
|
|
|
|
|
|
|
|
|
|
|
|
|
|
|
|
|
|
|
|
|
|
|
|
|
|
4. |
The optimized pit shell was generated using the Lerchs-Grossmann method incorporating metal prices of $3,000/oz Au, $4.40/lb Cu, and $35/oz Ag, operating costs of $2.50/st mining (strip-adjusted), $7.00/st processing, $1.65/st tailings, and $1.50/st general and administrative ("G&A") (total $12.65/st), domain-specific metallurgical recoveries as detailed in Footnote 3, a 2.1% NSR royalty, and a 48-degree slope angle. A theoretical breakeven AuEq cutoff of 0.205 g/t was calculated by dividing total operating costs ($12.65/st, equivalent to $13.94/mt) by the NSR per gram of AuEq at average domain recoveries. Reported AuEq cutoffs of 0.20–0.22 g/t were validated against a net block value flag incorporating grade-bin and domain-specific recovery schedules; application of the AuEq cutoffs produces measured and indicated ("M+I") resources within 0.2% of contained AuEq ounces compared to the value-flag defined resource, confirming the grade-based cutoffs are a non-material proxy for underlying block economics. A rehandling cost of $1.00/st applicable to stockpiled ore is excluded from the resource cutoff cost basis as it represents a mine sequencing cost rather than a fundamental extraction cost; this cost is incorporated in the reserve economic analysis. |
|
|
|
|
|
|
|
|
|
|
|
|
|
|
|
|
|
|
|
|
|
|
|
|
|
|
|
|
5. |
Metal prices of $3,000/oz Au, $4.40/lb Cu, and $35/oz Ag represent long-term consensus prices reflecting the qualified persons[1]s ("QP") assessment of sustainable pricing over the Project life, consistent with the 24-month trailing average as of the effective date. These prices are above the 36-month trailing average of $2,593/oz Au, $4.28/lb Cu, and $30.63/oz Ag, reflecting structural shifts in precious and base metals markets since 2023. At the 36-month trailing average, corresponding to a cutoff of 0.25 g/t AuEq across all domains, M+I contained Au decreases by approximately 1.2% and M+I AuEq by approximately 2.8%, demonstrating resource robustness across a range of price scenarios. |
|
|
|
|
|
|
|
|
|
|
|
|
|
|
|
|
|
|
|
|
|
|
|
|
|
|
|
|
6. |
There are no known legal, political, environmental, social, or permitting factors that would materially affect the reported mineral resource estimate. |
|
|
|
|
|
|
|
|
|
|
|
|
|
|
|
|
|
|
|
|
|
|
|
|
|
|
|
|
7. |
Mineral resources are classified in accordance with the definitions set forth in S-K 1300. Mineral resources are reported inclusive of mineral reserves. Mineral resources that are not mineral reserves have not demonstrated economic viability. |
|
|
|
|
|
|
|
|
|
|
|
|
|
|
|
|
|
|
|
|
|
|
|
|
|
|
|
|
8. |
Mineral resources are reported within the company's mineral tenure holdings, which include Lease #0-40828 and Lease #0-40858, as described in Section 3 of the TSR[2]. There are no known encumbrances, liens, or third-party interests that would materially affect the company's ability to develop the mineral resources reported herein. |
|
|
|
|
|
|
|
|
|
|
|
|
|
|
|
|
|
|
|
|
|
|
|
|
|
|
|
|
9. |
Rounding of reported figures may result in minor apparent discrepancies in totals of tonnage, grade, and contained metal. |
|
|
|
|
|
|
|
|
|
|
|
|
|
|
|
|
|
|
|
|
|
|
|
|
|
|
|
|
10. |
There is no certainty that all or any part of the mineral resources will be converted into mineral reserves. The estimate of mineral resources may be materially affected by environmental, permitting, legal, marketing, or other relevant issues. |
|
|
|
|
|
|
|
|
|
|
|
|
|
|
|
|
|
|
|
|
|
|
|
|
|
|
|
|
11. |
Mineral resources are reported on a 100% Project basis. The company holds 100% interest in the Project. |
|
|
|
|
|
|
|
|
|
|
|
|
|
|
|
|
|
|
|
|
|
|
|
|
|
|
|
|
12. |
The effective date of this mineral resource is December 12, 2025 |
|
|
|
|
|
|
|
|
|
|
|
|
Mineral Resources Statement - Exclusive of Reserves
|
|
|
|
|
|
|
|
|
|
|
Mass |
Gold (Au) |
|
Copper (Cu) |
|
Silver (Ag) |
|
Au Equivalent (AuEq) |
|
|
Tons (000's) |
Oz (000's) |
opt |
lbs (millions) |
% |
Oz (000's) |
opt |
Oz (000's) |
opt |
| Measured (M) within Resource Pit Shell, external to Reserve Pit Shell |
5,124 |
38 |
0.0070 |
13 |
0.12 |
278 |
0.0540 |
64 |
0.0130 |
| Measured (M) within Reserve Pit Shell, below Reserve Cutoff Grade |
6,128 |
43 |
0.0070 |
15 |
0.12 |
314 |
0.0510 |
71 |
0.0120 |
| (M) within Resource Pit Shell |
11,252 |
81 |
0.0070 |
27 |
0.12 |
592 |
0.0530 |
135 |
0.0120 |
|
|
|
|
|
|
|
|
|
|
| Indicated (I) within Resource Pit Shell, external to Reserve Pit Shell |
15,602 |
137 |
0.0090 |
42 |
0.13 |
610 |
0.0390 |
220 |
0.0140 |
| Indicated (I) within Reserve Pit Shell, below Reserve Cutoff Grade |
17,786 |
146 |
0.0080 |
46 |
0.13 |
681 |
0.0380 |
235 |
0.0130 |
| (I) within Resource Pit Shell |
33,388 |
283 |
0.0080 |
88 |
0.13 |
1,292 |
0.0390 |
455 |
0.0140 |
| (M + I) within Resource Pit Shell |
44,640 |
364 |
0.0080 |
115 |
0.13 |
1,884 |
0.0420 |
590 |
0.0130 |
|
|
|
|
|
|
|
|
|
|
| Inferred within Resource Pit Shell |
47,088 |
407 |
0.0090 |
142 |
0.15 |
1,436 |
0.0300 |
677 |
0.0140 |
|
|
|
|
|
|
|
1. |
Mineral resources exclusive of mineral reserves are reported within an optimized resource pit shell constrained by AuEq cutoff grades of 0.22 g/t (oxide), 0.21 g/t (transitional), and 0.20 g/t (sulfide). Resources are classified in accordance with S-K 1300. Mineral resources that are not mineral reserves have not demonstrated economic viability. The M+I total of 40,497 kt containing 364 koz Au and 590 koz AuEq represents the S-K 1300 reportable exclusive-of-reserves figure; the sub-classifications presented in this table are provided for additional transparency. Mineral resources are reported on a 100% Project basis. The estimation methodology, database verification, and classification criteria are described in the Mineral Resource Statement footnotes above. |
|
2. |
The mineral resource estimate underlying this table was prepared using the methodology described in the Mineral Resource Statement footnotes (above) Footnote 1). |
|
3. |
To delineate mineral resources residing within the reserve pit shell that do not qualify as mineral reserves, M+I mineral resources within the reserve pit shell were identified using proxy AuEq cutoff grades of 0.275 g/t (oxide), 0.265 g/t (transitional), and 0.255 g/t (sulfide). These proxy cutoffs were derived from the reserve economic parameters detailed in Section 12 of the TSR, including metal prices of $2,100/oz Au, $4.27/lb Cu, and $27/oz Ag, smelter payability factors, operating costs, and domain-specific metallurgical recoveries, and were calibrated to closely replicate the reserve tonnage and contained metal reported in Section 12 of the TSR, with residual differences attributable to the discrete nature of the block model. Application of these proxy cutoffs within the reserve pit shell produces results within rounding of the reported reserve figures. Material within the reserve pit shell that falls below these proxy cutoffs is classified as M+I mineral resource exclusive of reserves and is reported in the second sub-row for each classification. |
|
4. |
Mineral resources reported as "within Resource Pit Shell, external to Reserve Pit Shell" represent M+I and Inferred resources that fall outside the reserve pit shell footprint but within the resource pit shell. These resources are constrained by the resource pit shell optimization described in Section 11 of the TSR and are not captured within the reserve mine plan. All Inferred resources are reported within the resource pit shell and entirely external to the reserve pit shell. |
|
5. |
AuEq grades and contained AuEq ounces are calculated using the resource metal prices, NSR royalty, and domain-specific metallurgical recoveries described in the Mineral Resource Statement footnotes (above). AuEq conversion factors reflect mill recovery to concentrate and differ from the reserve AuEq basis, which additionally incorporates smelter payability factors. Grades are reported as tonnage-weighted averages derived from contained metal and reported tonnage. |
|
6. |
Copper is reported in millions of pounds of contained metal. Copper grade is reported as percent (%Cu) of the in-situ material. |
|
7. |
Rounding of reported figures may result in minor apparent discrepancies in stated totals of tonnage, grade, and contained metal. |
|
8. |
There is no certainty that all or any part of the mineral resources reported herein will be converted into mineral reserves. The estimate of mineral resources may be materially affected by environmental, permitting, legal, marketing, or other relevant issues. Inferred mineral resources have a lower level of confidence than Measured or Indicated resources and must not be converted directly to mineral reserves. |
|
9. |
The effective date of this mineral resource is December 12, 2025 |
Mineral Reserve Estimate
As part of the 2021 Preliminary Feasibility Study study, an economic pit-limit analysis was performed using Vulcan's Pit Optimizer software, which uses the Lerchs–Grossmann algorithm to determine an economic excavation limit.
The pit optimization process considered only M+I resources; inferred resources were excluded from the economic evaluation in accordance with NI–43–101 guidance. Metal prices applied in the 2021 optimization were based on a weighted long–term forecast incorporating a three–year trailing average.
The economic excavation limit (pit shell) generated from the 2021 optimization was used to guide the development of the 2024 Preliminary Feasibility Study final pit design. The 2024 Preliminary Feasibility Study design subsequently served as the foundation for the 2026 Feasibility Study pit design.
The 2021 pit optimization was revalidated through an additional optimization run completed using updated 2026 cost parameters reflecting current-year economic conditions. This supplementary analysis confirms continuity and provides a robust basis for the 2026 Feasibility Study pit design. The updated optimization demonstrates strong economic performance that exceeds the results of the 2021 pit shell used to guide the 2026 Feasibility Study design. Ultimate pit limits remain primarily constrained by the available onsite waste storage capacity.
The final pit design establishes the physical boundary for the conversion of mineral resources to mineral reserves. M+I resources located within the final pit limits may be converted to mineral reserves, subject to applicable modifying factors, including resource classification and cut–off grade criteria. Additional details regarding the mine design are provided in Section 13 of the TSR.
The value per ton ("VPT") "milling cut-off value" calculation for all areas was completed as follows:
- • VPT = (Block Revenue – Process Cost – Tailings Costs -Rehandle Cost- G&A Cost)/Resource Tons
- • Where:
- Block Revenue = Resource tons x grades x Recovery x Net Price for each metal
- Resource tons and grades are adjusted for mine dilution and ore loss
- Process Cost = Resource tons x Process Cost per ton
- Tailing Cost = Resource tons x Tailings Cost per ton
- Rehandle Cost = Resource tons x Rehandle Cost per ton
- G&A Cost = Resource tons x G&A Cost per ton
This calculation is sometimes called the "milling cut-off value" because the mining cost is not considered. The mining cut-off uses a similar calculation but includes the mining cost. The mining cut-off is used to determine the boundary of an economic pit shell, and the milling cut-off has been used in this case to determine the reserves contained within that same shell. For the reserves, the block was considered mill feed if the VPT was equal to or greater than a value of $0.00/st. If the value was less than this, the block was considered waste.
The VPT calculation was carried out with more up-to-date input parameters that were updated as part of the 2026 Feasibility Study. The parameters used for the VPT calculation are presented below.
|
|
|
| VPT Calculation Input Parameters |
|
|
|
|
|
| Gold Price |
$/oz |
2100.00 |
| Copper Price |
$/lb |
4.10 |
| Silver Price |
$/oz |
27.00 |
| NSR Royalty* |
% |
2.1 |
| Concentrate Smelting & Transport — Oxide |
$/lb Cu recovered |
0.29 |
| Concentrate Smelting & Transport — Mixed |
$/lb Cu recovered |
0.32 |
| Concentrate Smelting & Transport — Sulfide |
$/lb Cu recovered |
0.37 |
| Cu Refining Charge |
$/lb Cu |
0.07 |
| Au Refining Charge |
$/oz |
5.00 |
| Ag Refining Charge |
$/oz |
0.45 |
|
|
|
| Oxide—Cu Recovery (>0.1% & <0.4%) |
% |
25 |
| Oxide—Au Recovery (>0.3gpt & <1.3 gpt) |
% |
67 |
| Oxide—Ag Recovery (<0.4 gpt) |
% |
50 |
| Oxide—Ag Recovery (>0.4 gpt) |
% |
60 |
| Mixed—Cu Recovery |
% |
72.5 |
| Mixed—Au Recovery ( <1.0 gpt) |
% |
67 |
| Mixed—Au Recovery (>1.0 gpt) |
% |
70 |
| Mixed—Ag Recovery |
% |
70 |
| Sulfide—Cu Recovery ( <0.4%) |
% |
85 |
| Sulfide—Cu Recovery (>0.4% & <0.65%) |
% |
91 |
| Sulfide—Cu Recovery (>0.65%) |
% |
92 |
| Sulfide—Au Recovery (>0.4gpt) |
% |
70 |
| Sulfide—Au Recovery (>0.4gpt & <0.65 gpt) |
% |
72 |
| Sulfide—Au Recovery (>0.65gpt) |
% |
75 |
| Sulfide—Ag Recovery |
% |
70 |
| Smelter Payable — %Cu |
% |
97 |
| Smelter Payable —Au oz/st |
% |
98 |
| Smelter Payable — Ag oz/st |
% |
95 |
| Concentrate Grade %Cu — Oxide |
% |
23 |
| Concentrate Grade %Cu — Mixed |
% |
21 |
| Concentrate Grade %Cu — Sulphide |
% |
18 |
|
|
|
| Process Cost |
$/st processed |
7 |
| Tailings Cost |
$/st processed |
1.65 |
| Site-Wide General & Administrative Cost |
$/st processed |
1.50 |
| Rehandling cost |
$/t |
1.00 |
The block model used for mineral reserve estimation employs a block size of 20 ft × 20 ft × 30 ft. This block dimension is comparable to, or larger than, the selective mining unit achievable with the planned loading equipment (CAT 992 or similar). As a result, no dilution is expected to arise from discrepancies between block model dimensions and operational mining selectivity.
Mineralization is disseminated, with grades transitioning gradually across the orebody. While some dilution will occur during mining, the majority of adjacent material exhibits grades like the ore being extracted. In these cases, dilution is considered negligible.
Material dilution of significance is expected only at contacts between ore blocks and adjacent blocks with materially lower grades. For the purposes of reserve estimation, blocks with a value per ton more than US$3/st below the ore/waste cut–off value are classified as diluting blocks.
Ore loss is expected to occur in areas with isolated ore blocks. In operations these areas are often reclassified as waste to guarantee productivity. The CK Au mineralization does not have many of these isolated ore blocks.
A bench–by–bench inventory identified that only 0.15% of blocks can be classified as isolated. All isolated blocks were found to be low–grade ore, and therefore separate ore–loss factors were developed for low–grade and high–grade ore, consistent with the approach used for dilution estimation. Ore loss considered for low–grade and high–grade ores are 2% and 0.5% respectively
In addition to the ore loss associated with isolated blocks, an allowance was included to account for operational inefficiencies and human error.
CK Au mineral reserves are given in Table 12.5. Mohsin Hashmi P.Eng, is the QP responsible for the mineral reserves statement. Mineral reserves are reported inside a detailed pit design using suitable parameters for the site, which was guided by the 2021 pit optimization.
|
|
|
|
|
|
|
|
|
|
| Mineral Reserve Statement |
|
|
|
|
|
|
|
|
|
|
Mass |
Gold (Au) |
|
Copper (Cu) |
|
Silver (Ag) |
|
Au Equivalent(AuEq) |
|
| Tons(Mst) |
Oz(000s) |
oz/st |
M lb |
% |
Oz(000s) |
oz/st |
Oz(000s) |
oz/st |
|
| Proven (P1) |
33.8 |
582 |
0.017 |
129 |
0.191 |
1,542 |
0.046 |
872 |
0.026 |
| Probable (P2) |
40.8 |
433 |
0.011 |
130 |
0.160 |
1,489 |
0.037 |
726 |
0.018 |
| P1 + P2 |
74.5 |
1,015 |
0.014 |
260 |
0.174 |
3,032 |
0.041 |
1,598 |
0.021 |
|
|
|
|
1. |
Reserves tabulated above a "milling cut-off value" per ton (see text). |
|
2. |
Dilution of 1.5% and 0.25% applied for low-grade and high-grade ore respectively. |
|
3. |
Ore loss of 2.0% and 0.5% applied for low-grade and high-grade ore respectively. |
|
4. |
AuEq values calculated assuming gold price of 2100$/oz, silver price of 27 $/oz, copper price of 4.10 $/lb and metallurgical recovery ranges of 67-75% for Au, 50%-70% Ag and 25%-92% Cu as described in table 1.2. |
|
5. |
Totals may not sum due to rounding. |
|
6. |
The mineral reserve effective date is March 30, 2026 |
Production Profile
The contemplated operation in the FS spans 11 years, comprising one year of construction (Year -1), 9 years of active mining and gold-copper-silver processing operations, and two years of low-grade processing from stockpile.
The first three months of the production period focuses on establishing "bedding-down" the plant with lower grade material followed by the remainder of the McNulty ramp up to full name plate plant production at 20,000 short tons per day.
Mining will advance ahead of plant feed rates so that lower grade ore can be accumulated in an ore stockpile and better grade preferentially processed to improve early revenue. Under the current plan, mining will cease and the accumulated low-grade stockpile will be processed until the stockpile is depleted. Tailings will be used to partially backfill the exhausted open pit as part of the closure plan. While this scenario forms the currently permitted activity, it is fully anticipated that the open pit will continue under a permit update and revision, allowing the remaining resource and potential future expansions to the resource to be mined, extending the mine life. Once in production, drilling and further resource definition is contemplated, allowing the mine expansion to be engineered and permits to be sought to realize the full potential of the resource. These activities can commence as soon as year one and there will be approximately 6 years to complete the work to extend the mine life to the next economic limit.
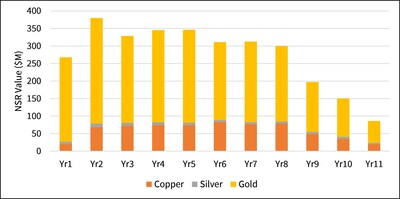
CK Gold Project Production Breakdown by Year
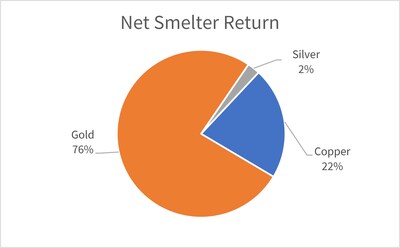
CK Gold Project Revenue Breakdown by Metal
Mining
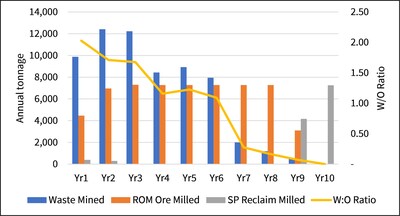
Mining is contemplated as a conventional open-pit operation using truck-and-shovel methods, focused on delivering higher grade AuEq production from the deposit early in the Project using a stockpiling strategy, before transitioning to complete the processing of the low-grade ore accumulated. The mine plan schedules 163 million tons ("Mt") of total material movement including rehandle of low-grade stockpile and waste for Tailings Management Facility (TMF) capping over the 13-year active mine life. Ex pit ore totals 74.527 Mt of ore with an average grade of 0.014 opt Au, 0.17% Cu, and 0.41 opt Ag, for a combined 1.015 Moz of contained gold, 260 million lbs ("Mlb") of contained copper, and 3 Moz of contained silver. Strip ratios average 0.89:1 over the LOM, supporting efficient mining and strong early cash flows. Mining rates of ore are planned for 20,000 tons per day ("tpd") with no more than 12 benches extracted per year.
Material movement is sequenced in four internal open pit phases allowing early presentation of better grade material in association with the stockpile strategy. The phased approach allows time for adjustments to be made for the final pit wall for both final geotechnical slope angles as well as formulation of pit expansions to recover the remaining resource and any additional resources added to the current inventory.
Mining assumptions are developed from first principles, including drill penetration rates, powder factors, cycle times, equipment availabilities, and original equipment manufacturer validated haulage models. The fleet includes up to 18 haul trucks and a matched loading fleet of excavators and shovels sized to maintain efficient dig-and-haul cycles. Waste placement and backfilling strategies minimize external dump requirements and align with closure objectives. Overall, the mining plan reflects an executable, low-risk approach that supports strong economics, operational flexibility, and a smooth transition into reclamation activities in the later years of the Project.
CK Gold Project Mining Profile
Processing and Recovery
Project mineralization is amenable to simple froth flotation. The Project has completed extensive metallurgical testing and the circuit consists of primary crushing, semi-autogenous and ball mill grinding to p80 90 microns, followed by initial rougher flotation. The company tested and adopted Jameson cell flotation technology which improved metal recovery and results in a smaller plant footprint when compared to conventional flotation. The rougher/scavenger concentrate will be reground to p80 25 microns before cleaner flotation in smaller Jameson cell units. Concentrate will be filter pressed and shipped to a smelter for metal extraction while the tailings will be filtered and stacked in a tailings management facility, employing mine waste to buttress and cap the tailings prior to reclamation.
The tailings management facility will require approximately half of the mine waste to stabilize and cap the tailings prior to reclamation, leaving 35 million tons of waste in waste rock storage facilities. Some of the waste rock will be crushed and used for start-up and ongoing construction activities on site. The remaining waste has been aggregate quality tested and found to be an excellent source of rock aggregate and rail ballast. It is anticipated that up to 1 million tons of waste rock can be sold annually to the surrounding market once the mine is in operation and continuing during the reclamation period.
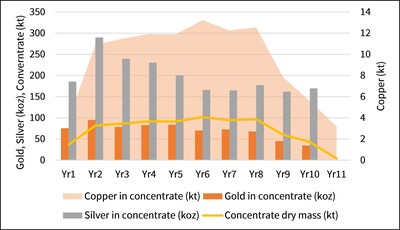
CK Gold Project Annual Concentrate Production Schedule
CK Gold Project Processing Summary
|
|
|
|
|
| Mining |
Ore Milled ('000 tons) |
Copper Grade%Cu |
Gold GradeAu oz/t |
Silver GradeAg oz/t |
| HG oxide |
3,646 |
0.22 % |
0.024 |
0.063 |
| HG mixed |
6,096 |
0.20 % |
0.018 |
0.049 |
| HG sulfide |
46,732 |
0.19 % |
0.015 |
0.040 |
| LG oxide |
305 |
0.13 % |
0.009 |
0.052 |
| LG mixed |
728 |
0.12 % |
0.007 |
0.042 |
| LG sulfide |
723 |
0.11 % |
0.006 |
0.045 |
| SP reclaim |
16,296 |
0.12 % |
0.007 |
0.035 |
| Total Milled |
74,527 |
0.17 % |
0.014 |
0.041 |
| Content (lb, oz x1000) |
|
259,880 |
1,015 |
3,030 |
| Recovery (%) |
|
80.6 % |
71.5 % |
68.7 % |
| Recov'd (lb, oz x1000) |
|
209,520 |
725 |
2,082 |
| Payability (%) |
|
89.1 % |
97.5 % |
90.0 % |
| Payable (lb, oz x1000) |
|
186,726 |
707 |
1,874 |
**Power and Infrastructure
**The Project infrastructure benefits from the Project's location, helping to minimize initial capital, while maintaining reliability and certainty around the construction schedule.
The Project sits twenty miles to the west of Cheyenne and is surrounded by facilities and services that will service the mine site. Cheyenne, the State capital, has a population of around 100,000 and offers a competitive place to live and work for labor and management. With Gillette, WY 4-hours to the north, Salt Lake City, UT 6-hours to the west and Denver, CO 1.5-hours to the south, all of these centers host mine suppliers and expertise to support the Project. There is no need for a man-camp, extensive offices or warehouses and easy access to third party service and maintenance facilities from these mining hubs.
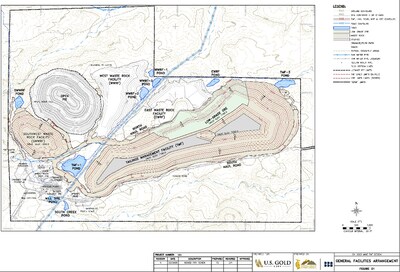
General Facilities Arrangement
The Project will require up to approximately 30 megawatts ("MW") of power to be supplied to the site by Black Hills Energy along a 115 ("kV") transmission line and distributed throughout the site via a new substation and 13.8 kV power distribution network. A 1 MW backup generator is planned to be installed for back-up or emergency power. The power line extending to the Project will be built by Black Hills Energy and the cost amortized as a minimum demand charge along with the consumption charges.
Water will be supplied to the mine under contract from the Cheyenne Board of Public Utilities. A line will bring water from the Crystal reservoir operated by the Cheyenne Board of Public Utilities and charged at published city raw water rate plus a 1.5-times surcharge. The water balance is such that make-up water will be purchased throughout the mine's life, water harvested on site will offset some of those costs.
On-site facilities are limited to those which are necessary for light equipment repair, basic warehousing, concentrate dispatch, weigh bridge and site supervision. A semi-permanent truck shelter-workshop has been planned on a concrete pad service area that includes power, water, truck wash and fuel island. The administration personnel at site will be minimal since the Project is 20-miles from the city of Cheyenne where there is ample office space for rent. The 4.5-mile access road from County Road 210 will be a gravel road with access control. The local fire and emergency service is 6-miles from site and the Cheyenne Regional Medical Center is 25-miles away.
Assay prep lab will be on site for blasthole sample preparation and a Cheyenne-based lab will provide full lab services. Environmental laboratory work will be sent off-site and a small on-site facility situated in the plant for process control.
Operating Costs
Mine operating costs were estimated through first principles and supplier quotes. Where possible, first principal assumptions and costs of units were traded off to one of seven mine bidders for all material movement and earthworks. This was calculated using estimated hourly costs of equipment and personnel against the anticipated hours of work for each. The equipment hourly costs were estimated for fuel, oil and lubrication, tires, under-carriage, repair and maintenance costs, and special wear items. First principal assumptions and the cost of mine personnel and consumables were benchmarked against costs provided by mining contractors. The superior contractor budget estimate was selected.
Process operating costs were developed by Halyard from first principles to determine unit consumptions of materials, supplies, power and personnel, and the estimated cost of unit for these was estimated from supplier quotes and industry benchmarks. The cost of materials, supplies, power and labor were benchmarked against industry norms in the area.
Labor G&A costs were estimated based on personnel requirements for administrative, accounting, safety and security, and environmental departments to support mining and processing activities. Costs are also included for legal, land, permit bonding and power. G&A costs were benchmarked against norms in the Cheyenne area.
CK Gold Project Operating Cost Breakdown (Excluding Aggregate Production)
|
|
|
| LOM Operating Costs (US$/ton) |
Mined |
Processed |
| Mining |
$3.88 |
$7.33 |
| Processing (including placement of tailings) |
|
$9.59 |
| G&A |
|
$1.54 |
| Total Site Costs |
|
$18.46 |
|
|
|
Project Royalties
As a condition of our state mineral leases with the Wyoming Office of State Lands and Investment, revenue from the sale of concentrate at the gate is subject to an NSR royalty of 2.1%.
Capital Cost Estimates
Capital cost estimates emphasize constructability, vendor-supported pricing, and execution sequencing aligned with the planned development schedule.
Mining initial and sustaining capital estimates were prepared by Halyard. Estimates assume owner-operated mining equipment and are based on the equipment and facilities required to achieve the production schedule. Capital costs are based on estimation guides, quotations from equipment vendors and recent quoted costs for new equipment.
The process and infrastructure capital costs were developed by Halyard and Tierra Group International for initial and sustaining capital. The capital costs for each phase are comprised of direct costs and indirect costs. The direct costs were developed from labor, materials, plant equipment, sub-contracts, and construction equipment. Indirect costs were applied to the direct costs to account for items, such as, construction support, engineering, procurement and construction management, vendor support during specialty construction and commissioning, spare parts, contingency, owner's costs, freight and taxes. Capital costs were estimated based on 2026 U.S. dollars and are presented with no escalation.
CK Gold Project Capital Cost Breakdown
|
|
|
|
|
| Capital Cost Breakdown ****($'000) |
Initial Capital ****(Yr -2 to Yr -1) |
Sustaining ****(Yr 1 to Yr 10) |
Reclamation & Closure |
Total LOM |
| Capital Costs |
|
|
|
|
| Mining1 |
5,550 |
1,304 |
|
6,804 |
| Processing |
219,194 |
20,275 |
|
239,469 |
| Infrastructure |
43,011 |
12,946 |
|
47,957 |
| Indirects |
80,166 |
|
|
80,166 |
| Contingency |
46,514 |
|
|
46,514 |
| Capex Sub-Total |
$394,385 |
$34,525 |
|
$428,910 |
| Other Capital |
|
|
|
|
| Owners' Costs2 |
21,959 |
|
|
21,959 |
| Construction Insurance |
1,958 |
|
|
1,958 |
| Mining/Mobilization |
4,085 |
|
|
4,085 |
| Reclamation – Site3 |
|
|
21,055 |
21,055 |
| Cash Collateral (bonding) |
|
|
5,941 |
5,941 |
| Total Other Capital |
$28,002 |
|
26,995 |
$54,997 |
|
|
|
|
|
| TOTAL CAPITAL |
$422,387 |
$34,525 |
$26,995 |
$483,907 |
|
|
|
|
(1) |
Assumes contractor mining fleet |
|
(2) |
Owner's Costs are expensed |
|
(3) |
Closure & reclamation cost net of residual value |
Environmental and Permitting
The Project is supported by strong environmental support from a local Wyoming firm, Trihydro Corporation, and technical support from Greenlight LLC that have been instrumental in acquiring all the necessary permits for construction and operation. US Gold has established a collaborative approach with regulatory agencies and our technical teams will continue to develop the Project to meet all applicable regulatory standards. The construction and operation of the Project require no further major permits beyond site and sectoral permits, permit updates and revisions if there are any deviations from the approved activities.
From the outset the approach has been to keep the Project simple and employ best practices to respect the environment and local community. This resulted in opting for dry-stack tailings placement to conserve and recycle as much water as possible. While the geochemical testing suggests that ore, waste and tailings will not generate acidic drainage, facilities will be isolated from the land surface by a liner as necessary to provide additional assurance that there will not be future occurrences. CK is a robust mine operation that is protective of water resources, air quality, cultural resources, wildlife and vegetation, and post-mine land use.
Stakeholder and Community Engagement
Since the decision to pursue the Project in September 2020, the Company has operated with dedicated budget and personnel to engage proactively with the communities, and other stakeholders with ties to the affected area. With consistent frequency the Project approaches state permitting agencies and coordinates with Federal agencies with jurisdiction in the area (primarily US Corp of Army Engineers). The Company has worked to build lasting relationships with a wide range of stakeholders, including nearby residents and community members, non-governmental organizations and various levels of government representatives. This approach reflects a deep Company-wide commitment to a high standard of social performance, achieved by acting transparently and building mutual respect and shared value.
Stakeholder engagement is guided by an Environmental and Social Management System ("ESMS"), a Project site-specific plan that is updated annually to guide the activities, goals, and strategies for stakeholder engagement in a tailored manner that reflects the unique requirements of each region, individual stakeholder context, and cultural settings surrounding CK. The ESMS management approach specifically addresses the Company's stakeholder engagement, public communication, community involvement & investment, and monitoring & reporting – including social impact risks assessments, grievance procedures, materiality, and metric tracking. The company has advanced the ESMS with a view to complying with Equator Principles standards and has been the subject of two independent assessments by Digbee Ltd. ("Digbee"), a leading ESG disclosure platform for the extractive mining industry. The Digbee assessment is an independent assessment drawing from worldwide norms and CK was assessed an "A" rating in the recent 2026 assessment.
Exploration Potential and Upside at CK Gold Project
Beyond the FS mine plan, CK offers substantial longer-term upside and strategic optionality. The FS includes an updated mineral resource statement that includes mineral resources, which are currently excluded from the Project's mineral reserves and economic analysis. This has been a purposeful decision to limit the pit so as not to cross a dry drainage to the northwest of the current pit boundary which would have necessitated involvement of the U. S. Army Corp of Engineers. Future processing and development is an economic continuation to the existing plans but will involve additional permitting after Project expansion planning and investigation through additional drilling, and permit presentation. This can be accomplished during the early years of operation for a seamless transition into the additional resources. In addition, CK sits in the historic Silver Crown Mining District and while there are old workings within the surrounding area the company is at the early stages of investigating potential beyond the current resources, known to continue at depth and along strike. The Project layout and infrastructure contemplated in the FS also provide flexibility for potential future throughput expansion for the deeper resources, allowing US Gold to pursue disciplined growth opportunities while maintaining a simplified, low-risk development pathway.
Next Steps and Opportunities
With the FS complete, the Company is advancing to Project financing and shortly thereafter detailed engineering. Near-term priorities include securing major equipment specifications to allow detailed engineering and execution planning. The initial portion of the access road has been constructed, and the company is looking at the remaining access to the pit with an objective of quarrying from the pit the necessary aggregate ready for construction.
The company has purchased 10-acres in an industrial park to the west of Cheyenne for employee parking and busing to site. There exists the possibility to erect office space at this site.
No Production Decision: The Company has not made a production decision for the Project. A decision to proceed with construction will only be made following the completion and review of detailed engineering, approval by the Board of Directors, and securing financing arrangements.
CK Feasibility Study Conference Call & Webcast
US Gold will host a webcast on Wednesday, April 1, 2026, at 4:00 PM Eastern Time / 1:00 PM Pacific Time, to discuss the CK FS. The link to the webcast is: US Gold Feasibility Study Webcast
webcast are included below.



 View original content to download multimedia:

 View original content to download multimedia: