03/03/26 Careers, Women Every day at Titan Machinery, our teams show up ready to provide for all our customers' equipment needs. Behind that commitment are dedicated women who power our dealerships and corporate office with skill, focus, and heart.…
03/03/26 Careers, Women
Every day at Titan Machinery, our teams show up ready to provide for all our customers' equipment needs. Behind that commitment are dedicated women who power our dealerships and corporate office with skill, focus, and heart. Their work keeps everything moving on the lot, in the shop, and behind the scenes.
This International Women’s Day, we proudly celebrate some of the women who help drive our success. In honor of the 2026 theme, “Give to Gain,” we’re shining a light on those who lead with generosity, teamwork, and a belief that when we support one another, everyone moves forward.
Trisha Furnish - Center Point, IA Parts Sales Representative
"An absolute gem when it comes to customer service and teamwork."
Trisha has a willingness to help that knows no bounds. She greets customers at the door with a warm smile, helps them find their parts, walks them to the service department, and ensures they feel welcomed and appreciated throughout their visit. Customers often ask for her by name and inquire about her well-being. She has built strong relationships with them and ensures they are taken care of from start to finish.
Other employees also appreciate her supportive and giving nature. They feel comfortable asking her for assistance in any department, knowing she will be friendly and happy to help. Her dedication to customer service and her team is truly remarkable, as it stands as her number one priority.
Trisha consistently shows giving and collaboration in the Center Point dealership and beyond, with her incredible contributions and positive impact on both their customers and the team.
Thank you, Trisha, for your hard work, willingness to give to customers and other team members, and your positive attitude toward your work!
Bailey Westmoreland and Carissa Johnson - Northwood, ND Service Manager & Service Administrator
These two incredible women rule the shop in Northwood, ND, ensuring every job is done efficiently and correctly.
"They are together arm to arm every hour that they are clocked in. They rule the shop in a man's world."
Bailey and Carissa are the heartbeat of the service department. Whether they are working behind the scenes or directly with customers, they can complete every task handed to them. Both customers and employees alike respect this two-woman team, providing quality service every day.
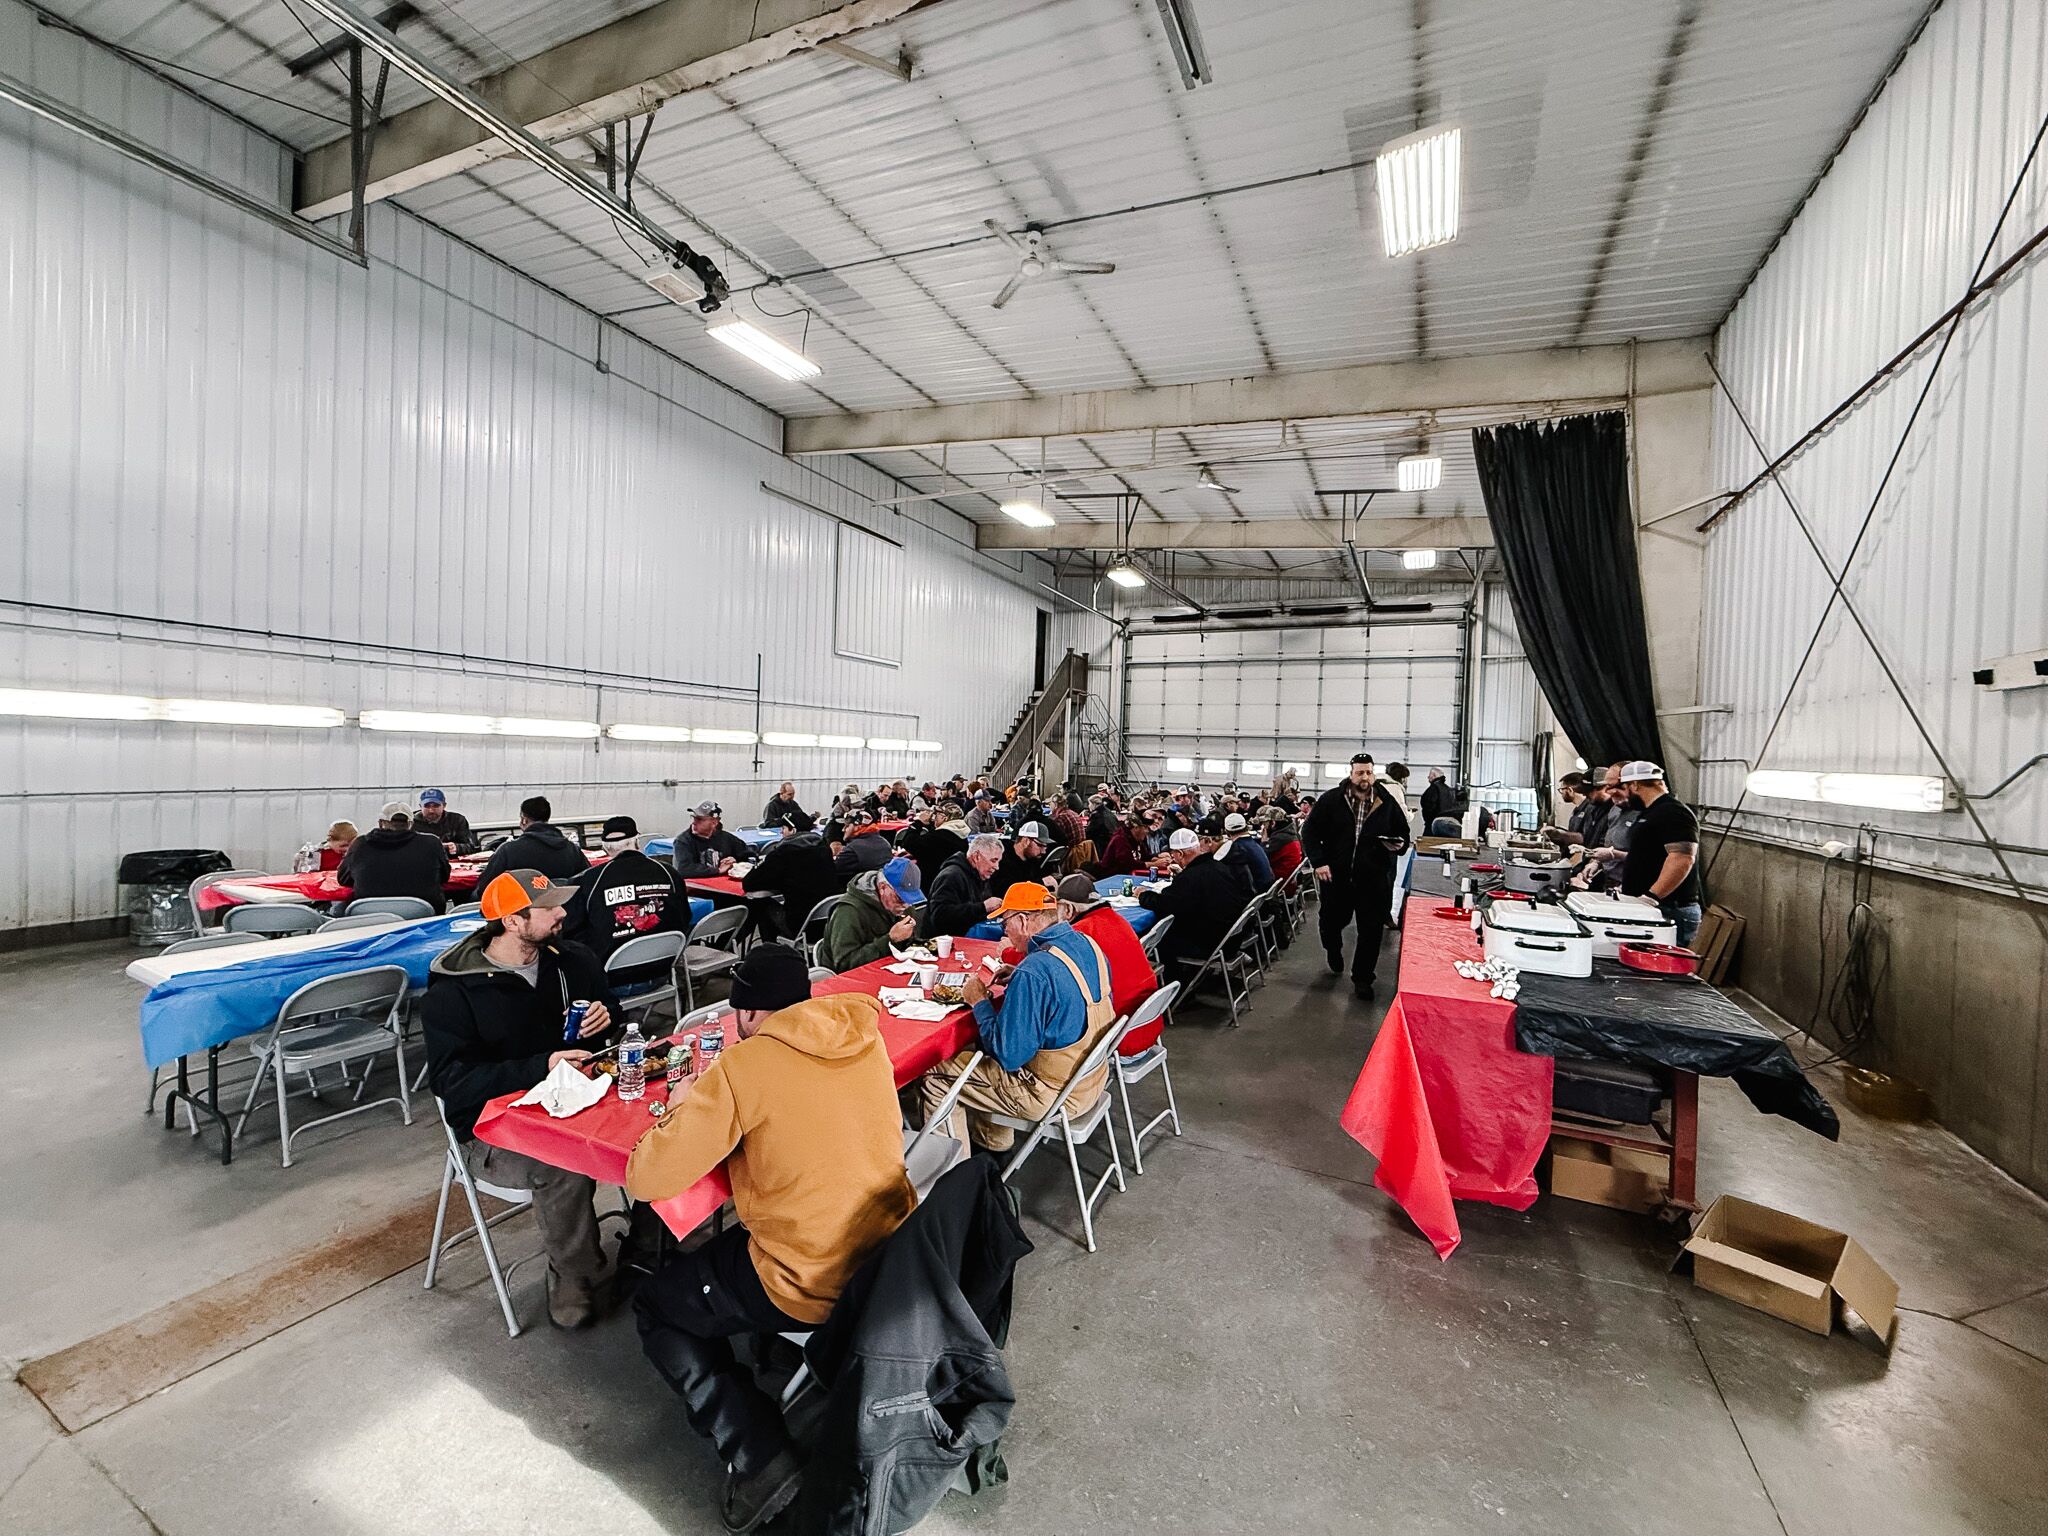
Both women help with Northwood's combine clinic every summer, making sure the entire event is set up for success. The store would not be able to host over 100 customers without their planning and implementation. Their work behind the scenes for this event and others is one of the reasons the events go off without a hitch.
Thank you to Bailey and Carissa for your ceaseless work with our teams, customers, and behind the scenes!
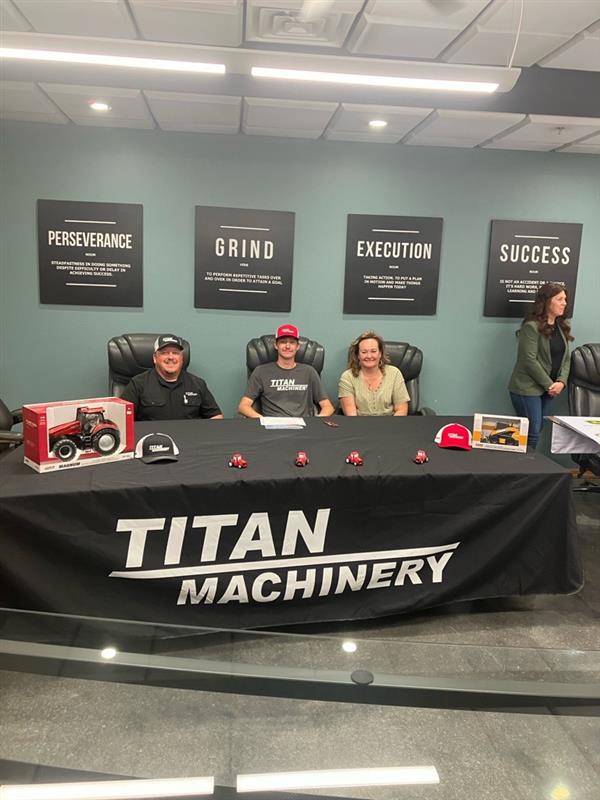
Bailey Westmoreland, two students from Northwood, ND, and Lexy Bradshaw Northwood General Manager
Lexy Bradshaw Northwood General Manager, Carissa Johnson, and Lexy's daughter Stella
Rhea Wingenbach - Shared Resource Center, West Fargo, ND Central Warranty Team
Highlighting a woman who is consistently dedicated to her role and supporting others, we look to Rhea on the Central Warranty Team.
Training and teaching individuals about the warranty claim process is a part of the role Rhea holds. She goes out of her way to make sure team members fully understand all aspects of the process and trains them thoroughly with grace and patience. She is immediately willing to help out and teach others around her.
New members to parts and service roles appreciate her training and especially her responsiveness. Rhea is always attentive and very knowledgeable in assisting with any and all questions related to the Warranty process. When training new employees, she maintains a positive attitude throughout their learning and works with them to ensure they are comfortable with what she is teaching.
"Rhea is always attentive and quick to assist with any questions. Her responsiveness is what I appreciate most about her."
Thank you, Rhea, for your kindness, respect, and willingness to help out other team members with processes and training!
Janna Hiemstra - Le Mars, IA Service Administrator
The Le Mars dealership gets a special flair of helpfulness and teamwork with Janna on the team.
Janna’s “I can do that” attitude, with a smile and conviction, is one of the main reasons the staff enjoy working with her and customers appreciate her. She steps up to tackle any task at hand and makes sure the store is successful.
Whether it's helping plan a potluck for employees to come together and enjoy or helping a customer with any number of questions, Janna always has a smile and a good attitude. The team also appreciates her Halloween costumes, adding some fun to her and the team's work.
Thank you, Janna, for coming to work with a smile and helping to ensure the entire Le Mars store is successful!
Gina Zink - Brookings, SD Parts Sales Representative
"We can count on her to fill in wherever needed."
Gina has been with the Brookings dealership for a little over a year and has made a big impact in a short amount of time. Every customer who visits the store is greeted with a smile and a genuine hello from her, welcoming them into the space and allowing her to get right to answering their questions.
She prides herself on ensuring that the dealership, specifically the parts counter and showroom, is clean and tidy, and that it looks inviting to customers. She is very quick to answer every call at the parts counter, ensuring the customers get what they need quickly and with kindness. Her hard work shows every day in the dealership and with happy customers.
Thank you, Gina, for your constant helpfulness and genuine smile for our customers and team!
Dori Moe, Dixie Murch, Kayla Knudson, and Alex Paczkowski - SRC West Fargo, ND Accounts Information Team
A team made up of all women and a tight-knit group of ladies working together, that's the Accounts Information Team.
Dori, Dixie, Kayla, and Alex always have a great attitude when approaching tasks that involve critical behind-the-scenes work, managing customer accounts, and controlling payment methods. They have very quick response times to any and all requests and always complete them with helpfulness and kindness.
As they interact with a majority of the employees at Titan Machinery, as well as some vendors/customers, they are among the most cheerful employees, no matter what they are tackling. "I have never seen such a group of gals that got along so well and treated others so kindly the way they do as a whole."
The Accounts Information team is known for their kindness, especially when it comes to checking in on other teams and employees. During the 2020 Derecho that hit a majority of our Iowa dealerships, they reached out to make sure that many of them were okay after the storm. They show a focus on not only their team, but the Titan Machinery team as a whole.
Thank you, Dori, Dixie, Kayla, and Alex, for being a beacon of kindness and support amongst all of our teams!
Dori Moe, Dixie Murch (front), Kayla Knudson (behind), and Alex Paczkowski
Candy Johnson, Kathy LaDouceur, & Barb Johnson - Grand Forks, ND Store Administrator, Parts Sales Representative, & Service Administrator
A group of irreplaceable women who stand out in the agricultural industry in North Dakota and beyond.
Candy, Kathy, and Barb have really stood out in the Grand Forks, ND dealership as some of the women who get the work done and whom many other employees and team members turn to for answers.
Candy has been the store administrator for over 40 years! Everyone, from team members to customers, knows her and goes to her for whatever they need. She ensures that everything in the store gets done efficiently, thanks to her wealth of knowledge and cheerful attitude.Kathy has built a strong relationship with many customers, as she is sought out by many who come into the store. She is always working hard with a smile at the parts counter and excels at her daily work.
No one knows more about warranty than Barb does. She started her career as a teenager in Northwood and is the go-to person for warranty and application questions/tasks. So many individuals, from customers to team members, turn to her for her extensive knowledge base and can-do attitude.
Thank you, Candy, Kathy, and Barb, for continually supporting customers and team members with smiles and your extensive knowledge base!
Lexy Bradshaw Grand Forks General Manager, Candice Johnson, Barbara Johnson, and Kathy LaDouceur
Highlighting The Women of Titan Machinery
Thank you to the incredible women across Team Titan who help keep our dealerships and corporate teams moving forward every day. Your commitment to supporting customers, strengthening teams, and lifting those around you reflects the spirit of giving and collaboration that defines Titan Machinery.
A special shout-out goes to Tracy Papesh, Ryan Kelley, Gary Mohr, Emily Voelker, and Lexy Bradshaw, who took the time to recognize outstanding members of their own and other teams and celebrate the impact they make each day.
As we look beyond International Women’s Day 2026, Titan Machinery remains committed to creating opportunities for all employees to grow, contribute, and lead through collaboration year-round. Together, we continue working toward delivering exceptional service to our customers and communities across our footprint.