|
Synaptics Incorporated designs and delivers AI-native edge solutions, combining embedded compute, wireless connectivity, and multimodal sensing for intelligent, connected devices. The company serves global original equipment manufacturers (OEMs) with standard and custom silicon and software platforms across three primary markets: Core IoT Applications, Enterprise and Automotive Applications, and Mobile Applications. Key product lines include the Synaptics Astra family of AI processors, Veros wireless connectivity ICs, Natural ID biometric fingerprint sensors, and DisplayLink video interface solutions. Synaptics provides touch controllers, audio, speech, and vision processing technologies for applications in smart home, industrial, robotics, automotive, personal computers, and mobile devices. Founded in 1986, the company has expanded its portfolio through acquisitions including Renesas SP Drivers, Conexant, Marvell’s multimedia business, Broadcom’s wireless IoT business, DisplayLink, and DSP Group. In June 2026, Synaptics entered into a merger agreement with ON Semiconductor Corporation, under which it is expected to become a wholly-owned subsidiary of ON Semiconductor. Summarised from the company's own disclosures, fiscal year ended Aug 2026 |
Industry Semiconductors | Homepage synaptics.com |
| Sector Technology | IR page synaptics.com | |
|
Tags
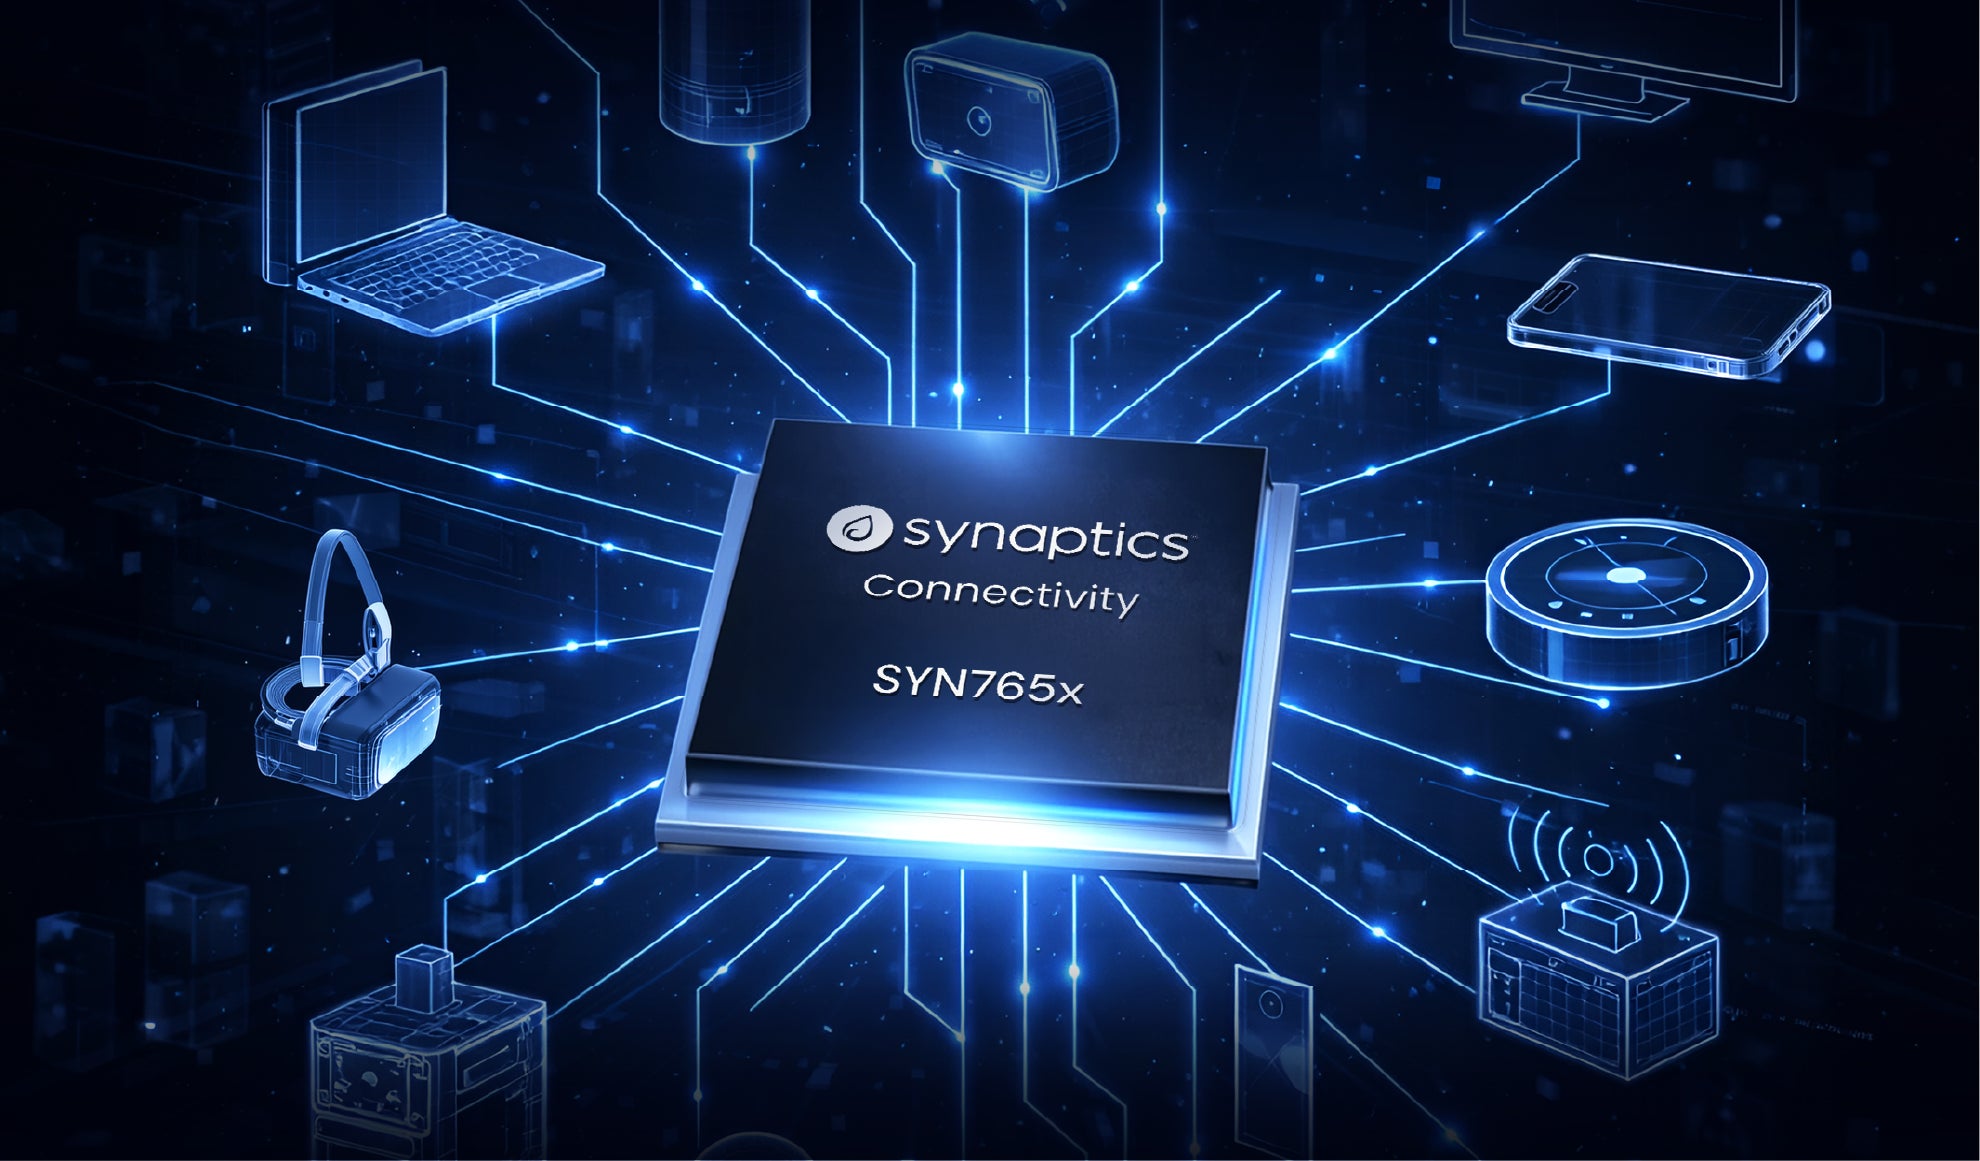
edge ai, touch controllers, biometrics, wireless connectivity, video interface, robotics, automotive electronics, iot, embedded processors, human interface technologies, Synaptics Astra, Veros, Natural ID, DisplayLink, Astra Machina, SL-Series, SR100 Series, Coralboard, Synaptics Connectivity
|
Press page synaptics.com/company/news |
Metrics
| Valuation | |
|---|---|
| Market cap | $ 4.667B |
| Market cap (USD) | $ 4.667B |
| P/E | -9.37 |
| PEG | — |
| P/BV | 5.08 |
| P/S | 3.89 |
| P/OCF | 45.00 |
| P/FCF | 72.02 |
| Dividend yield | — |
| Turnover / mcap | — |
| Returns | |
|---|---|
| ROE | -42.2% |
| ROI | -27.8% |
| ROIC | -2.8% |
| Profit margin | -41.0% |
| Growth | |
|---|---|
| Revenue growing | Yes |
| Profits growing | No |
| Revenue up 3y | No |
| Revenue up 5y | No |
| Earnings growth 3y (net profit CAGR) | — |
| Quality | |
|---|---|
| Profitable | No |
| Margin expanding | Yes |
| Buying back stock | No |
| Diluting (TTM) | Yes |
| Debt/Equity | 91.3% |
| Podcast bulls (TTM) | Sign up |
| Podcast bears (TTM) | Sign up |
| Podcast sentiment (TTM) | Sign up |
| Podcast sentiment % (TTM) | Sign up |
| News sentiment (TTM) | 29 |
| Quality score | -50.0% |
| Insiders | |
|---|---|
| Buys, 1w | Sign up |
| Buys, 1m | Sign up |
| Buys, 1y | Sign up |
| Sells, 1w | Sign up |
| Sells, 1m | Sign up |
| Sells, 1y | Sign up |
Sign up to see this company's insider trades
| Figure | FY 2026 | FY 2025 | FY 2024 | FY 2023 | FY 2022 | FY 2021 | FY 2020 | FY 2019 | FY 2018 | FY 2017 | FY 2016 | FY 2015 | FY 2014 | FY 2013 | FY 2012 | FY 2011 | FY 2010 | FY 2009 | FY 2008 | FY 2007 | FY 2006 | FY 2005 | FY 2004 | FY 2003 | FY 2002 | FY 2001 |
|---|---|---|---|---|---|---|---|---|---|---|---|---|---|---|---|---|---|---|---|---|---|---|---|---|---|---|
| Revenue | 1.197B | 1.074B | 959.4M | 1.355B | 1.74B | 1.34B | 1.334B | 1.472B | 1.63B | 1.718B | 1.667B | 1.703B | 947.539M | 663.588M | 548.228M | 598.538M | 514.89M | 473.302M | 361.057M | 266.787M | 184.557M | 208.139M | 133.276M | 100.701M | 100.201M | 73.698M |
| Net profit | -490.8M | -47.8M | 125.6M | 73.6M | 257.5M | 79.6M | 118.8M | -22.9M | -124.1M | 48.8M | 72.2M | 110.4M | 46.689M | 98.933M | 54.144M | 63.796M | 52.965M | 54.324M | 31.1M | 26.534M | 13.701M | 37.985M | 12.992M | 7.718M | 9.4M | 810K |
| Free cash flow | 101.4M | 116.2M | 102.1M | 297.3M | 431.6M | 298.1M | 205.5M | 130.5M | 110.9M | 121.5M | 228M | 152.2M | 92.921M | 53.638M | 91.034M | 78.143M | 104.941M | 72.281M | 69.321M | 20.502M | 21.709M | 28.698M | 13.874M | 10.358M | 11.553M | -3.277M |
| Figure | FY 2026 | FY 2025 | FY 2024 | FY 2023 | FY 2022 | FY 2021 | FY 2020 | FY 2019 | FY 2018 | FY 2017 | FY 2016 | FY 2015 | FY 2014 | FY 2013 | FY 2012 | FY 2011 | FY 2010 | FY 2009 | FY 2008 | FY 2007 | FY 2006 | FY 2005 | FY 2004 | FY 2003 | FY 2002 | FY 2001 |
|---|---|---|---|---|---|---|---|---|---|---|---|---|---|---|---|---|---|---|---|---|---|---|---|---|---|---|
| Share price | 124.23 | 64.82 | 88.2 | 85.38 | 118.05 | 155.58 | 60.12 | 29.14 | 50.37 | 51.71 | 53.75 | 86.73 | 90.64 | 38.56 | 28.62 | 25.89 | 29.19 | 38.55 | 34.54 | 36.34 | 21.16 | — | — | — | — | — |
| Price performance 12m | 0.92 | -0.27 | 0.03 | -0.28 | -0.24 | 1.59 | 1.06 | -0.42 | -0.03 | -0.04 | -0.38 | -0.04 | 1.35 | 0.35 | 0.11 | -0.11 | -0.24 | 0.12 | -0.05 | 0.72 | — | — | — | — | — | — |
Filed figures
Lines the statements and their notes report beside the headline figures, read from the filings' XBRL as filed (no restatement applied), with figures computed from one filing's own lines. Cash-flow lines carry their cash direction: an outflow is negative. Each period links to its filing; a figure's period, report date and tag are in its tooltip.
| Figure | Jun 2017 | Jun 2018 | Jun 2019 | Jun 2020 | Jun 2021 | Jun 2022 | Jun 2023 | Jun 2024 | Jun 2025 | Jun 2026 |
|---|---|---|---|---|---|---|---|---|---|---|
| Balance sheet detail | ||||||||||
| Trade receivables (USD) | 255M | 289M | 230M | 195M | 228M | 322M | 164M | 142M | 130M | 164M |
| ↳ YoY growth | +1.0% | +13.3% | -20.4% | -15.1% | +16.9% | +41.1% | -49.1% | -13.1% | -8.5% | +25.9% |
| ↳ 5y CAGR | +19.6% | +14.3% | +3.4% | -9.7% | -2.0% | +4.8% | -10.7% | -9.1% | -7.8% | -6.4% |
| Borrowings, current (USD) | 15M | — | — | — | — | 6M | 6M | 6M | 0.00 | 440M |
| Borrowings, non-current (USD) | 202M | — | — | 100M | 394M | 976M | 972M | 967M | 835M | 398M |
| Lease liabilities (USD) | — | — | 28.4M | 21.1M | 33.3M | 59.1M | 51.4M | 49.4M | 48.1M | 39.5M |
| Cash and deposits (USD) | 368M | 301M | 328M | 763M | 836M | 824M | 925M | 877M | 392M | 443M |
| Intangible assets (USD) | 101M | 219M | 145M | 93.4M | 302M | 390M | 299M | 288M | 262M | 188M |
| Right-of-use assets (USD) | — | — | 27.8M | 21M | 31.7M | 61.2M | 49M | 46.8M | 45.2M | 37.1M |
| Net debt (borrowings + leases - cash) (USD) | -151M | — | — | -642M | -409M | 217M | 105M | 145M | 491M | 434M |
| Cash flow detail | ||||||||||
| Operating cash flow (USD) | 153M | 145M | 154M | 222M | 319M | 463M | 332M | 136M | 142M | 149M |
| Purchases of property, plant and equipment (USD) | -31.4M | -34.1M | -23.7M | -16.3M | -21.1M | -31.1M | -34.2M | -33.8M | -25.8M | -48M |
| Purchases of intangible assets (USD) | — | -7.7M | — | 0.00 | 0.00 | -30M | 0.00 | -13.5M | -10M | 0.00 |
| Change in receivables (cash effect) (USD) | -2.6M | -22.7M | 64.3M | 31M | -25.9M | -81.1M | 161M | 22.4M | 12.3M | -33.7M |
| Change in inventories (cash effect) (USD) | 15M | 79.5M | -27.5M | 43M | 53.1M | -65.1M | 24.6M | 6.5M | -25.1M | -17.1M |
| Change in payables (cash effect) (USD) | -38.4M | 6.2M | -55.8M | -36.2M | 32.2M | 23.2M | -95.6M | 38.9M | 10.8M | -13.7M |
| Share buybacks (cash effect) (USD) | -88M | -93.6M | -119M | -30.2M | 0.00 | 0.00 | -184M | 0.00 | -128M | -92.7M |
| Interest paid (cash effect) (USD) | -6M | -3.8M | -3.6M | -3.7M | -9.6M | -25M | -51.9M | -63.4M | -38.7M | -20.5M |
| Income taxes paid (cash effect) (USD) | -22.1M | -26.4M | -16.4M | -18.9M | -39.7M | -42M | -91.4M | -55.2M | -47.2M | -3.2M |
| Share-based compensation (USD) | 61.8M | 71.3M | 59M | 49.3M | 66.1M | 101M | 122M | 119M | 113M | 149M |
| Operating cash flow before change in receivables (USD) | 156M | 168M | 89.9M | 191M | 345M | 544M | 170M | 114M | 130M | 183M |
| Free cash flow (OCF - PPE - intangibles) (USD) | 122M | 103M | 131M | 206M | 298M | 402M | 297M | 88.6M | 106M | 101M |
| Income detail | ||||||||||
| Research and development expense (USD) | 292M | 363M | 341M | 303M | 313M | 367M | 351M | 336M | 347M | 382M |
| ↳ 5y CAGR | +19.9% | +20.2% | +12.1% | +0.6% | +0.1% | +4.7% | -0.7% | -0.3% | +2.8% | +4.0% |
| Total comprehensive income (USD) | 47M | -124M | -24.4M | 119M | 79.6M | 256M | 75.4M | 126M | -47.8M | -491M |
| Comprehensive income to owners (USD) | 47M | -124M | -24.4M | 119M | 79.6M | 256M | 75.4M | 126M | -47.8M | -491M |
| Provision for credit losses (USD) | — | — | — | 3.7M | 0.00 | — | — | — | — | — |
| Credit cost ratio (credit losses / average receivables) (%) | — | — | — | 1.7% | 0.0% | — | — | — | — | — |
| Reported | Aug 18, 2017 | Aug 24, 2018 | Nov 7, 2019 | Aug 22, 2022 | Aug 22, 2022 | Aug 18, 2023 | Aug 21, 2025 | Aug 21, 2025 | Aug 10, 2026 | Aug 10, 2026 |
Sign up to see institutional holdings
Sign UpPodcast Mentions
Sign up to see podcast mentions and sentiment
Sign UpMaterial events reported to the SEC on Form 8-K or 6-K, newest first. The link opens the filing itself on EDGAR. Press releases from the company's own website, newest first.
Q1'27 Financial Results
•Revenue of $294.0 million, up 1% year-over-year
•GAAP gross margin of 47.8%
•Non-GAAP gross margin of 54.3%
•GAAP loss per share of $0.45
•Non-GAAP diluted earnings per share of $1.26
Key Business Highlights
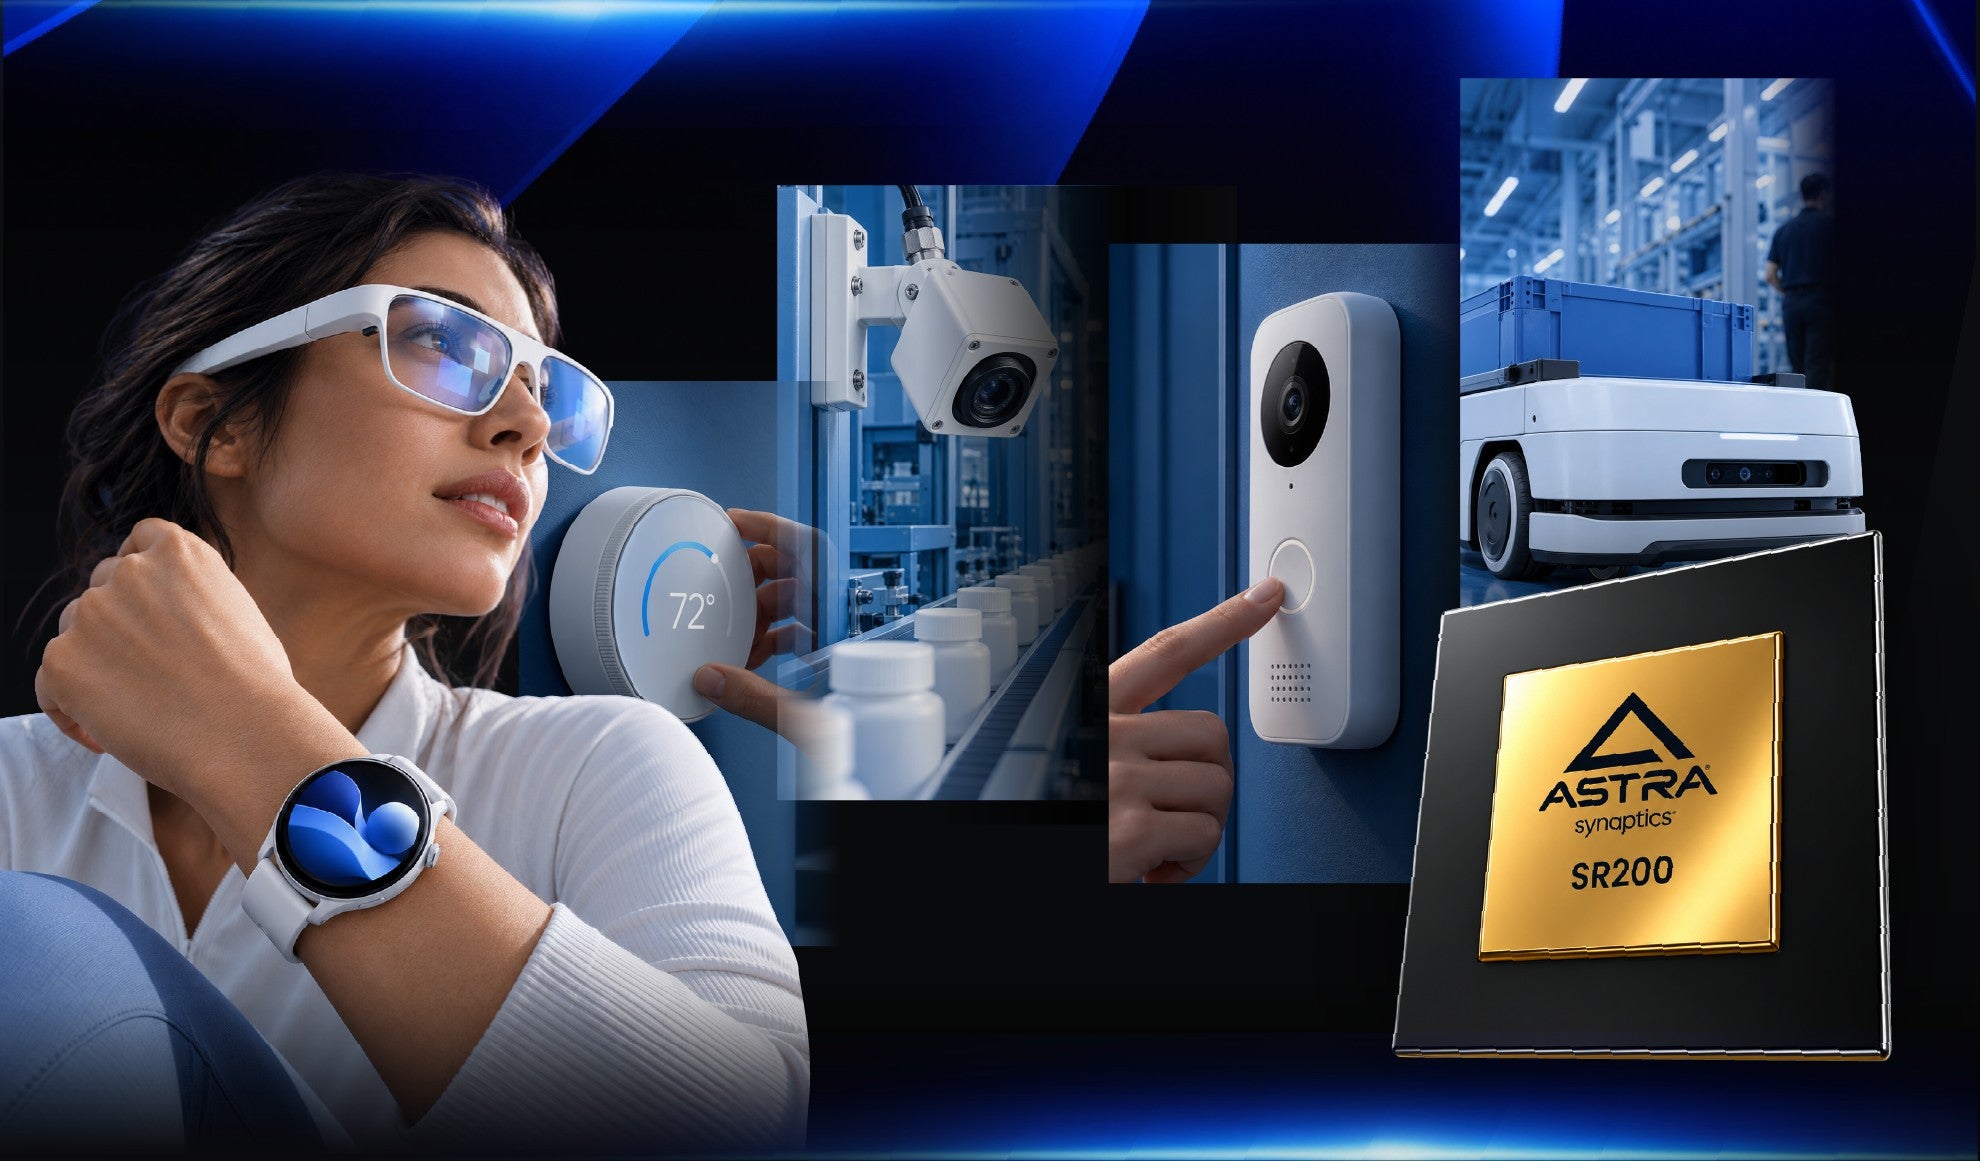
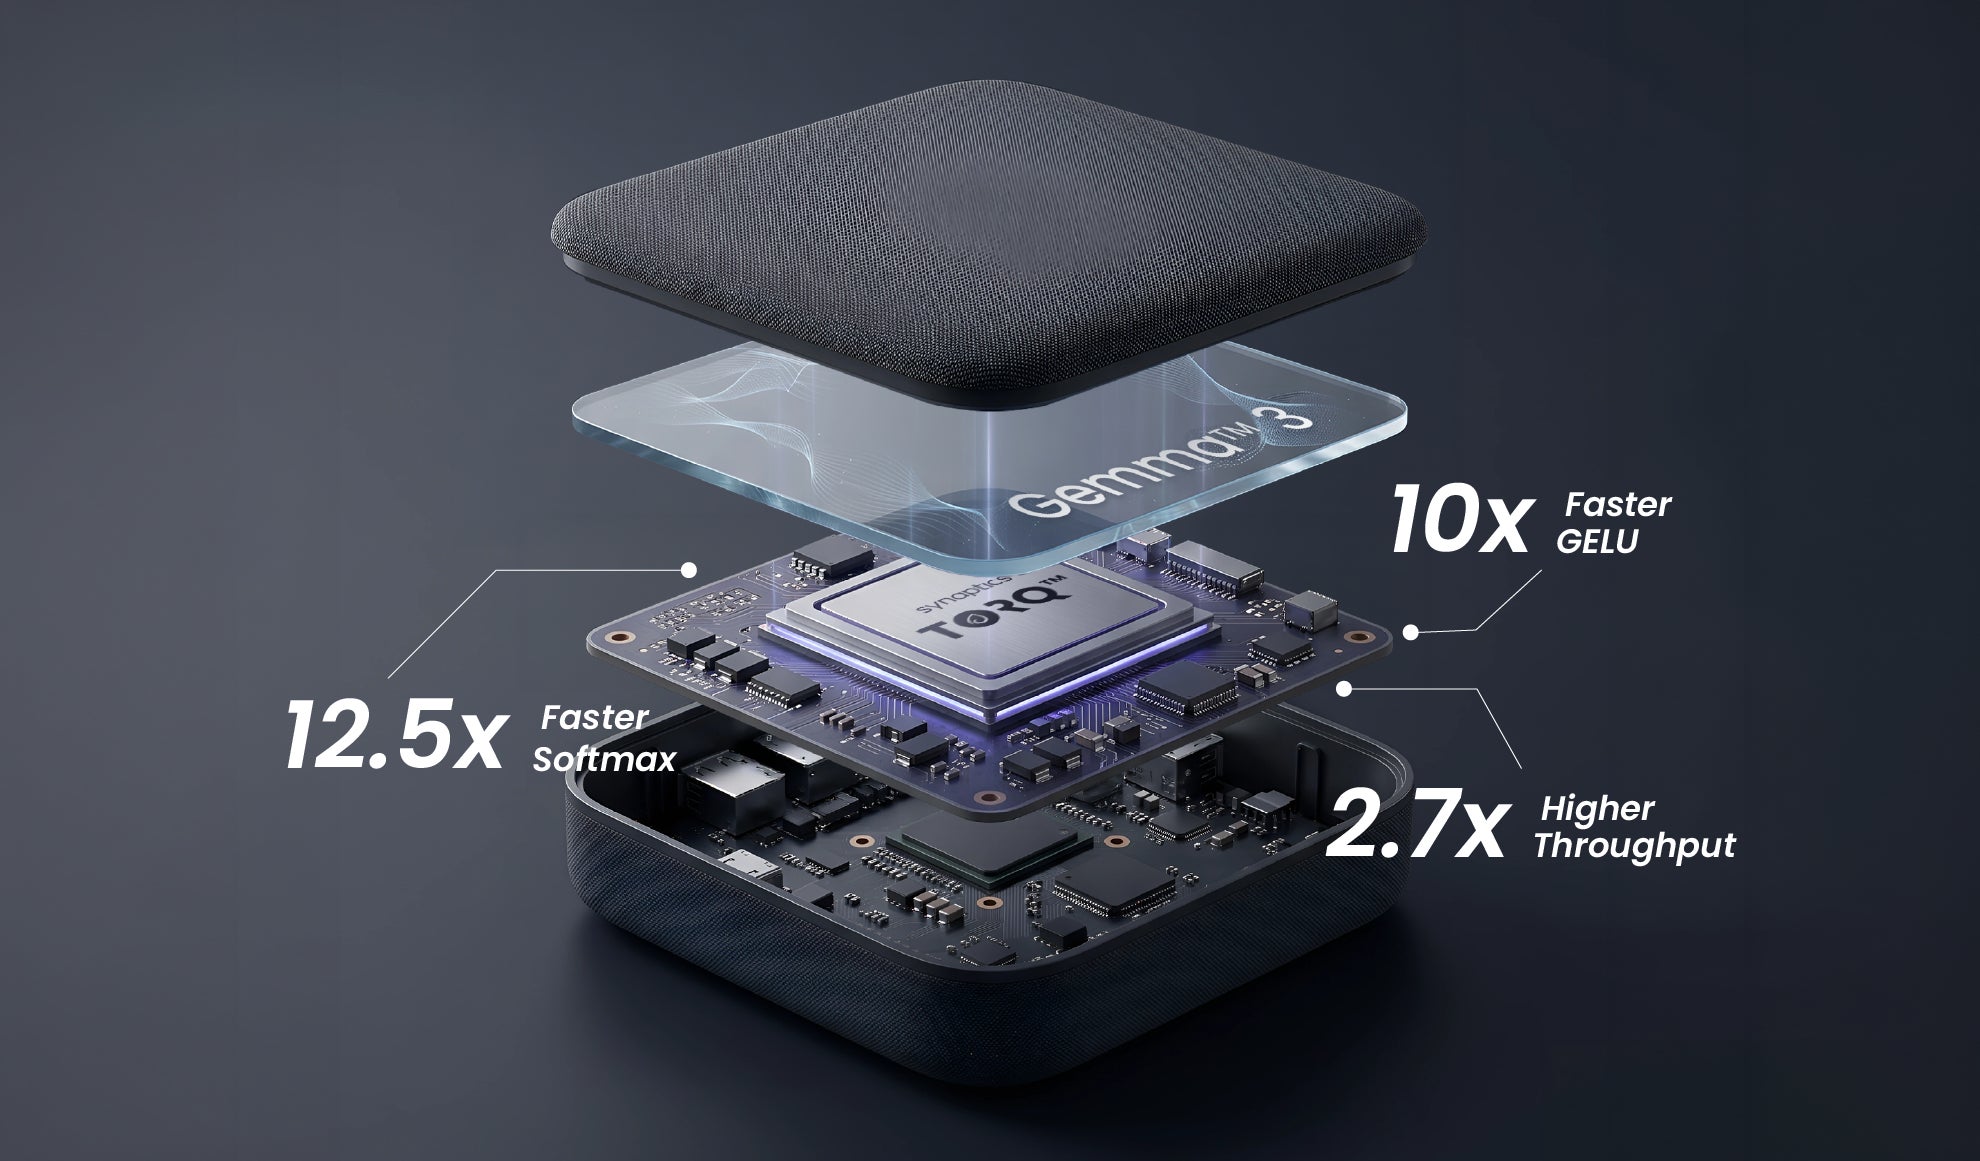
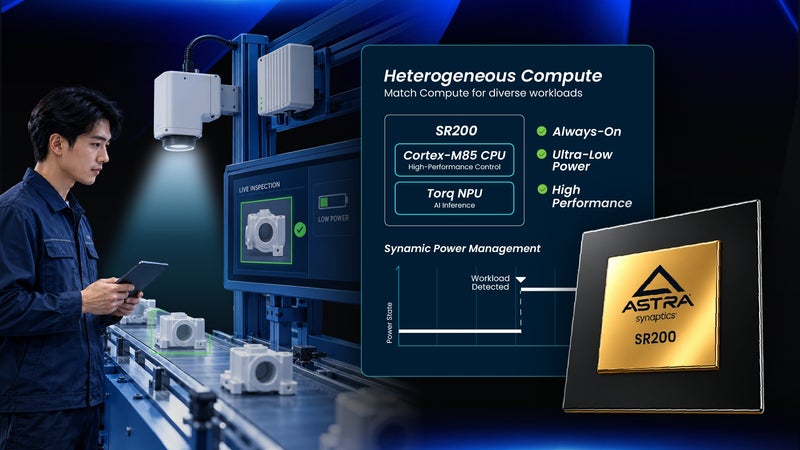
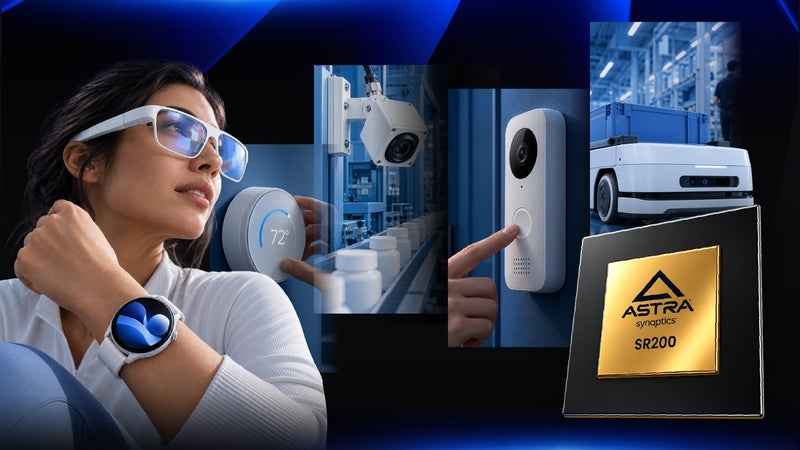
•Introduced the xMCU, a new class of microcontrollers, with the launch of the Synaptics Astra SR200 series, enabling larger AI models and richer multimodal workloads to run entirely on-device.
•Expanded the Synaptics Coralboard ecosystem in partnership with Google Research, making it generally available through our partners.
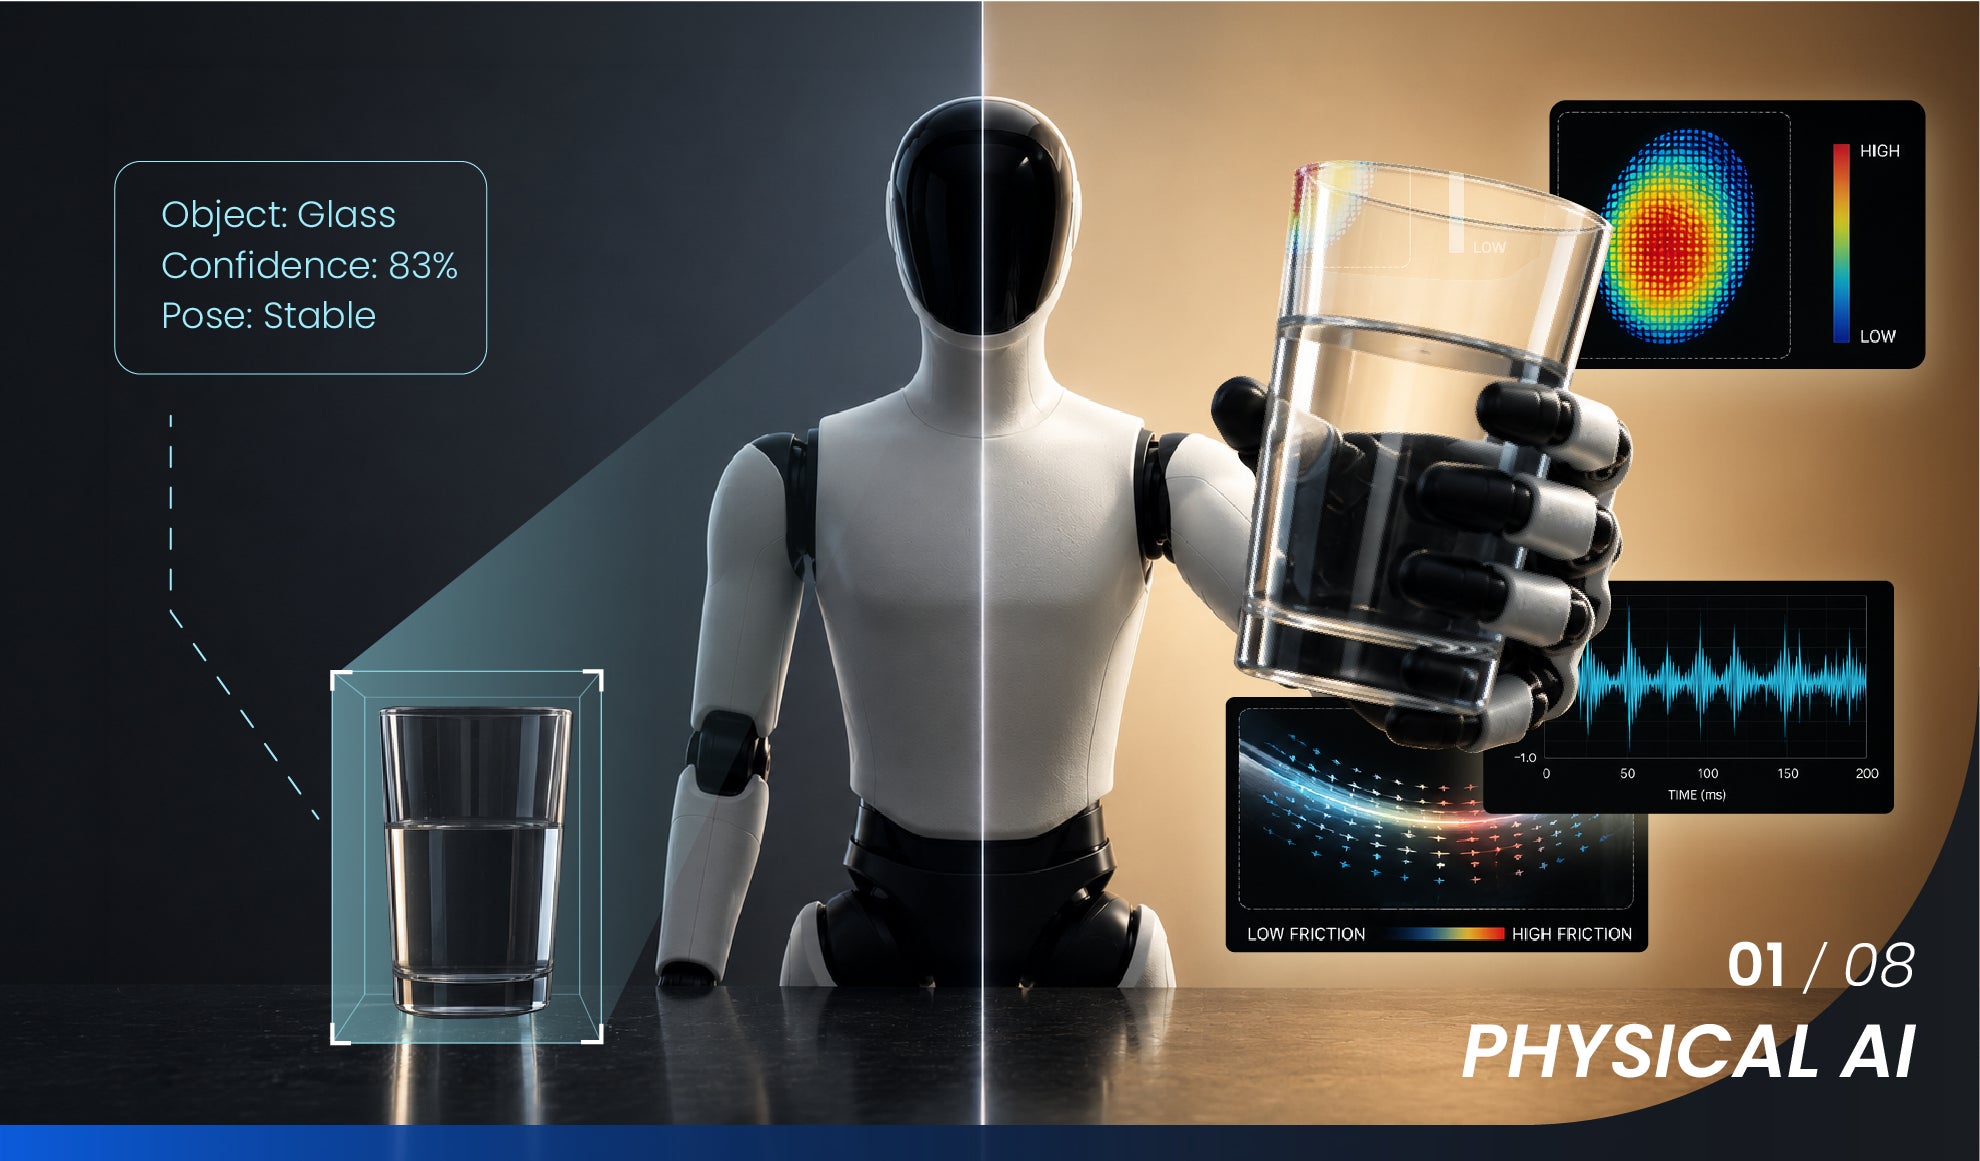
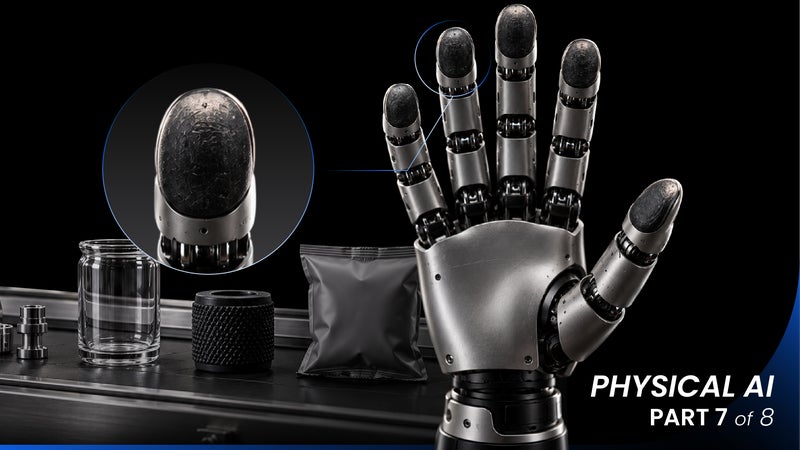
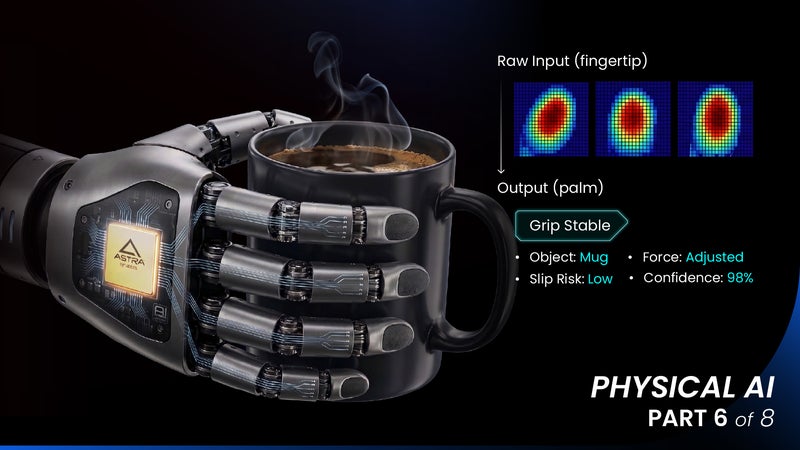
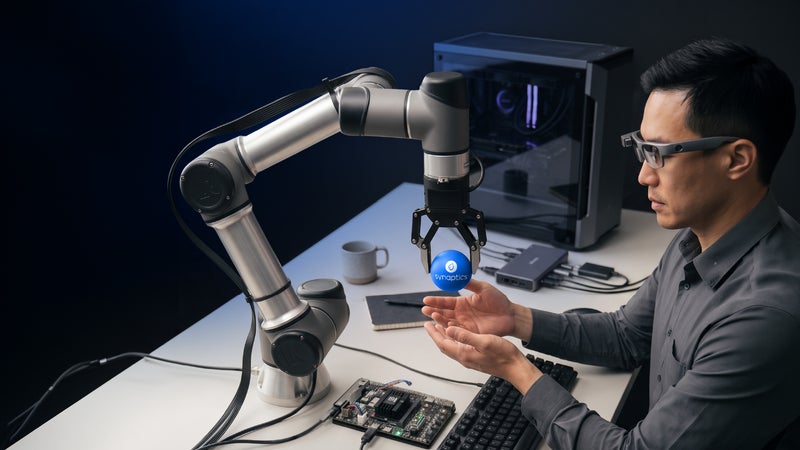
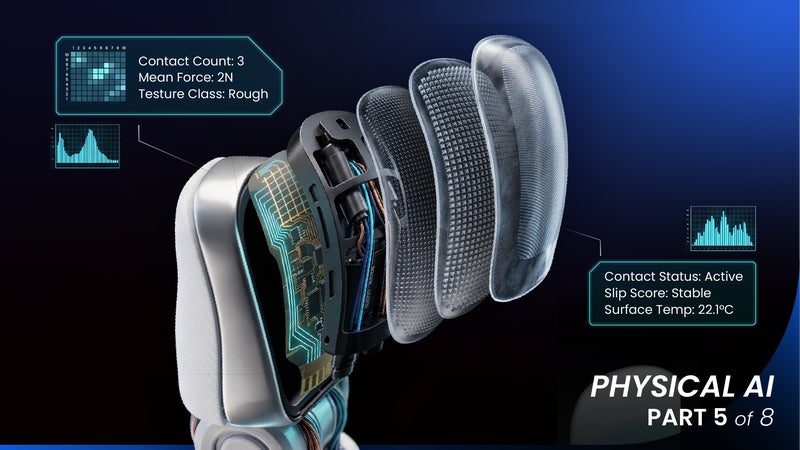
•Announced Synaptics' capacitive tactile sensing (CTS) module and Astra Edge AI processors are now supported by NVIDIA Isaac Sim and Holoscan platforms, enabling the processing of multi-sensory modalities.
SAN JOSE, Calif., – November 5, 2026 – Synaptics Incorporated (Nasdaq: SYNA) today reported financial results for its first quarter of fiscal 2027 ended September 26, 2026.
Net revenue for the first quarter of fiscal 2027 was $294.0 million. GAAP net loss for the first quarter of fiscal 2027 was $17.7 million, or a loss of $0.45 per basic share.
As described in Item 5.07 below, Synaptics Incorporated (the “Company,” “we” or “us”) held its 2026 Annual Meeting of Stockholders (the “Annual Meeting”) on October 27, 2026. At the Annual Meeting, our stockholders approved an amendment and restatement of our Amended and Restated 2019 Equity and Incentive Compensation Plan that provides for an increase of 1,000,000 shares of our common stock authorized for issuance thereunder (as amended and restated, the “2019 Plan”). Our named executive officers are eligible to participate in the 2019 Plan. Our Board of Directors approved the 2019 Plan on July 28, 2026, subject to stockholder approval at the Annual Meeting. A summary of the material terms of the 2019 Plan is set forth under the caption “Proposal Three: Approval of the Amended and Restated 2019 Equity and Incentive Compensation Plan” in the Company’s Definitive Proxy Statement on Schedule 14A filed with the Securities and Exchange Commission (the “Commission”) on September 15, 2026.



























Prompts
Click prompts to add them under the company line, click again to take one out, then copy the result into your AI chat. Shared by Asian Century Stocks and Uncovered Thai Stocks. Thank you.
ETFs Holding Synaptics Incorporated
Exchange-traded funds whose newest published daily portfolio holds one of the company's listings, largest weight first.
| ETF | Weight in ETF | Shares | Market value | As of |
|---|---|---|---|---|
| ALIL | 1.87% | 3,279 | $ 380K | Nov 18, 2026 |
| ESSC | 0.53% | 1,785 | $ 191.566K | Jul 31, 2026 |
| SCDS | 0.48% | 372 | $ 43.658K | Nov 17, 2026 |
| IVSS | 0.28% | 615 | $ 76.401K | Jun 30, 2026 |
| TMSL | 0.23% | 50,907 | $ 6.324M | Jun 30, 2026 |
| AVSC | 0.23% | 63,084 | $ 7.414M | Nov 16, 2026 |
| RESM | 0.21% | 61 | $ 7,578.03 | Jun 30, 2026 |
| JSTC | 0.16% | 4,094 | $ 481.127K | Nov 17, 2026 |
| MSSM | 0.15% | 10,840 | $ 1.048M | Aug 31, 2026 |
| MKTN | 0.14% | 1,193 | $ 148.206K | Jun 30, 2026 |
| DFAC | 0.03% | 186,954 | $ 22.057M | Nov 12, 2026 |
| DFSU | 0.02% | 3,821 | $ 450.802K | Nov 12, 2026 |
| DCOR | 0.01% | 52,643 | $ 6.211M | Nov 12, 2026 |
| DFUV | 0.01% | 15,718 | $ 1.854M | Nov 12, 2026 |
| DXUV | 0.01% | 5,971 | $ 704.459K | Nov 12, 2026 |
| AVUS | 0.01% | 9,501 | $ 1.117M | Nov 16, 2026 |
| DFAU | 0.01% | 9,334 | $ 1.101M | Nov 12, 2026 |
| DFUS | 0.01% | 11,730 | $ 1.384M | Nov 12, 2026 |
| EBI | 0.01% | 373 | $ 36.077K | Aug 31, 2026 |
| DFAT | 0.00% | 10,601 | $ 1.251M | Nov 12, 2026 |
| AVSU | 0.00% | 24 | $ 2,820.48 | Nov 16, 2026 |