Stagwell Media Names Kate Richling as Chief Brand and Communications Officer
Bull 0
Bear 0
Management
STGW
|
Stagwell Inc. is a digital-first global marketing network that provides creative, media, and technology solutions for B2C, B2B, and direct-to-consumer brands. The company operates through business segments including Marketing Services, Digital Transformation, Media & Commerce, and Communications, which encompasses advocacy services. Its proprietary technology platform, The Marketing Cloud, offers software-as-a-service and data-as-a-service tools for research, insights, and media management. Stagwell partners with technology firms such as Palantir and Adobe to develop AI-driven marketing solutions, including The Machine, an agentic operating system. The company’s portfolio includes agency brands such as Crispin Brazil, Code and Theory, and Veritas, alongside the Doner Partners Network. Stagwell competes with major global holding companies and independent agencies, focusing on integrating performance, research, and measurement into its marketing strategies. Summarised from the company's own disclosures, fiscal year ended Mar 2026 |
Industry Advertising Agencies | Homepage stagwellglobal.com |
| Sector Communication Services | IR page stagwellglobal.com/investors | |
|
Tags
digital marketing, creative services, media buying, public affairs, advocacy, marketing technology, artificial intelligence, data analytics, brand strategy, digital transformation, The Marketing Cloud, The Machine, Crispin Brazil, Code and Theory, Veritas, Doner Partners Network, Stagwell Global Solutions, Stagwell Brazil/Latam
|
Press page stagwellglobal.com/news |
Metrics
| Valuation | |
|---|---|
| Market cap | $ 2.673B |
| Market cap (USD) | $ 2.673B |
| P/E | 275.90 |
| PEG | 125.92 |
| P/BV | 3.85 |
| P/S | 0.86 |
| P/OCF | 6.48 |
| P/FCF | 7.27 |
| Dividend yield | 2.8% |
| Turnover / mcap | — |
| Returns | |
|---|---|
| ROE | 5.3% |
| ROI | 1.4% |
| ROIC | 3.8% |
| Profit margin | 1.0% |
| Growth | |
|---|---|
| Revenue growing | Yes |
| Profits growing | Yes |
| Revenue up 3y | No |
| Revenue up 5y | No |
| Earnings growth 3y (net profit CAGR) | 2.2% |
| Quality | |
|---|---|
| Profitable | Yes |
| Margin expanding | Yes |
| Buying back stock | No |
| Diluting (TTM) | No |
| Debt/Equity | 203.8% |
| Podcast bulls (TTM) | Sign up |
| Podcast bears (TTM) | Sign up |
| Podcast sentiment (TTM) | Sign up |
| Podcast sentiment % (TTM) | Sign up |
| News sentiment (TTM) | 29 |
| Quality score | 26.3% |
| Insiders | |
|---|---|
| Buys, 1w | Sign up |
| Buys, 1m | Sign up |
| Buys, 1y | Sign up |
| Sells, 1w | Sign up |
| Sells, 1m | Sign up |
| Sells, 1y | Sign up |
Sign up to see this company's insider trades
| Figure | FY 2025 | FY 2024 | FY 2023 | FY 2022 | FY 2021 | FY 2020 | FY 2019 | FY 2018 | FY 2017 | FY 2016 | FY 2015 | FY 2014 | FY 2013 | FY 2012 | FY 2011 | FY 2010 | FY 2009 | FY 2008 | FY 2007 | FY 2006 | FY 2005 | FY 2004 | FY 2003 |
|---|---|---|---|---|---|---|---|---|---|---|---|---|---|---|---|---|---|---|---|---|---|---|---|
| Revenue | 2.909B | 2.841B | 2.527B | 2.688B | 1.469B | 1.199B | 1.416B | 1.476B | 1.514B | 1.386B | 1.326B | 1.224B | 1.149B | 1.071B | 943.274M | 689.146M | 545.924M | 584.648M | 547.319M | 423.671M | 443.462M | 316.812M | 278.777M |
| Net profit | 29.101M | 2.259M | 134K | 27.269M | 21.036M | -228.971M | -4.69M | -123.733M | 241.848M | -47.942M | -37.357M | -24.057M | -148.863M | -85.439M | -84.674M | -15.44M | -18.324M | — | -26.355M | -33.539M | -7.949M | -2.157M | 12.431M |
| Free cash flow | 247.287M | 123.947M | 66.769M | 324.923M | 178.23M | 8.249M | 67.943M | -2.984M | 82.327M | -24.008M | 139.23M | 107.526M | 39.75M | 55.969M | -18.835M | 26.163M | 53.691M | 43.051M | -15.94M | 17.057M | -8.425M | 8.95M | -3.466M |
| Figure | FY 2025 | FY 2024 | FY 2023 | FY 2022 | FY 2021 | FY 2020 | FY 2019 | FY 2018 | FY 2017 | FY 2016 | FY 2015 | FY 2014 | FY 2013 | FY 2012 | FY 2011 | FY 2010 | FY 2009 | FY 2008 | FY 2007 | FY 2006 | FY 2005 | FY 2004 | FY 2003 |
|---|---|---|---|---|---|---|---|---|---|---|---|---|---|---|---|---|---|---|---|---|---|---|---|
| Share price | 4.89 | 6.58 | 6.63 | 6.21 | 8.67 | — | — | — | — | — | — | — | — | — | — | — | — | — | — | — | — | — | — |
| Price performance 12m | -0.26 | -0.01 | 0.07 | -0.28 | — | — | — | — | — | — | — | — | — | — | — | — | — | — | — | — | — | — | — |
Filed figures
Lines the statements and their notes report beside the headline figures, read from the filings' XBRL as filed (no restatement applied), with figures computed from one filing's own lines. Cash-flow lines carry their cash direction: an outflow is negative. Each period links to its filing; a figure's period, report date and tag are in its tooltip.
| Figure | Dec 2016 | Dec 2017 | Dec 2018 | Dec 2019 | Dec 2020 | Dec 2021 | Dec 2022 | Dec 2023 | Dec 2024 | Dec 2025 |
|---|---|---|---|---|---|---|---|---|---|---|
| Balance sheet detail | ||||||||||
| Trade receivables (USD) | 388M | 434M | 395M | 450M | 375M | 697M | 646M | 697M | 716M | 736M |
| ↳ YoY growth | +7.6% | +11.8% | -9.0% | +14.0% | -16.8% | +85.9% | -7.3% | +7.9% | +2.8% | +2.7% |
| ↳ 5y CAGR | +10.2% | +5.9% | +5.0% | +4.9% | +0.8% | +12.4% | +8.3% | +12.0% | +9.7% | +14.4% |
| Borrowings, current (USD) | 228,000 | 313,000 | 356,000 | — | 994,000 | 0.00 | — | — | — | — |
| Borrowings, non-current (USD) | 936M | 883M | 954M | 888M | 843M | 1.19B | 1.18B | 1.15B | 1.35B | 1.33B |
| Lease liabilities (USD) | — | — | 0.00 | 268M | 288M | 415M | 370M | 347M | 306M | 280M |
| Cash and deposits (USD) | 27.9M | 46.2M | 30.9M | 107M | 60.8M | 184M | 221M | 120M | 131M | 105M |
| Intangible assets (USD) | 85.1M | 70.6M | 67.8M | 54.9M | 33.8M | 938M | 908M | 818M | 837M | 834M |
| Right-of-use assets (USD) | — | — | 0.00 | 224M | 214M | 312M | 274M | 254M | 219M | 214M |
| Net debt (borrowings + leases - cash) (USD) | 909M | 837M | 924M | 1.05B | 1.07B | 1.42B | 1.33B | 1.37B | 1.53B | 1.5B |
| Cash flow detail | ||||||||||
| Operating cash flow (USD) | 5.42M | 115M | 17.3M | 86.5M | 32.6M | 201M | 348M | 81M | 143M | 291M |
| Purchases of property, plant and equipment (USD) | -29.4M | -33M | -20.3M | -18.6M | -24.3M | -22.6M | -22.7M | -14.2M | -18.9M | -43.7M |
| Change in receivables (cash effect) (USD) | -16.8M | -50M | 30.2M | -37.8M | 72.5M | -30.8M | 37.8M | -58.7M | 8.47M | 28.8M |
| Change in inventories (cash effect) (USD) | 13M | 1.89M | -11.2M | — | — | — | — | — | — | — |
| Dividends paid (cash effect) (USD) | -32.9M | -284,000 | -196,000 | -56,000 | — | — | — | — | — | — |
| Share buybacks (cash effect) (USD) | -3.35M | -1.76M | -776,000 | -601,000 | 0.00 | -841,000 | -18.7M | -224M | -108M | -134M |
| Interest paid (cash effect) (USD) | -64.7M | -62.9M | -64M | -62.2M | -57.8M | -23.5M | -70.9M | -87.1M | -91.1M | -94.4M |
| Income taxes paid (cash effect) (USD) | -2.9M | -8.1M | -3.84M | -2.3M | -7.95M | -58.6M | -46.3M | -45.5M | -23.9M | -23M |
| Share-based compensation (USD) | 21M | 24.4M | 18.4M | 31M | 14.2M | 75M | 33.2M | 57.2M | 52.2M | 54.1M |
| Operating cash flow before change in receivables (USD) | 22.2M | 165M | -12.9M | 124M | -39.9M | 232M | 310M | 140M | 134M | 262M |
| Free cash flow (OCF - PPE - intangibles) (USD) | -24M | 82.3M | -2.98M | 67.9M | 8.25M | 178M | 325M | 66.8M | 124M | 247M |
| Income detail | ||||||||||
| Total comprehensive income (USD) | -50.4M | 259M | -108M | 2.86M | -199M | 30.6M | 32.2M | 50M | -1.23M | 66.9M |
| Comprehensive income to owners (USD) | -56M | 242M | -117M | -13.7M | -222M | 15.8M | -6.39M | 2.55M | -8.45M | 59.3M |
| Reported | Mar 1, 2017 | Mar 1, 2018 | May 9, 2019 | Mar 5, 2020 | Mar 17, 2022 | Mar 17, 2022 | Mar 6, 2023 | Mar 11, 2024 | Mar 11, 2025 | Mar 13, 2026 |
Sign up to see institutional holdings
Sign UpPodcast Mentions
Sign up to see podcast mentions and sentiment
Sign UpMaterial events reported to the SEC on Form 8-K or 6-K, newest first. The link opens the filing itself on EDGAR. Press releases from the company's own website, newest first.
Stagwell Launches Stagwell AI, Its Unified Custom Portfolio of Agentic Marketing Solutions
Bull 2
Bear 0
Product/operations
On:
PR Contact:
Kara Gelber
Building on Stagwell’s ongoing investment in AI, the portfolio brings together rebranded and new solutions under one masterbrand to streamline AI product go-to-market strategy and transform marketing for businesses of all sizes
**NEW YORK CITY, NY / ACCESS Newswire / October 20, 2026 /**Stagwell (NASDAQ:STGW), the global challenger network transforming marketing through AI, today announced the launch of Stagwell AI, its unified and expanded custom portfolio of agentic marketing solutions under a single masterbrand. Created to transform marketing for businesses of any size and on any tech stack, it is the only agentic portfolio that allows businesses the flexibility to adopt the solutions they need, integrate with the technology they already use, and accelerate growth. Stagwell AI streamlines the company’s AI go-to-market strategy, building on Stagwell’s ongoing investment in agentic technology with an expanded family of enterprise products and a fully self-service offering for small and medium-sized businesses. A multimillion-dollar advertising campaign will support the launch, building awareness among prospective clients and investors, and driving demand for the portfolio’s solutions.
Bringing together technology from across the Stagwell network-including its award-winning digital transformation agency Code and Theory, The Marketing Cloud, and Stagwell Media Platform-Stagwell AI addresses growing market demand for practical applications of agentic technology in a fragmented marketing landscape. Rather than delivering a single standalone system, the portfolio gives clients the flexibility to adopt individual products, integrate them into existing workflows, or use them together as an orchestrated system, with AI agents helping connect capabilities and coordinate execution along the way. To help brands explore these offerings, the new Stagwell AI website features a voice-enabled agentic experience that guides visitors to solutions relevant to their business and marketing needs. Built by practitioners for practitioners, the solutions combine Stagwell’s marketing expertise with capabilities from leading technology partners, including Palantir and Adobe.
“Stagwell has been investing in AI and building next-generation agentic marketing technology for years, and Stagwell AI is a culmination of that work,” said Mark Penn, Chairman and CEO of Stagwell. “Our cutting-edge agentic solutions are second to none and give businesses more ways to put AI to work – no matter the scale or marketing need. We’re shaping the future of marketing here and showing investors the innovation behind our growth strategy.”
The portfolio includes Stagwell Machines, a family of enterprise-grade agentic products built for organizations with scale, complexity, and existing infrastructure. The Machine OS-formerly The Machine built by Code and Theory-connects Machines, agents, and workflows within existing tools, preserving context across teams and turning decisions into coordinated action. The expanded family of Machines includes The Targeting Machine-formerly Stagwell Agentic Targeting System (SATS)-an audience intelligence platform powered by the Stagwell ID Graph that combines first-party and proprietary data with behavioral and attitudinal signals to uncover new audiences and build addressable segments; The Knowledge Machine, a decision intelligence platform for communications leaders; and The Media Machine, a full lifecycle agentic media operating system built by GALE that accelerates optimization, maximizes media investment efficiency, and drives higher-quality audience engagement across platforms. Together, the Machines connect data, decisions and execution to support continuous learning and seamless marketing performance.
For enterprise and mid-market teams tackling specific marketing challenges, Stagwell AI offers purpose-built, established agentic solutions across research, communications, media, data and AI productivity. These solutions help teams turn audience and market signals into actionable insights, strengthen communications, improve media performance, and automate workflows. Rather than requiring a full technology stack overhaul, they give marketers targeted ways to apply AI and agents to specific business needs, supporting faster decisions and execution within the systems they already use.
Stagwell AI also introduces NEW by Stagwell AI, a fully self-service offering designed to help small and medium-sized businesses plan, create, launch, and optimize their marketing to drive growth. Its capabilities span competitive intelligence, brand visibility in AI search, AI-powered video ad creation, influencer discovery, campaign management and ROI tracking, journalist databases and media outreach, and AI voice agents for sales and customer engagement-from appointment booking to support and retention.
Together, the enterprise, mid-market and self-service offerings extend the portfolio’s reach across businesses with different needs, resources and levels of complexity.
“Businesses need technology that addresses specific challenges and fits the way they work,” said Elspeth Rollert, CEO of The Marketing Cloud, who will lead the Stagwell AI initiative. “Stagwell AI brings our products together under one portfolio, from enterprise-grade Machines to self-service capabilities for smaller businesses. It makes the depth of our technology easier to see – and the right solutions easier to discover.”
The supporting advertising campaign will run across television, connected TV (CTV), ReachTV, business publications, social media, and search. A series of videos will bring the portfolio to life, highlighting its products and illustrating how they help businesses make better decisions, execute faster, and drive stronger marketing performance.
To explore the Stagwell AI portfolio, interact with the agentic, voice-enabled website, and view the campaign videos, please visit www.stagwell.ai.
About Stagwell
Stagwell is the global challenger network transforming marketing through AI. We deliver scaled creative performance for the world’s most ambitious brands, connecting culture-moving creativity with leading-edge technology to harmonize the art and science of marketing. Led by entrepreneurs, our specialists in 40+ countries are unified under a single purpose: to drive effectiveness and improve business results for our clients. Join us at www.stagwellglobal.com.
Media Contact:
**SOURCE:**Stagwell
Meet the Future of News
At Stagwell, we believe a thriving news industry is not only the foundation of a healthy democracy, but also a critical platform for marketers and advertisers. However, recent discourse around brand safety — the effort of protecting a brand’s reputation by controlling its proximity of damaging content — has disproportionately hurt the news industry, as advertisers back away from news due to misconceptions and an abundance of caution. To debunk these assumptions, Stagwell launched the Future of News Initiative, with the goal of reinvigorating the relationship between news and marketing.
Instead of feeding the vicious cycle of news demonetization that hurts quality journalism the most, advertisers should kickstart a virtuous cycle of investing in news that allows brands to reach valuable audiences and gives quality news content the financial stability it needs to thrive.”
– Mark Penn, ChairMan & CEO
What We Do
Our Mission
The Research
Upcoming Events
Our Partners
WHAT WE DO
The Future of News Initiative brings together a coalition of news media and marketing industry leaders for fulsome discussions about the opportunities for news media, rooted in groundbreaking research. Together, journalists, publishers and brand leaders identify opportunities for industry growth and partnership, showcasing news as an essential tool for driving successful business results.
OUR MISSION
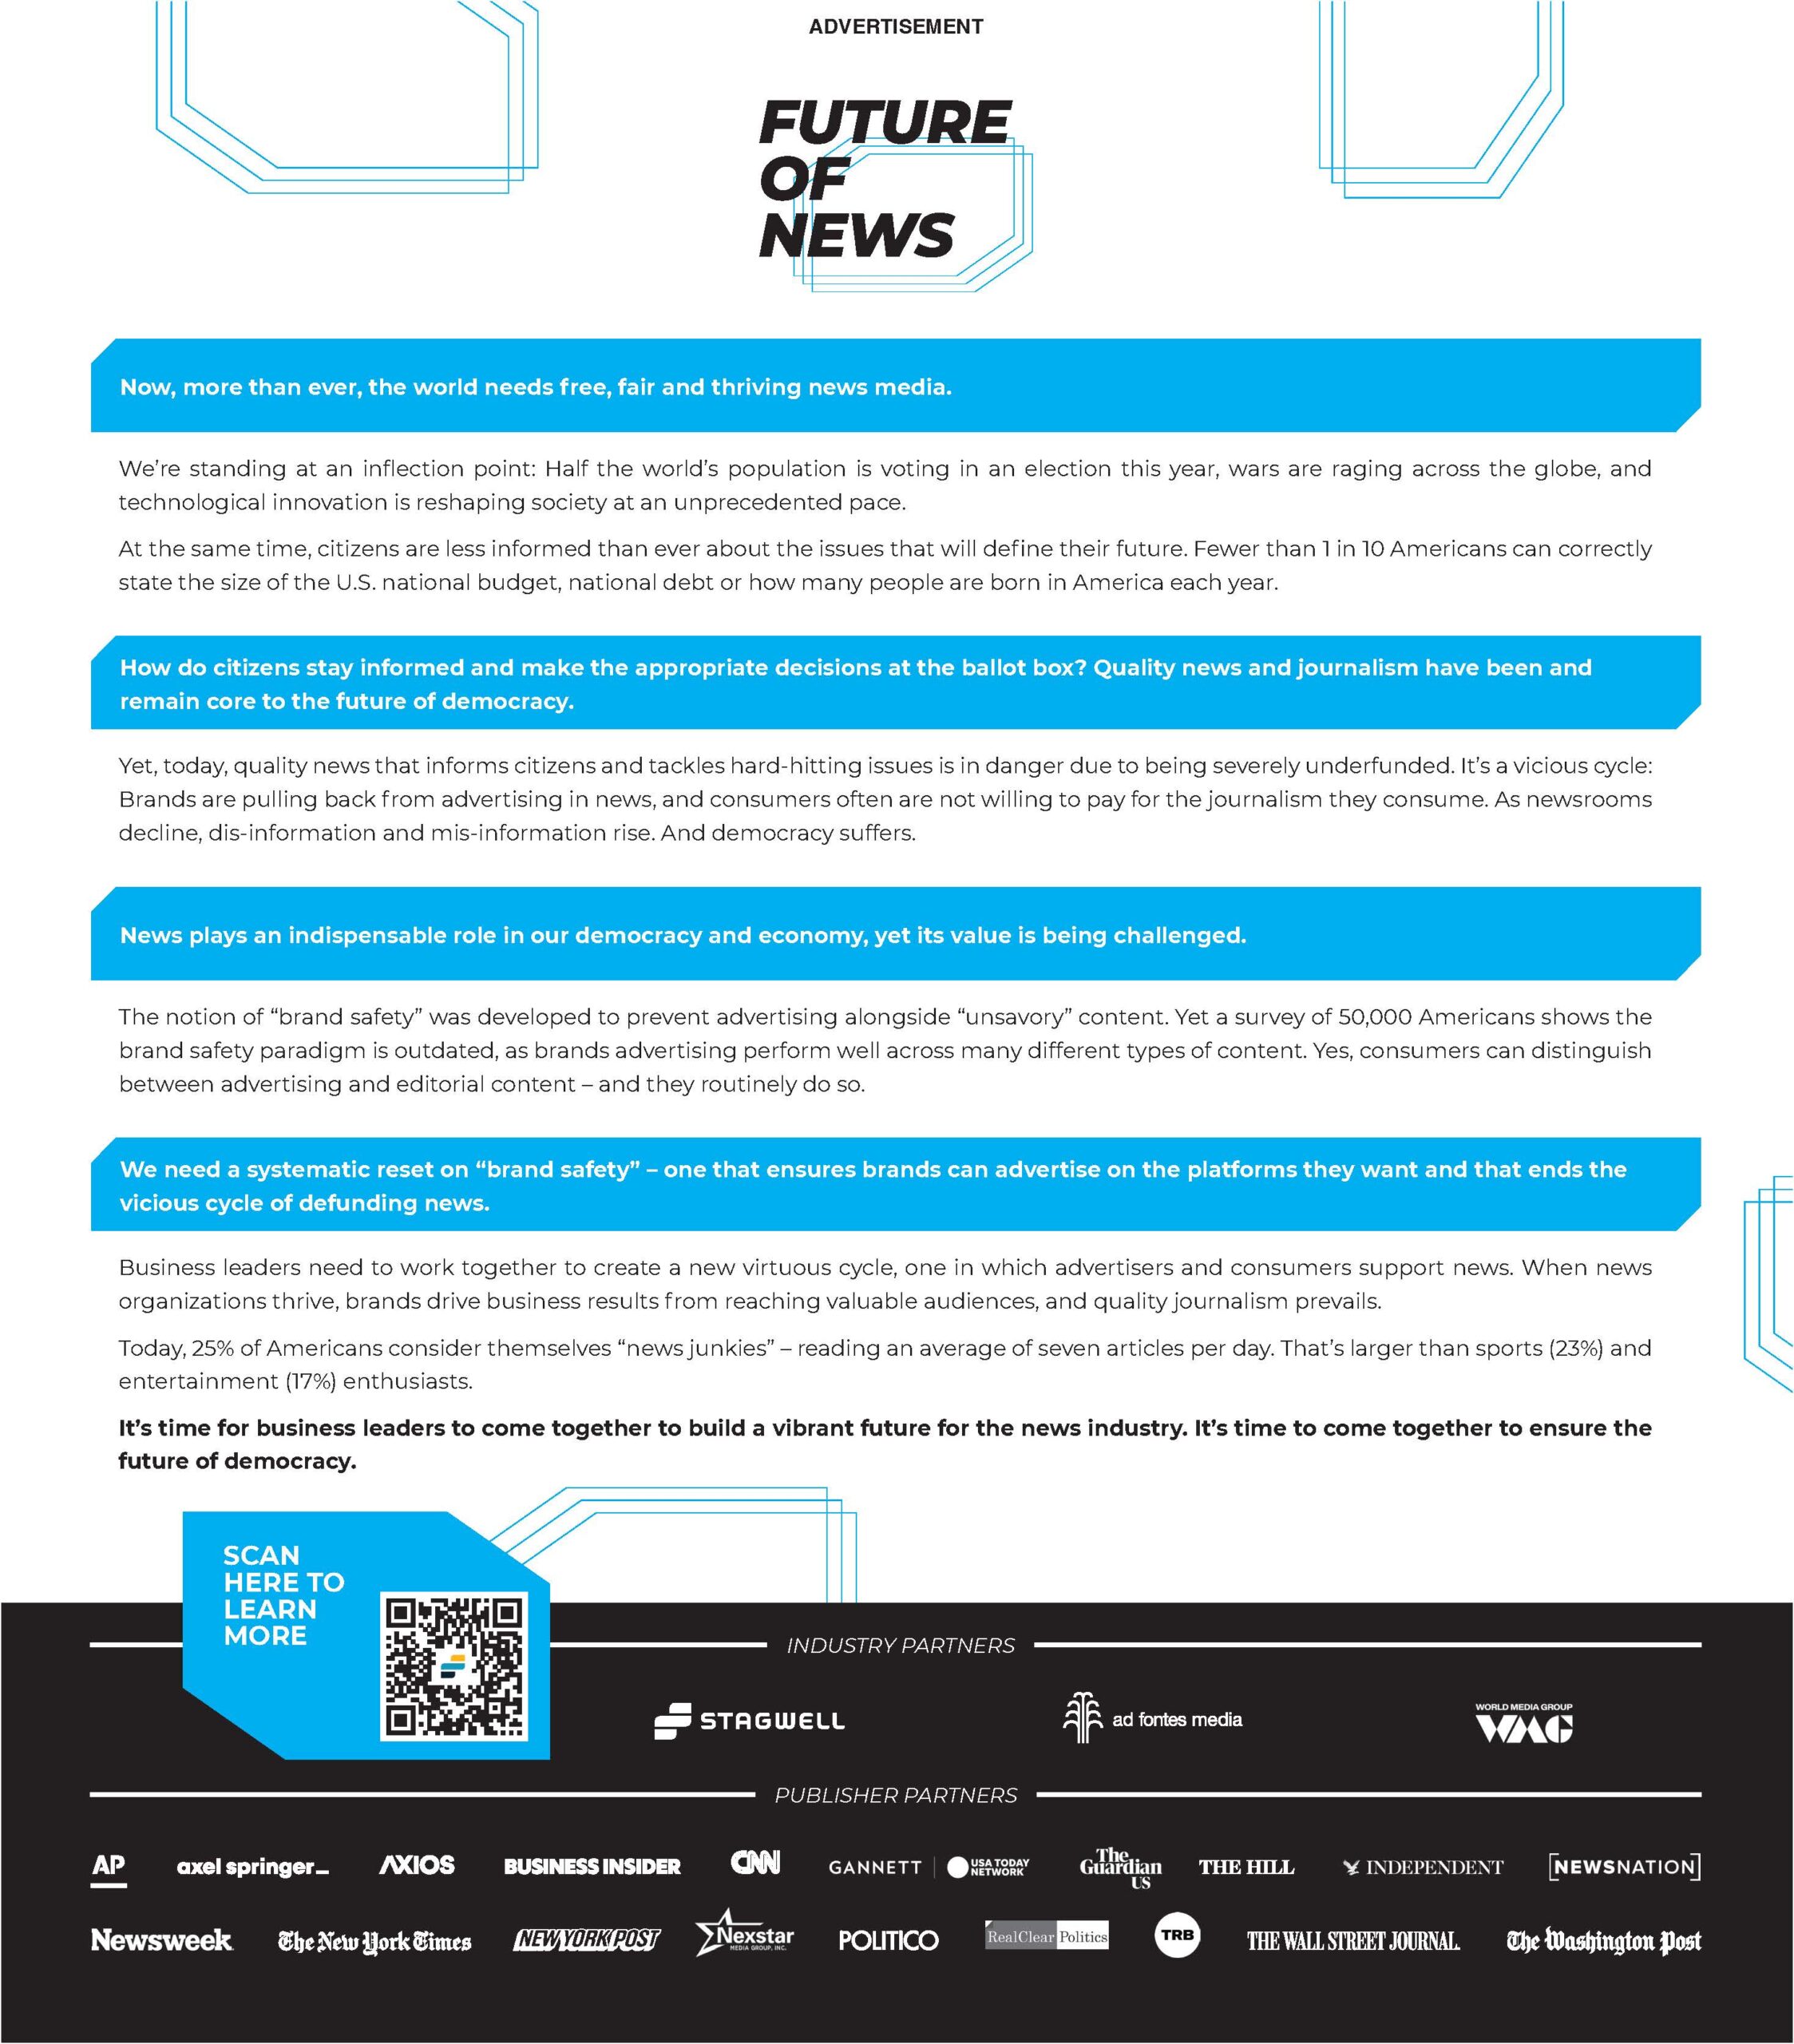
The Future of News Initiative published the following mission statement of the Future of News across half a dozen publications, with a goal of raising awareness and encouraging behavior change from our partners in the advertising world.

Research
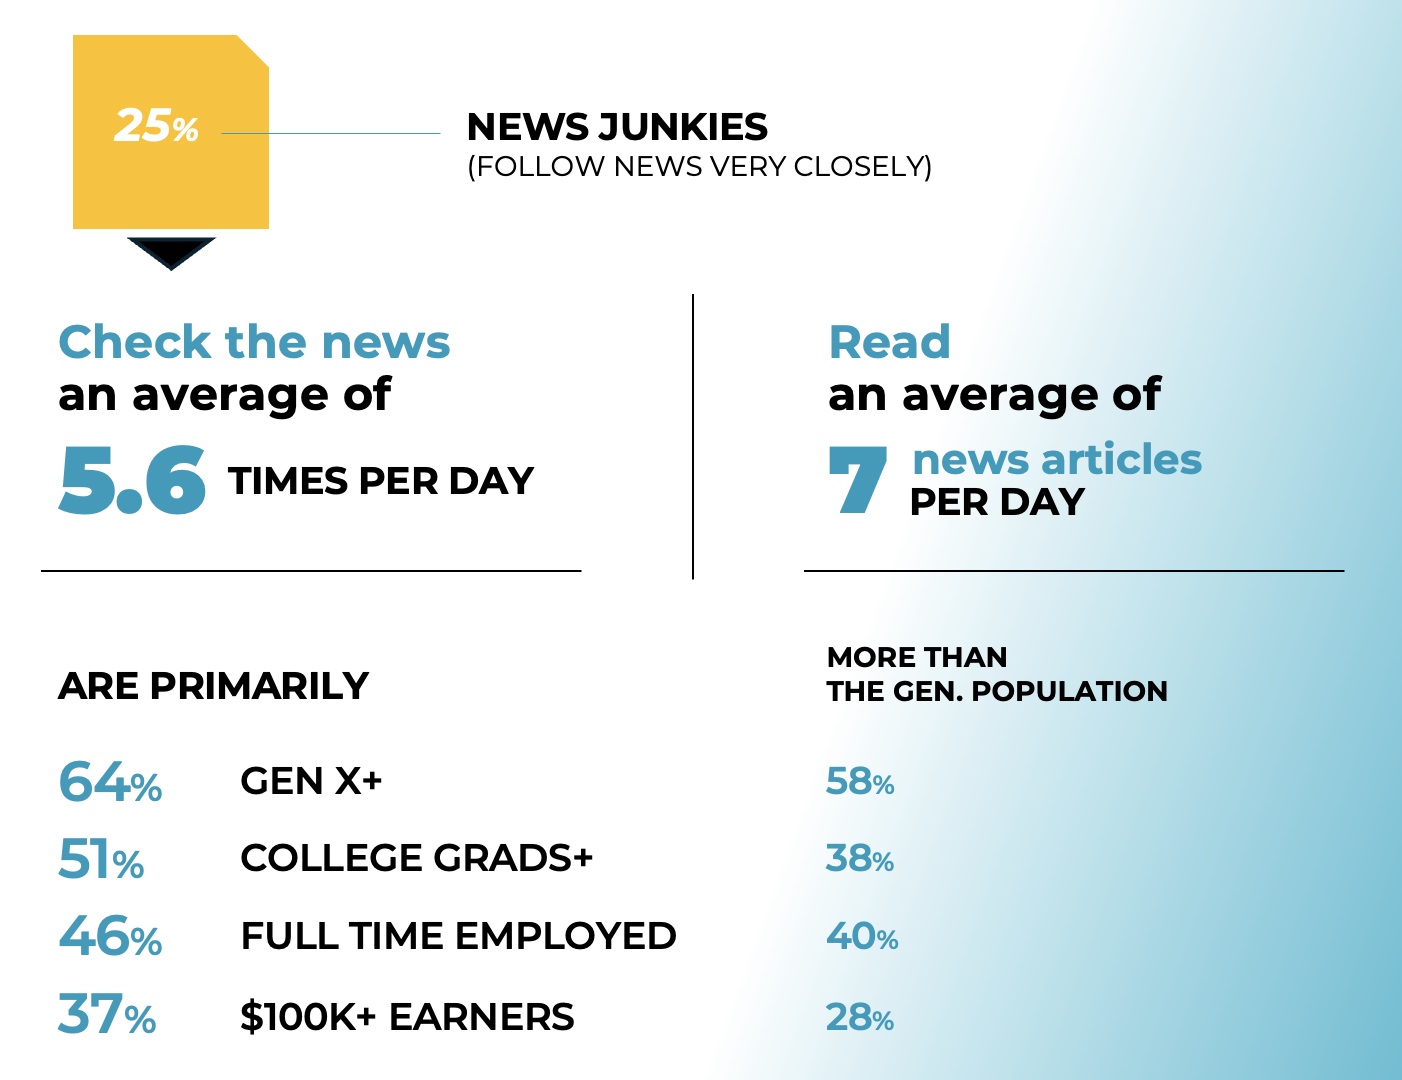
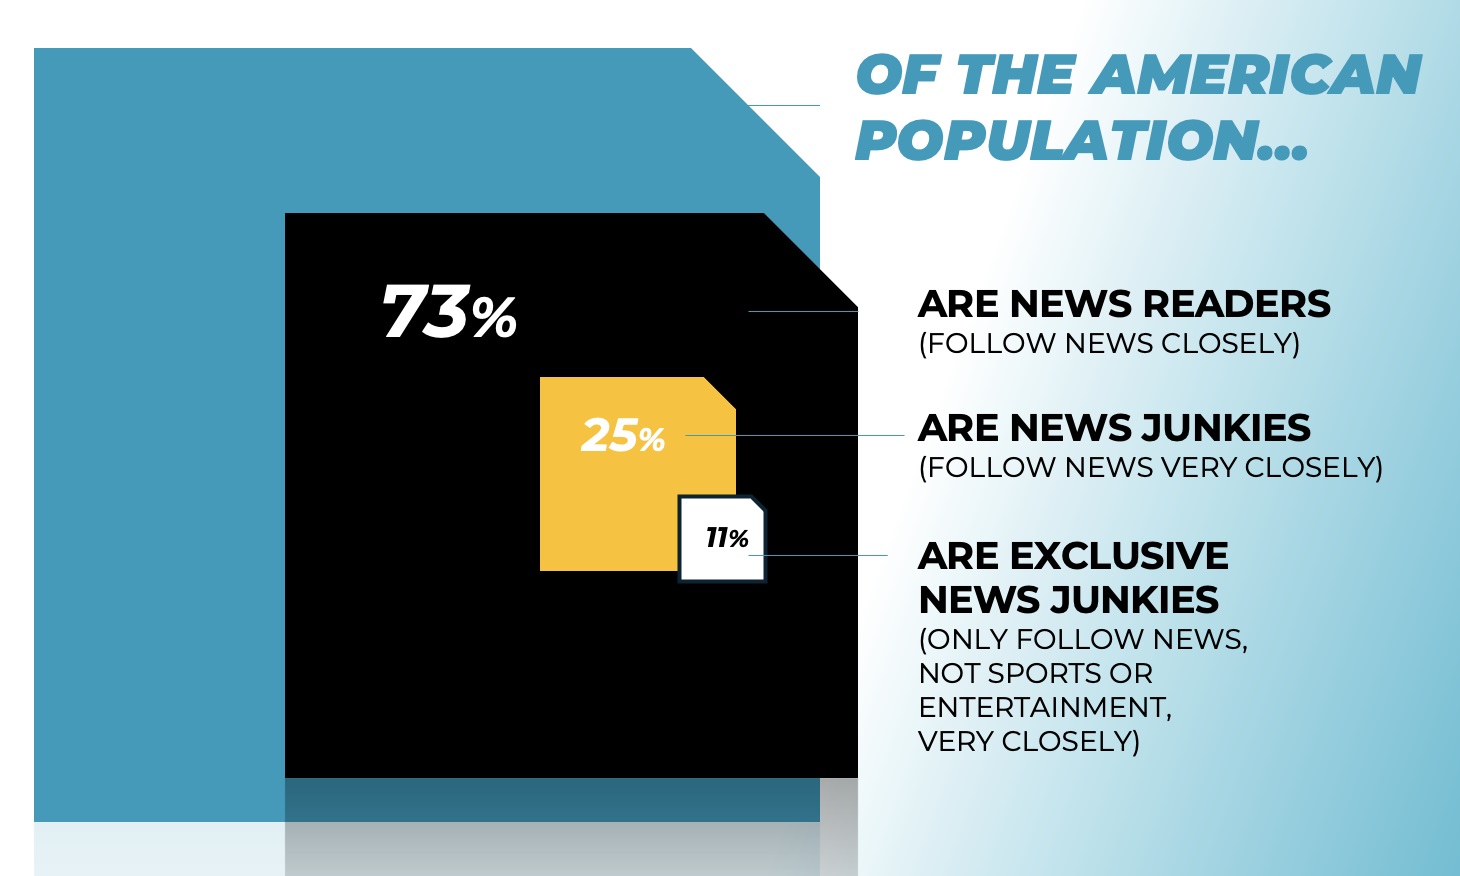
In partnership with HarrisX, we created a proprietary News Advertising Study to conduct objective, quantitative research into the perception and health of news advertising.
In May 2024, Future of News launched a first-of-its-kind report exploring the impact of ad adjacency to a range of news topics on key brand reputation metrics. The study revealed ads adjacent to “not brand safe” stories performed on par with ads next to “brand safe” content, challenging the brand safety concerns driving advertisers’ divestiture from news.
In September 2024, the UK study was released at the Future of News London Summit, exploring similar themes in this unique market.
In November 2024, we released flash poll data at our Washington, D.C. Summit. At Davos 2025, we released survey data on the views of CEOs and Board Directors regarding news media.
EXPLORE EMEA CEO AND BOARD DIRECTOR STUDY CROSSTABS
Download
our Reports
01|09
News Advertising Study Germany -- Feb 2026
1 MB / PDF

Brand Safety APAC Study -- October 2025
4 MB / PDF
Brand Safety Canada Study -- September 2025
1.4 MB / PDF
Advertising Impact Study -- June 2025
265 KB / PDF
EMEA CEO and Board Director Research -- Mar. 2025
492 KB / PDF
Global CEO & Board Director Research -- Jan. 2025
11MB / PDF
Post-Election Flash Poll -- Nov. 2024
733 KB / PDF
News Advertising Study U.S. -- May 2024
6 MB / PDF
News Advertising Study U.K. -- Sept. 2024
1 MB / PDF
News Advertising Study Germany -- Feb 2026
1 MB / PDF
01|09
OUR PARTNERS



























IN THE NEWS
Campaign UK: Majority of execs believe brand safety in news harms advertisers
Financial Times:News publishers and broadcasters warn over advertising blacklists
Business Insider: Brands aren’t hurt by advertising next to brands new report finds
The Drum: Stagwell urges advertisers to spend on journalism in print campaign for NYT, WSJ & Politico
Questions about the data? Want to become a partner? Looking for a press contact?







Prompts
Click prompts to add them under the company line, click again to take one out, then copy the result into your AI chat. Shared by Asian Century Stocks and Uncovered Thai Stocks. Thank you.
Stagwell Inc. (ticker STGW), listed in United States.
Copied
Company History
Name and ticker changes, and re-registrations under a new regulatory id. When a ticker stopped being used is not recorded, so former tickers are undated.
| Date | Change | Detail |
|---|---|---|
| Aug 2, 2021 | Renamed | MDC STAGWELL HOLDINGS INC → STAGWELL INC |
| Jul 30, 2021 | Renamed | MDC PARTNERS INC → MDC STAGWELL HOLDINGS INC |
| Mar 9, 2004 | Renamed | MDC CORP INC → MDC PARTNERS INC |
ETFs Holding Stagwell Inc.
Exchange-traded funds whose newest published daily portfolio holds one of the company's listings, largest weight first.
| ETF | Weight in ETF | Shares | Market value | As of |
|---|---|---|---|---|
| TCV | 2.56% | 452,571 | $ 5.08M | Nov 18, 2026 |
| SURE | 1.50% | 76,678 | $ 861.094K | Nov 17, 2026 |
| JPSV | 0.92% | 23,364 | $ 262.378K | Nov 17, 2026 |
| BSVO | 0.50% | 1,060,900 | $ 11.91M | Nov 18, 2026 |
| IVSS | 0.43% | 15,701 | $ 116.658K | Jun 30, 2026 |
| EHLS | 0.32% | 15,144 | $ 172.793K | Nov 17, 2026 |
| RUSC | 0.21% | 22,398 | $ 166.417K | Jun 30, 2026 |
| VFMF | 0.09% | 105,729 | $ 917.728K | Aug 31, 2026 |
| AVSC | 0.09% | 239,248 | $ 2.73M | Nov 16, 2026 |
| VFMO | 0.06% | 135,771 | $ 1.178M | Aug 31, 2026 |
| DFAT | 0.05% | 1,543,153 | $ 17.206M | Nov 12, 2026 |
| DFAS | 0.05% | 1,595,934 | $ 17.795M | Nov 12, 2026 |
| RESM | 0.03% | 163 | $ 1,211.09 | Jun 30, 2026 |
| DFSV | 0.03% | 720,739 | $ 8.036M | Nov 12, 2026 |
| EBI | 0.02% | 16,965 | $ 147.256K | Aug 31, 2026 |
| DXUV | 0.02% | 114,295 | $ 1.274M | Nov 12, 2026 |
| DFSU | 0.01% | 27,446 | $ 306.023K | Nov 12, 2026 |
| DFAC | 0.01% | 578,723 | $ 6.453M | Nov 12, 2026 |
| DCOR | 0.01% | 291,929 | $ 3.255M | Nov 12, 2026 |
| DFAU | 0.01% | 72,613 | $ 809.635K | Nov 12, 2026 |
| MSSM | 0.01% | 4,419 | $ 38.357K | Aug 31, 2026 |
| DFUV | 0.00% | 42,043 | $ 468.779K | Nov 12, 2026 |
| DFUS | 0.00% | 29,473 | $ 328.624K | Nov 12, 2026 |