SMPL
Fiscal year ends August Quarters are offset from the calendar — Q1 is Sep–Nov

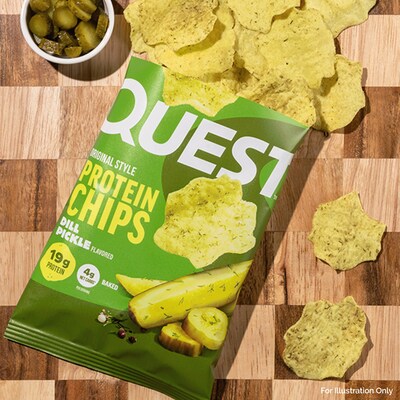
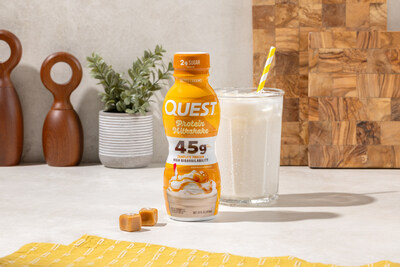
The Simply Good Foods Company is a consumer packaged food and beverage company focused on the nutritional snacking category. The company develops, markets, and sells protein-rich, low-carbohydrate, and low-sugar products, including protein bars, ready-to-drink protein shakes, protein chips, cookies, confections, and protein powders. Its portfolio is built around three primary brands: Quest, which offers a variety of high-protein snacks and beverages; Atkins, targeting consumers following low-carbohydrate lifestyles or managing weight and blood sugar; and OWYN, providing plant-based protein beverages and powders tested for the top nine allergens. The company operates an asset-light model, retaining in-house capabilities for sales, marketing, brand management, and product development while utilizing contract manufacturers for production. Distribution is primarily in North America through major retail channels such as grocery, club, and mass merchandise stores, as well as e-commerce, convenience, and specialty channels. The company was formed in March 2017 to acquire NCP-ATK Holdings, Inc., and subsequently expanded its portfolio by acquiring Quest Nutrition in November 2019 and Only What You Need, Inc. in June 2024.

Summarised from the company's own disclosures, fiscal year ended Oct 2025

Industry Packaged Foods Homepage thesimplygoodfoodscompany.com
Sector Consumer Defensive IR page thesimplygoodfoodscompany.com/investor-overview
Tags
protein bars, ready-to-drink beverages, low-carb snacks, plant-based protein, confectionery, nutritional snacking, weight management, allergen-free foods, protein powders, consumer packaged goods, Quest, Atkins, OWYN, NCP-ATK Holdings, Quest Nutrition, Only What You Need
Press page —

Metrics

Valuation  
Market cap $ 839.425M
Market cap (USD) $ 839.425M
P/E -5.62
PEG —
P/BV 0.58
P/S 0.62
P/OCF 4.64
P/FCF 5.35
Dividend yield —
Turnover / mcap —
Returns  
ROE -9.6%
ROI -8.7%
ROIC -7.5%
Profit margin -11.5%
Growth  
Revenue growing No
Profits growing No
Revenue up 3y No
Revenue up 5y No
Earnings growth 3y (net profit CAGR) —
Quality  
Profitable No
Margin expanding No
Buying back stock Yes
Diluting (TTM) No
Debt/Equity 23.9%
Podcast bulls (TTM) Sign up
Podcast bears (TTM) Sign up
Podcast sentiment (TTM) Sign up
Podcast sentiment % (TTM) Sign up
News sentiment (TTM) 7
Quality score -38.9%
Insiders  
Buys, 1w Sign up
Buys, 1m Sign up
Buys, 1y Sign up
Sells, 1w Sign up
Sells, 1m Sign up
Sells, 1y Sign up

Sign up to see this company's insider trades

Figure FY 2026 FY 2025 FY 2024 FY 2023 FY 2022 FY 2021 FY 2020 FY 2019 FY 2018 FY 2017 FY 2016
Revenue 1.356B 1.451B 1.331B 1.243B 1.169B 1.006B 816.641M 523.383M 431.429M — —
Net profit -155.903M 103.614M 139.309M 133.575M 108.574M 40.88M 34.7M 47.536M 70.455M — 10.034M
Free cash flow 156.947M 157.915M 209.961M 159.532M 105.407M 126.178M 57.185M 72.005M 59.268M — —

Figure FY 2026 FY 2025 FY 2024 FY 2023 FY 2022 FY 2021 FY 2020 FY 2019 FY 2018 FY 2017 FY 2016
Share price 13.28 33.11 34.44 37.78 37.77 36.51 18.58 26.9 14.44 — —
Price performance 12m -0.6 -0.04 -0.09 0 0.03 0.97 -0.31 0.86 — — —

Filed figures

Figure Aug 2017 Aug 2018 Aug 2019 Aug 2020 Aug 2021 Aug 2022 Aug 2023 Aug 2024 Aug 2025 Aug 2026
Balance sheet detail
Trade receivables (USD) 37.2M 36.6M 44.2M 89.7M 111M 133M 145M 151M 165M 137M
↳ YoY growth -13.2% -1.5% +20.8% +102.8% +24.2% +19.0% +9.4% +3.9% +9.5% -16.9%
↳ 5y CAGR +21.1% +29.0% +31.7% +27.8% +13.0% +4.2%
Borrowings, current (USD) 234,000 648,000 676,000 271,000 285,000 264,000 143,000 0.00 — —
Borrowings, non-current (USD) 192M 191M 190M 597M 451M 403M 282M 397M 249M 347M
Lease liabilities (USD) — — 0.00 5.25M 4.07M 6.25M 7.57M 5.49M 5.87M 8.37M
Cash and deposits (USD) 56.5M 112M 266M 95.8M 75.3M 67.5M 87.7M 133M 98.5M 138M
Intangible assets (USD) 319M 313M 306M 1.16B 1.14B 1.12B 1.11B 1.34B 1.26B 953M
Right-of-use assets (USD) — — — 25.7M 46.2M 46.5M 40M 35.1M 44.1M —
Net debt (borrowings + leases - cash) (USD) 136M 79.6M -75.4M 507M 380M 342M 202M 270M 156M 217M
Cash flow detail
Operating cash flow (USD) — 61M 73M 58.9M 132M 111M 171M 216M 178M 181M
Purchases of property, plant and equipment (USD) — -1.77M -1.04M -1.74M -5.91M -5.23M -11.6M -5.74M -20.5M -24.1M
Purchases of intangible assets (USD) — 0.00 0.00 -933,000 -795,000 -524,000 -603,000 -730,000 -2.1M 0.00
Change in receivables (cash effect) (USD) — 267,000 -7.99M -18.3M -22.3M -21.8M -13.4M 9.13M -14.7M 28.3M
Change in inventories (cash effect) (USD) — -1.08M -8.27M 23.9M -39.3M -29.5M 8.17M 13.7M -25.8M 35.9M
Change in payables (cash effect) (USD) — -3.6M 4.73M -8.74M 25.9M 2.88M -9.51M -15.5M 18.5M -33.2M
Share buybacks (cash effect) (USD) — 0.00 -2.15M 0.00 0.00 -59.9M -16.4M 0.00 -50.9M -213M
Interest paid (cash effect) (USD) — -11.2M -11.2M -30M -27.8M -19.2M -25.5M -25.7M -22M -20.8M
Income taxes paid (cash effect) (USD) — -4.58M -7.45M -4.53M -32.2M -49.2M -27.4M -33.2M -39.3M -15.4M
Share-based compensation (USD) — 4.03M 5.5M 7.64M 8.27M 11.7M 14.5M 18.4M 15.3M 17.3M
Operating cash flow before change in receivables (USD) — 60.8M 81M 77.2M 154M 132M 184M 207M 193M 153M
Free cash flow (OCF - PPE - intangibles) (USD) — 59.3M 72M 56.3M 125M 105M 159M 209M 156M 157M
Income detail
Research and development expense (USD) — 2.5M 2.2M 4M 3.5M 4.1M 4.3M 5.4M 5.5M 5.9M
↳ 5y CAGR +11.5% +19.7% +6.6% +11.0%
Total comprehensive income (USD) — 69.6M 47.5M 34.7M 40.9M 107M 133M 140M 103M -155M
Comprehensive income to owners (USD) — 69.6M 47.5M 34.7M 40.9M 107M 133M 140M 103M -155M
Provision for credit losses (USD) — — 100,000 500,000 600,000 100,000 700,000 -100,000 200,000 400,000
Credit cost ratio (credit losses / average receivables) (%) — — 0.2% 0.7% 0.6% 0.1% 0.5% 0.1% 0.1% 0.3%
Reported Nov 9, 2017 Oct 28, 2020 Oct 26, 2021 Oct 26, 2021 Jan 5, 2022 Jan 5, 2023 Jan 4, 2024 Jan 8, 2025 Jan 8, 2026 Oct 27, 2026

Sign up to see institutional holdings

Sign Up

Podcast Mentions

Sign up to see podcast mentions and sentiment

Sign Up

October 27, 2026

PDF Version

DENVER, Oct. 27, 2026 (GLOBE NEWSWIRE) -- The Simply Good Foods Company (Nasdaq: SMPL) (“Simply Good Foods,” or the “Company”), a leader in the Nutritional Snacking category, today reported financial results for the thirteen and fifty-two weeks ended August 29, 2026.

FourthQuarter Summary:(1)

  • Net sales of**$333.3 million** versus**$369.0 million**

  • Net income of**$30.5 millionversus net loss of$12.4 million**

  • Earnings****per diluted share of $0.34 versus loss per diluted share of $0.12

  • Adjusted Diluted EPS**(2)of$0.44versus****$0.46**

  • Adjusted EBITDA**(3) **$57.5 millionversus**$66.2 million**

Fiscal Year 2027**(4)**Outlook:

  • Net sales expected to decline between 13% and 17% year-over-year

  • Gross margins (GAAP) expected to increase between 250 and 300 basis points year-over-year

  • Adjusted EBITDA expected to decline between 9% and 14% year-over-year

“Fiscal 2026 was a year of decisive action. We recognized that our performance was not where it needed to be and moved quickly to reset the business. We aligned the organization around a focused set of priorities, accelerated work to improve our cost structure, strengthened our financial flexibility, and overhauled our marketing approach across Quest, Atkins, and OWYN. We delivered on the modest financial commitments we made following our second quarter reset, continued to generate significant cash flow despite lower net sales, and completed much of the foundational work necessary to improve the long-term trajectory of the business,” said Joe Scalzo, President and Chief Executive Officer.

Scalzo continued, “Fiscal 2027 will be a challenging but important year in our turnaround. While we expect significant declines in net sales and Adjusted EBITDA, we are taking the actions necessary to restore the economic foundation of the business and rebuild brand momentum. We are reinvesting a portion of our margin recovery behind our brands, with new marketing strategies designed to strengthen consumer connection and improve underlying brand health. We expect performance to improve over the course of the year as our marketing investments take hold, the volume impact of pricing eases, and year-over-year comparisons become more favorable. We believe these actions will position us to exit fiscal 2027 with stronger momentum, improved profitability, and a healthier foundation for long-term growth.”

**FourthQuarter2026Results(**1)

Net sales of $333.3 million decreased $35.7 million, or 9.7%, versus the comparable year ago period driven by a decline for Atkins and OWYN of 14.9% and 20.6%, respectively. The Company's net sales performance was largely driven by softer retail takeaway and velocity-related distribution pressure.

Total Simply Good Foods fourth quarter retail takeaway(5) decreased about 8% driven by declines for Atkins, OWYN, and Quest of approximately 23%, 7%, and 2%, respectively.

Gross profit of $113.3 million decreased 10.5% versus the comparable year ago period, driven by volume declines, higher input costs, and restructuring costs. Gross margin was 34.0%, a decline of 30 basis points versus prior year, which was largely driven by higher input costs.

Selling and marketing expenses were $32.4 million for both the fiscal fourth quarter and comparable year ago period.

General and administrative ("G&A") expenses of $30.6 million, which contain $1.9 million in restructuring costs, decreased 24.8% versus the comparable year ago period, which includes $8.7 million of integration expenses.

Net interest expense of $4.7 million reflected a 28.7% increase versus the comparable year ago period due to a higher debt balance.

The effective tax rate was 25.6%.

Net income of $30.5 million compared to net loss of $12.4 million for the comparable year ago period.

Adjusted EBITDA of $57.5 million decreased 13.2% versus the comparable year ago period.

Reported earnings per diluted share was $0.34 versus reported loss per diluted share of $0.12 in the comparable year ago period.

Adjusted Diluted EPS was $0.44 versus $0.46 in the comparable year ago period.

Weighted average diluted shares outstanding of 88.5 million declined modestly versus the comparable year ago period, reflecting share repurchases.

Fiscal Year 2026 Summary:

  • Net sales were**$1,356.5 millionversus$1,450.9 million**

  • Net loss of**$155.9 millionversus net income of$103.6 million**

  • Loss per diluted share of**$1.69versus earnings per diluted share of$1.02**

  • Adjusted Diluted EPS**(2)of$1.70versus****$1.92**

  • Adjusted EBITDA**(3)of$225.9 millionversus****$278.2 million**

Net sales of $1,356.5 million decreased 6.5% versus the comparable year ago period, driven by declines for Atkins and OWYN of 20.9% and 9.7%, respectively, partially offset by Quest growth of 0.7%. Atkins distribution-related declines were largely as expected. OWYN's net sales decline was the result of poor velocities, including on newly expanded distribution.

Total Simply Good Foods retail takeaway decreased approximately 5% driven by declines for Atkins of approximately 22%, partially offset by Quest and OWYN growth of about 3% and 1% respectively.

Gross profit of $442.4 million decreased 15.9% versus the comparable year ago period, driven by higher input costs. Gross margin was 32.6%, a 360-basis point decline versus the comparable year ago period, driven mainly by $6.5 million of one-time OWYN integration expenses and $5.7 million of restructuring costs.

Selling and marketing expenses of $129.4 million decreased 3.6% versus the comparable year ago period driven by planned marketing declines for Atkins, which more than offset increases to support growth for Quest and OWYN.

G&A expenses of $143.9 million, which includes restructuring costs of $12.7 million, integration expenses of $4.1 million, and term loan transaction fees of $3.0 million, decreased 7.7% versus the comparable year ago period, which included $20.5 million of integration expenses and $0.7 million of term loan transaction fees.

As part of the Company's process to evaluate the carrying value of our brands, prior to the fourth quarter of fiscal year 2026 we recognized $331.0 million non-cash, impairment charges related to Goodwill, and the Atkins and OWYN brand intangible assets. The impairment is largely the result of current fiscal year performance, updated projections of future revenue, and declines in stock price.

Net interest expense of $18.5 million reflected a 10% decrease versus the comparable year ago period due to lower interest rates.

The effective tax rate was 21.3%.

Net loss of $155.9 million compared to net income of $103.6 million for the comparable year ago period.

Adjusted EBITDA of $225.9 million decreased 18.8% versus the comparable year ago period.

Reported loss per diluted share of $1.69 versus reported earnings per diluted share of $1.02 in the comparable year ago period.

Adjusted Diluted EPS was $1.70 versus $1.92 in the comparable year ago period.

Weighted average diluted shares outstanding of 92.4 million declined modestly versus the comparable year ago period, reflecting share repurchases.

Balance Sheet and Cash Flow

At the end of fiscal year 2026, the Company had cash of $138.4 million and an outstanding principal balance on its term loan of $350.0 million, bringing the Company's quarter-end trailing twelve-month Net Debt to Adjusted EBITDA ratio to 0.9x(6). Cash flow from operations was about $181.0 million versus $178.5 million in the comparable year ago period. Capital expenditures were approximately $24.1 million.

Fiscal Year 2027****Outlook

The Company anticipates the following in fiscal year 2027:

  • Net sales expected to decline between 13% and 17% year-over-year

  • Gross margins (GAAP) expected to increase between 250 and 300 basis points year-over-year

  • Adjusted EBITDA expected to decline between 9% and 14% year-over-year

The Company expects net interest expense in the range of $18 to $20 million. The Company expects capital expenditures in the range of $15 to $20 million.

For the first quarter of fiscal year 2027:

  • The Company expects net sales to decline between 19% and 22% year-over-year

  • Gross margins (GAAP) expected to increase by approximately 100 basis points year-over-year

  • Adjusted EBITDA expected to decline between 28% and 33% year-over-year

The foregoing outlook assumes current economic conditions, consumer purchasing behavior and prevailing tariff rates remain generally consistent across the Company's fiscal year.


(1) All comparisons refer to the fourth quarter or full fiscal year ended August 29, 2026, versus the comparable year-ago period ended August 30, 2025. (2) Adjusted Diluted Earnings Per Share is a non-GAAP financial measure. Please refer to “Reconciliation of Adjusted Diluted Earnings Per Share” in this press release for an explanation and reconciliation of this non-GAAP financial measure. (3) Adjusted Earnings Before Interest, Taxes, Depreciation and Amortization ("EBITDA") is a non-GAAP financial measure. Please refer to the “Reconciliation of EBITDA and Adjusted EBITDA” in this press release for an explanation and reconciliation of this non-GAAP financial measure. (4) The Company does not provide a forward-looking reconciliation of expected Fiscal Year 2026 Adjusted EBITDA to Net Income, the most directly comparable GAAP financial measure, because we are unable to provide such a reconciliation without unreasonable effort due to the unavailability of reliable estimates for certain components of consolidated net income and the respective reconciliations, and the inherent difficulty of predicting what the changes in these components will be throughout the fiscal year. As these items may vary greatly between periods, we are unable to address the probable significance of the unavailable information, which could significantly affect our future financial results. (5) Combined Quest, Atkins, and OWYN Circana MULO++C-store and Company unmeasured channel estimate for the 13 and 52-weeks ending August 29, 2026, vs. the comparable 13 and 52-week year ago period. (6) Net Debt to Adjusted EBITDA is a non-GAAP financial measure which Simply Good Foods defines as the total debt outstanding under our credit agreement with Barclays Bank PLC and other parties ("Credit Agreement"), reduced by cash and cash equivalents, and divided by the Company's trailing twelve month Adjusted EBITDA, as previously defined. The Company does not provide a forward-looking reconciliation of Net Debt to Adjusted EBITDA to Net Debt to Consolidated Net Income, the most directly comparable GAAP financial measures, expected for Fiscal Year 2026, because we are unable to provide such a reconciliation without unreasonable effort due to the unavailability of reliable estimates for certain components of consolidated net income and the respective reconciliations, and the inherent difficulty of predicting what the changes in these components will be throughout the fiscal year. As these items may vary greatly between periods, we are unable to address the probable significance of the unavailable information, which could significantly affect our future financial results.

Conference Call and Webcast Information The Company will host a conference call with members of the executive management team to discuss these results today, Thursday, October 27, 2026, at 6:30 a.m. Mountain time (8:30 a.m. Eastern time). Investors interested in participating in the live call can dial 877-407-0792 from the U.S. or 201-689-8263 from International locations. A live webcast will be available via the "Investors" section of the Company's website at www.thesimplygoodfoodscompany.com. A telephone replay will be available approximately two hours after the call concludes and will remain accessible through October 30, 2025, by dialing 844-512-2921 from the U.S., or 412-317-6671 from international locations, and entering confirmation code 13755448.

About The Simply Good Foods Company The Simply Good Foods Company (Nasdaq: SMPL), headquartered in Denver, Colorado, is a consumer-packaged food and beverage company with ambitious goals to raise the bar on what food can be with trusted brands and innovative nutritious snacking products. Within our portfolio of trusted brands (Quest™, Atkins™, and OWYN™), we offer a wide variety of nutritional snacks and beverages, including high protein chips, bars, ready-to-drink (RTD) shakes, and powders, and low sugar, low carb sweets and baked goods. We are a leader of the nutritious snacking movement, poised to expand our healthy lifestyle platform through innovation-driven organic growth and external investment opportunities. To learn more, visit www.thesimplygoodfoodscompany.com.

Investor Contact Matt Siler Vice President, Investor Relations and Treasury The Simply Good Foods Company [email protected]

Forward Looking Statements

Certain statements made herein are not historical facts but are forward-looking statements for purposes of the safe harbor provisions under The Private Securities Litigation Reform Act of 1995. Forward-looking statements generally are accompanied by or include words such as “will”, “expect”, “intends” or other similar words, phrases or expressions. These statements relate to future events or our future financial or operational performance and involve known and unknown risks, uncertainties and other factors that could cause our actual results, levels of activity, performance or achievement to differ materially from those expressed or implied by these forward-looking statements. We caution you that these forward-looking statements are not guarantees of future performance and involve risks, uncertainties and assumptions that are difficult to predict. You should not place undue reliance on forward-looking statements. These statements reflect our current views with respect to future events, are based on assumptions and are subject to risks and uncertainties. These risks and uncertainties relate to, among other things, our ability to achieve our estimates of OWYN’s net sales and Adjusted EBITDA and our anticipated synergies from the OWYN Acquisition, our net leverage ratio post-acquisition, our Adjusted EPS post-acquisition, our ability to maintain OWYN personnel and effectively integrate OWYN, our operations being dependent on changes in consumer preferences and purchasing habits regarding our products, a global supply chain and effects of supply chain constraints and inflationary pressure on us and our contract manufacturers, our ability to continue to operate at a profit or to maintain our margins, the effect pandemics or other global disruptions on our business, financial condition and results of operations, the sufficiency of our sources of liquidity and capital, our ability to maintain current operation levels and implement our growth strategies, our ability to maintain and gain market acceptance for our products or new products, our ability to capitalize on attractive opportunities, our ability to respond to competition and changes in the economy including changes regarding inflation and increasing ingredient and packaging costs and labor challenges at our contract manufacturers and third party logistics providers, the amounts of or changes with respect to certain anticipated raw materials and other costs, difficulties and delays in achieving the synergies and cost savings in connection with acquisitions, changes in the business environment in which we operate including general financial, economic, capital market, regulatory and geopolitical conditions affecting us and the industry in which we operate, our ability to maintain adequate product inventory levels to timely supply customer orders, changes in taxes, tariffs, duties, governmental laws and regulations, the availability of or competition for other brands, assets or other opportunities for investment by us or to expand our business, competitive product and pricing activity, difficulties of managing growth profitably, the loss of one or more members of our management team, potential for increased costs and harm to our business resulting from unauthorized access of the information technology systems we use in our business, expansion of our wellness platform and other risks and uncertainties indicated in the Company’s Form 10-K, Form 10-Q, and Form 8-K reports (including all amendments to those reports) filed with the U.S. Securities and Exchange Commission from time to time. In addition, forward-looking statements provide the Company’s expectations, plans or forecasts of future events and views as of the date of this communication. Except as required by law, the Company undertakes no obligation to update such statements to reflect events or circumstances arising after such date and cautions investors not to place undue reliance on any such forward-looking statements. These forward-looking statements should not be relied upon as representing the Company’s assessments as of any date subsequent to the date of this communication.

| The Simply Good Foods Company and Subsidiaries Consolidated Balance Sheets (Unaudited, dollars in thousands, except share and per share data) |

| |

| | | August 29, 2026 | | August 30, 2025 |

| Assets | | | | |

| Current assets: | | | | |

| Cash | | $ | 138,425 | | | $ | 98,468 | |

| Accounts receivable, net | | | 137,036 | | | | 164,978 | |

| Inventories, net | | | 132,458 | | | | 167,217 | |

| Prepaid expenses | | | 7,522 | | | | 7,209 | |

| Other current assets | | | 18,099 | | | | 15,812 | |

| Total current assets | | | 433,540 | | | | 453,684 | |

| | | | | |

| Long-term assets: | | | | |

| Property and equipment, net | | | 52,614 | | | | 39,738 | |

| Intangible assets, net | | | 953,004 | | | | 1,261,603 | |

| Goodwill | | | 551,974 | | | | 589,974 | |

| Other long-term assets | | | 45,612 | | | | 51,046 | |

| Total assets | | $ | 2,036,744 | | | $ | 2,396,045 | |

| | | | | |

| Liabilities and stockholders’ equity | | | | |

| Current liabilities: | | | | |

| Accounts payable | | $ | 45,071 | | | $ | 78,298 | |

| Accrued interest | | | — | | | | 44 | |

| Accrued expenses and other current liabilities | | | 32,702 | | | | 46,219 | |

| Total current liabilities | | | 77,773 | | | | 124,561 | |

| | | | | |

| Long-term liabilities: | | | | |

| Long-term debt, less current maturities | | | 347,219 | | | | 249,066 | |

| Deferred income taxes | | | 116,788 | | | | 166,091 | |

| Other long-term liabilities | | | 42,556 | | | | 49,494 | |

| Total liabilities | | | 584,336 | | | | 589,212 | |

| See commitments and contingencies (Note 11) | | | | |

| | | | | |

| Stockholders’ equity: | | | | |

| Preferred stock, $0.01 par value, 100,000,000 shares authorized, none issued | | | — | | | | — | |

| Common stock, $0.01 par value, 600,000,000 shares authorized, 104,073,452 and 103,688,071 issued at August 29, 2026 and August 30, 2025, respectively | | | 1,041 | | | | 1,037 | |

| Treasury stock, 15,619,805 shares and 3,957,571 shares at cost at August 29, 2026 and August 30, 2025, respectively | | | (344,775 | ) | | | (129,337 | ) |

| Additional paid-in-capital | | | 1,362,717 | | | | 1,346,687 | |

| Retained earnings | | | 434,976 | | | | 590,879 | |

| Accumulated other comprehensive loss | | | (1,551 | ) | | | (2,433 | ) |

| Total stockholders’ equity | | | 1,452,408 | | | | 1,806,833 | |

| Total liabilities and stockholders’ equity | | $ | 2,036,744 | | | $ | 2,396,045 | |

| The Simply Good Foods Company and Subsidiaries Consolidated Statements of Income and Comprehensive Income (Loss) (Unaudited, dollars in thousands, except share and per share data) |

| |

| | | 13-Weeks Ended | | 13-Weeks Ended | | 52-Weeks Ended | | 52-Weeks Ended |

| | | August 29, 2026 | | August 30, 2025 | | August 29, 2026 | | August 30, 2025 |

| Net sales | | $ | 333,305 | | | $ | 369,041 | | | $ | 1,356,499 | | | $ | 1,450,920 | |

| Cost of goods sold | | | 219,974 | | | | 242,436 | | | | 914,136 | | | | 925,173 | |

| Gross profit | | | 113,331 | | | | 126,605 | | | | 442,363 | | | | 525,747 | |

| | | | | | | | | |

| Operating expenses: | | | | | | | | |

| Selling and marketing | | | 32,429 | | | | 32,411 | | | | 129,446 | | | | 134,282 | |

| General and administrative | | | 30,567 | | | | 40,624 | | | | 143,901 | | | | 155,930 | |

| Depreciation and amortization | | | 4,452 | | | | 4,421 | | | | 17,731 | | | | 16,900 | |

| Business transaction costs | | | — | | | | — | | | | — | | | | 820 | |

| Loss on impairment | | | — | | | | 60,928 | | | | 331,000 | | | | 60,928 | |

| Total operating expenses | | | 67,448 | | | | 138,384 | | | | 622,078 | | | | 368,860 | |

| | | | | | | | | |

| (Loss) income from operations | | | 45,883 | | | | (11,779 | ) | | | (179,715 | ) | | | 156,887 | |

| | | | | | | | | |

| Other income (expense): | | | | | | | | |

| Interest income | | | 872 | | | | 513 | | | | 2,940 | | | | 2,663 | |

| Interest expense | | | (5,552 | ) | | | (4,150 | ) | | | (21,447 | ) | | | (23,249 | ) |

| (Loss) gain on foreign currency transactions | | | (199 | ) | | | (79 | ) | | | (65 | ) | | | (421 | ) |

| Other income | | | 13 | | | | 3 | | | | 164 | | | | 23 | |

| Total other income (expense) | | | (4,866 | ) | | | (3,713 | ) | | | (18,408 | ) | | | (20,984 | ) |

| | | | | | | | | |

| (Loss) income before income taxes | | | 41,017 | | | | (15,492 | ) | | | (198,123 | ) | | | 135,903 | |

| Income tax (benefit) expense | | | 10,519 | | | | (3,135 | ) | | | (42,220 | ) | | | 32,289 | |

| Net (loss) income | | $ | 30,498 | | | $ | (12,357 | ) | | $ | (155,903 | ) | | $ | 103,614 | |

| | | | | | | | | |

| Other comprehensive (loss) income: | | | | | | | | |

| Foreign currency translation, net of reclassification adjustments | | | (64 | ) | | | 110 | | | | 882 | | | | (394 | ) |

| Comprehensive (loss) income | | $ | 30,434 | | | $ | (12,247 | ) | | $ | (155,021 | ) | | $ | 103,220 | |

| | | | | | | | | |

| (Loss) earnings per share | | | | | | | | |

| Basic | | $ | 0.34 | | | $ | (0.12 | ) | | $ | (1.69 | ) | | $ | 1.03 | |

| Diluted | | $ | 0.34 | | | $ | (0.12 | ) | | $ | (1.69 | ) | | $ | 1.02 | |

| Weighted average shares outstanding: | | | | | | | | |

| Basic | | | 88,456,490 | | | | 100,419,463 | | | | 92,372,473 | | | | 100,695,181 | |

| Diluted | | | 88,547,937 | | | | 100,997,903 | | | | 92,372,473 | | | | 101,510,772 | |

| The Simply Good Foods Company and Subsidiaries Consolidated Statements of Cash Flows (Unaudited, dollars in thousands) |

| |

| | | 52-Weeks Ended | | 52-Weeks Ended |

| | | August 29, 2026 | | August 30, 2025 |

| Operating activities | | | | |

| Net (loss) income | | $ | (155,903 | ) | | $ | 103,614 | |

| Adjustments to reconcile net income to net cash provided by operating activities: | | | | |

| Depreciation and amortization | | | 24,255 | | | | 21,431 | |

| Amortization of deferred financing costs and debt discount | | | 672 | | | | 1,479 | |

| Stock compensation expense | | | 17,280 | | | | 15,273 | |

| Loss on impairment | | | 331,000 | | | | 60,928 | |

| Estimated credit losses (recoveries) | | | 355 | | | | 241 | |

| Unrealized loss (gain) on foreign currency transactions | | | 65 | | | | 421 | |

| Deferred income taxes | | | (49,452 | ) | | | 3 | |

| Amortization of operating lease right-of-use asset | | | 6,068 | | | | 6,863 | |

| Other | | | 1,418 | | | | 1,133 | |

| Changes in operating assets and liabilities: | | | | |

| Accounts receivable, net | | | 28,322 | | | | (14,682 | ) |

| Inventories, net | | | 35,852 | | | | (25,848 | ) |

| Prepaid expenses | | | (304 | ) | | | (1,507 | ) |

| Other current assets | | | (2,558 | ) | | | (6,894 | ) |

| Accounts payable | | | (33,163 | ) | | | 18,535 | |

| Accrued interest | | | (44 | ) | | | (221 | ) |

| Accrued expenses and other current liabilities | | | (17,214 | ) | | | (3,591 | ) |

| Other assets and liabilities | | | (5,600 | ) | | | 1,279 | |

| Net cash provided by operating activities | | | 181,049 | | | | 178,457 | |

| Investing activities | | | | |

| Purchases of property and equipment | | | (24,102 | ) | | | (20,542 | ) |

| Acquisition of business, net of cash acquired | | | — | | | | 1,713 | |

| Investments in intangible assets and other assets | | | — | | | | (2,103 | ) |

| Net cash used in investing activities | | | (24,102 | ) | | | (20,932 | ) |

| Financing activities | | | | |

| Proceeds from option exercises | | | 1,056 | | | | 12,917 | |

| Tax payments related to issuance of restricted stock units | | | (2,302 | ) | | | (3,236 | ) |

| Repurchase of common stock | | | (213,308 | ) | | | (50,886 | ) |

| Principal payments of long-term debt | | | (50,000 | ) | | | (150,000 | ) |

| Proceeds from issuance of long-term debt | | | 150,000 | | | | — | |

| Deferred financing costs | | | (2,632 | ) | | | — | |

| Net cash (used in) provided by financing activities | | | (117,186 | ) | | | (191,205 | ) |

| Net increase (decrease) in cash | | | 39,761 | | | | (33,680 | ) |

| Effect of exchange rate on cash | | | 196 | | | | (382 | ) |

| Cash at beginning of period | | | 98,468 | | | | 132,530 | |

| Cash at end of period | | $ | 138,425 | | | $ | 98,468 | |

| | | | | | | | | |

Net Sales by Geographic Area and Brands

The following is a summary of revenue disaggregated by geographic area and brand:

| | 13-Weeks Ended | | 13-Weeks Ended | | 52-Weeks Ended | | 52-Weeks Ended |

| (In thousands) | August 29, 2026 | | August 30, 2025 | | August 29, 2026 | | August 30, 2025 |

| North America(1) | | | | | | | |

| Atkins | $ | 78,038 | | $ | 91,682 | | $ | 332,674 | | $ | 420,787 |

| Quest | | 217,662 | | | 233,169 | | | 869,707 | | | 863,614 |

| OWYN | | 29,694 | | | 37,409 | | | 123,785 | | | 137,020 |

| Total North America | | 325,394 | | | 362,260 | | | 1,326,166 | | | 1,421,421 |

| International(1) | | 7,911 | | | 6,781 | | | 30,333 | | | 29,499 |

| Total | $ | 333,305 | | $ | 369,041 | | $ | 1,356,499 | | $ | 1,450,920 |

| (1)The North America geographic area consists of net sales substantially related to the United States and there is no individual foreign country to which more than 10% of the Company’s net sales are attributed or that is otherwise deemed individually material. |

| |

R****econciliation of EBITDA and Adjusted EBITDA

**EBITDA and Adjusted EBITDA.**EBITDA and Adjusted EBITDA are non-GAAP financial measures commonly used in our industry and should not be construed as alternatives to net income as an indicator of operating performance or as alternatives to cash flow provided by operating activities as a measure of liquidity (each as determined in accordance with GAAP). Simply Good Foods defines EBITDA as net income or loss before interest income, interest expense, income tax expense, depreciation and amortization, and Adjusted EBITDA as further adjusted to exclude the following items: loss on impairment, stock-based compensation expense, business transaction costs, purchase price accounting inventory step-up, integration expense, term loan transaction fees, restructuring and other costs, and other non-core expenses. The Company believes that EBITDA and Adjusted EBITDA, when used in conjunction with net income, are useful to provide additional information to investors. Management of the Company uses EBITDA and Adjusted EBITDA to supplement net income because these measures reflect operating results of the on-going operations, eliminate items that are not directly attributable to the Company’s underlying operating performance, enhance the overall understanding of past financial performance and future prospects, and allow for greater transparency with respect to the key metrics the Company’s management uses in its financial and operational decision making. The Company also believes that EBITDA and Adjusted EBITDA are frequently used by securities analysts, investors and other interested parties in the evaluation of companies in its industry. EBITDA and Adjusted EBITDA may not be comparable to other similarly titled captions of other companies due to differences in the non-GAAP calculation.

The following unaudited table provides a reconciliation of EBITDA and Adjusted EBITDA to its most directly comparable GAAP measure, which is net income, for the thirteen and fifty-two weeks ended August 29, 2026, and thirteen and fifty-two weeks ended August 30, 2025:

| (In thousands) | | 13-Weeks Ended | | 13-Weeks Ended | | 52-Weeks Ended | | 52-Weeks Ended |

| | August 29, 2026 | | August 30, 2025 | | August 29, 2026 | | August 30, 2025 |

| Net (loss) income | | $ | 30,498 | | | $ | (12,357 | ) | | $ | (155,903 | ) | | $ | 103,614 | |

| Interest income | | | (872 | ) | | | (513 | ) | | | (2,940 | ) | | | (2,663 | ) |

| Interest expense | | | 5,552 | | | | 4,150 | | | | 21,447 | | | | 23,249 | |

| Income tax (benefit) expense | | | 10,519 | | | | (3,135 | ) | | | (42,220 | ) | | | 32,289 | |

| Depreciation and amortization | | | 6,159 | | | | 5,951 | | | | 24,255 | | | | 21,431 | |

| EBITDA | | | 51,856 | | | | (5,904 | ) | | | (155,361 | ) | | | 177,920 | |

| Loss on impairment | | | — | | | | 60,928 | | | | 331,000 | | | | 60,928 | |

| Stock-based compensation expense | | | 4,094 | | | | 2,454 | | | | 17,280 | | | | 15,273 | |

| Business transaction costs | | | — | | | | — | | | | — | | | | 820 | |

| Inventory step-up | | | — | | | | — | | | | — | | | | 1,412 | |

| Integration expense(1) | | | — | | | | 8,744 | | | | 10,621 | | | | 20,856 | |

| Term loan transaction fees | | | — | | | | — | | | | 3,030 | | | | 715 | |

| Restructuring and other costs | | | 1,419 | | | | — | | | | 19,492 | | | | — | |

| Other(2) | | | 125 | | | | 17 | | | | (193 | ) | | | 238 | |

| Adjusted EBITDA | | $ | 57,494 | | | $ | 66,239 | | | $ | 225,869 | | | $ | 278,162 | |

| (1)Includes one-time effects from actions taken to mitigate OWYN product quality issues. |

| (2)Other items consist principally of exchange impact of foreign currency transactions and other expenses. |

| |

Reconciliation of Adjusted Diluted Earnings Per Share

Adjusted Diluted Earnings per Share. Adjusted Diluted Earnings per Share is a non-GAAP financial measure commonly used in our industry and should not be construed as an alternative to diluted earnings per share as an indicator of operating performance. Simply Good Foods defines Adjusted Diluted Earnings Per Share as diluted earnings per share before depreciation and amortization, loss on impairment, stock-based compensation expense, business transaction costs, purchase price accounting inventory step-up, integration expense, term loan transaction fees, restructuring and other costs, and other non-core expenses, on a theoretical tax effected basis of such adjustments. The tax effect of such adjustments to Adjusted Diluted Earnings Per Share is calculated by applying an overall assumed statutory tax rate to each gross adjustment as shown in the reconciliation to Adjusted EBITDA, as previously defined. The assumed statutory tax rate reflects a normalized effective tax rate estimated based on assumptions regarding the Company's statutory and effective tax rate for each respective reporting period, including the current and deferred tax effects of each adjustment, and is adjusted for the effects of tax reform, if any. The Company consistently applies the overall assumed statutory tax rate to periods throughout each fiscal year and reassesses the overall assumed statutory rate on annual basis. The Company believes that the inclusion of these supplementary adjustments in presenting Adjusted Diluted Earnings per Share, when used in conjunction with diluted earnings per share, are appropriate to provide additional information to investors, reflects more accurately operating results of the on-going operations, enhances the overall understanding of past financial performance and future prospects and allows for greater transparency with respect to the key metrics the Company uses in its financial and operational decision making. The Company also believes that Adjusted Diluted Earnings per Share is frequently used by securities analysts, investors and other interested parties in the evaluation of companies in its industry. Adjusted Diluted Earnings per Share may not be comparable to other similarly titled captions of other companies due to differences in the non-GAAP calculation.

The following unaudited tables below provide a reconciliation of Adjusted Diluted Earnings Per Share to its most directly comparable GAAP measure, which is diluted earnings per share, for the thirteen and fifty-two weeks ended August 29, 2026, and the thirteen and fifty-two weeks ended August 30, 2025:

| | | 13-Weeks Ended | | 13-Weeks Ended | | 52-Weeks Ended | | 52-Weeks Ended |

| | | August 29, 2026 | | August 30, 2025 | | August 29, 2026 | | August 30, 2025 |

| Diluted (loss) earnings per share | | $ | 0.34 | | | $ | (0.12 | ) | | $ | (1.69 | ) | | $ | 1.02 | |

| | | | | | | | | |

| Depreciation and amortization | | | 0.07 | | | | 0.06 | | | | 0.26 | | | | 0.21 | |

| Loss on impairment | | | — | | | | 0.60 | | | | 3.58 | | | | 0.60 | |

| Stock-based compensation expense | | | 0.05 | | | | 0.02 | | | | 0.19 | | | | 0.15 | |

| Business transaction costs | | | — | | | | — | | | | — | | | | 0.01 | |

| Inventory step-up | | | — | | | | — | | | | — | | | | 0.01 | |

| Integration expense | | | — | | | | 0.09 | | | | 0.11 | | | | 0.21 | |

| Term loan transaction fees | | | — | | | | — | | | | 0.03 | | | | 0.01 | |

| Restructuring and other costs | | | 0.02 | | | | — | | | | 0.21 | | | | — | |

| Tax effects of adjustments(1) | | | (0.03 | ) | | | (0.19 | ) | | | (0.99 | ) | | | (0.30 | ) |

| Rounding(2) | | | (0.01 | ) | | | — | | | | — | | | | — | |

| Adjusted diluted earnings per share | | $ | 0.44 | | | $ | 0.46 | | | $ | 1.70 | | | $ | 1.92 | |

| (1)This line item reflects the aggregate tax effect of all non-tax adjustments reflected in the preceding line items of the table. The tax effect of each adjustment is computed (i) by dividing the gross amount of the adjustment, as shown in the Adjusted EBITDA reconciliation, by the number of diluted weighted average shares outstanding for the applicable fiscal period and (ii) applying an overall assumed statutory tax rate of 25% for the thirteen and fifty-two weeks ended August 29, 2026, as well as the thirteen and fifty-two weeks ended August 30, 2025. |

| (2)Adjusted Diluted Earnings Per Share amounts are computed independently for each quarter. Therefore, the sum of the quarterly Adjusted Diluted Earnings Per Share amounts may not equal the year to date Adjusted Diluted Earnings Per Share amounts due to rounding. |

| |

Reconciliation of Net Debt to Adjusted EBITDA

Net Debt to Adjusted EBITDA. Net Debt to Adjusted EBITDA is a non-GAAP financial measure which Simply Good Foods defines as the total debt outstanding under our credit agreement with Barclays Bank PLC and other parties (“Credit Agreement”), reduced by cash and cash equivalents, and divided by the trailing twelve months of Adjusted EBITDA, as previously defined.

The following unaudited table below provides a reconciliation of Net Debt to Adjusted EBITDA as of August 29, 2026:

| (In thousands) | | August 29, 2026 |

| Net Debt: | | |

| Total debt outstanding under the Credit Agreement | | $ | 350,000 | |

| Less: cash and cash equivalents | | | (138,425 | ) |

| Net Debt as of August 29, 2026 | | $ | 211,575 | |

| | | |

| Adjusted EBITDA | | $ | 225,869 | |

| | | |

| Net Debt to Adjusted EBITDA | | 0.9 x |

×

October 6, 2026

PDF Version

DENVER, Oct. 06, 2026 (GLOBE NEWSWIRE) -- The Simply Good Foods Company (NASDAQ: SMPL) (“Simply Good Foods” or the “Company”), a leader in the Nutritional Snacking category, today announced it will report financial results for the fourth quarter of Fiscal Year 2026 on Tuesday, October 27, 2026. A press release will be issued that morning, followed by a live conference call beginning at 6:30 a.m. Mountain Time (8:30 a.m. Eastern Time). Participating on the call will be Joe Scalzo, President and Chief Executive Officer and Chris Bealer, Chief Financial Officer.

Investors interested in participating in the live call can dial 877-407-0792 from the U.S., or 201-689-8263 from international locations. A live webcast, as well as a supplemental slide presentation, will be available via the “Investors” section of the Company's website at www.thesimplygoodfoodscompany.com.

A telephone replay will be available approximately two hours after the call concludes and will remain accessible through Tuesday, November 10, 2026, by dialing 844-512-2921 from the U.S., or 412-317-6671 from international locations, and entering confirmation code 13762620.

About The Simply Good Foods Company The Simply Good Foods Company (Nasdaq: SMPL), headquartered in Denver, Colorado, is a consumer-packaged food and beverage company with ambitious goals to raise the bar on what food can be with trusted brands and innovative nutritious snacking products. Within our portfolio of trusted brands (Quest™, Atkins™, and OWYN™), we offer a wide variety of nutritional snacks and beverages, including high protein chips, bars, ready-to-drink (RTD) shakes, and powders, and low sugar, low carb sweets and baked goods. We are a leader of the nutritious snacking movement, poised to expand our healthy lifestyle platform through innovation-driven organic growth and external investment opportunities. To learn more, visit www.thesimplygoodfoodscompany.com.

Investor Contact Matt Siler Vice President, Investor Relations and Treasury The Simply Good Foods Company [email protected]

×

July 9, 2026

PDF Version

DENVER, July 09, 2026 (GLOBE NEWSWIRE) -- The Simply Good Foods Company (Nasdaq: SMPL) (“Simply Good Foods,” or the “Company”), a leader in the Nutritional Snacking Category, today reported financial results for the thirteen and thirty-nine weeks ended May 30, 2026.

ThirdQuarter Summary:(1)

  • Net sales of**$357.0 millionversus$381.0 million**

  • Net loss of**$52.0 millionversus net income of$41.1 million**

  • Loss per diluted share of**$0.58versus earnings per diluted share of$0.40**

  • Adjusted Diluted EPS**(2)of$0.42versus$0.51**

  • Adjusted EBITDA**(3)of$57.2 millionversus$73.9 million**

**UpdatingFiscal Year 2026(4)**Outlook:

  • Net sales expected to range between $1.345 and $1.355 billion, or a decline of roughly 7% to 6% year-over-year

  • Gross margins expected to decline approximately 375 basis points year-over-year

  • Adjusted EBITDA expected to range between $220 and $225 million, or -21% to -19% year-over-year

“Our third quarter results reflect initial steps against the turnaround priorities we outlined last quarter. While we are still in the early stages of this work, we are beginning to see some signs of improved alignment around our three key priorities. We delivered third quarter net sales of $357 million and Adjusted EBITDA of $57 million, ahead of our expectations, with performance supported in part by the early effect of select cost actions we announced last quarter,” said Joe Scalzo, President and Chief Executive Officer.

Scalzo continued, “At the same time, we recognize significant work remains, and our priorities are unchanged. We are focused on strengthening our business model, improving the consistency of our execution, and reinvesting behind our most important brand opportunities to support household penetration. We believe steady progress against these actions will position Simply Good Foods to return to sustainable, profitable growth over time.”

ThirdQuarter2026****Results

Net sales of $357.0 million decreased 6.3% versus the comparable year ago period, driven by a decline for Atkins of 24.6%, which was only partially offset by Quest and OWYN growth of 1.1% and 3.6%, respectively. The Company's net sales performance was largely driven by known distribution-related declines for Atkins and softer retail takeaway, similar to what the Company experienced in the second quarter.

Total Simply Good Foods retail takeaway(5) decreased about 6.7% driven by a growth for Quest of 1.4% and a decline for OWYN of 1.3%, while Atkins declined 23.9%, which was largely as expected for the brand due to known distribution losses.

Gross profit of $116.1 million decreased 16.2% versus the comparable year ago period, driven by volume declines, higher input costs, and restructuring costs. Gross margin was 32.5%, a decline of 390 basis points versus prior year, which was largely driven by $6.2 million of restructuring costs (a 180-basis point headwind) and higher input costs.

Selling and marketing expenses of $39.2 million increased 15.9% versus the comparable year ago period, which was largely driven by investments in our selling capability, increased spending to support longer-term brand growth and $1.1 million of restructuring costs.

General and administrative ("G&A") expenses of $40.5 million, which contain $6.2 million in restructuring costs, decreased 1.9% versus the comparable year ago period, which contained $5.2 million of integration expenses.

As part of the Company's process to evaluate the carrying value of its brands, the Company recognized an aggregate $82.0 million non-cash, impairment charge related to Goodwill, and the Atkins and OWYN brand intangible assets. The impairment is largely the result of declines in stock price.

Net interest expense of $5.1 million reflected a 20.3% increase versus the comparable year ago period due to a higher debt balance.

The effective tax rate was 5.4%.

Net loss of $52.0 million compared to net income of $41.1 million for the comparable year ago period.

Adjusted EBITDA of $57.2 million decreased 22.5% versus the comparable year ago period.

Reported loss per diluted share was $0.58 versus reported earnings per diluted share of $0.40 in the comparable year ago period.

Adjusted Diluted EPS was $0.42 versus $0.51 in the comparable year ago period.

Weighted average diluted shares outstanding of 89.9 million declined modestly versus the comparable year ago period, reflecting share repurchases.

Year-to-DateThirdQuarter Fiscal Year 2026 Highlights vs. Year-to-dateThirdQuarter Fiscal Year 2025

Net sales of $1,023.2 million decreased 5.4% versus the comparable year ago period, driven by declines for Atkins and OWYN of 22.6% and 5.5%, respectively, offset by Quest growth of 3.4%. Atkins distribution related declines were largely as expected. OWYN's net sales decline was the result of poor velocities, including on newly expanded distribution.

Total Simply Good Foods retail takeaway decreased about 3.8% driven by growth for Quest and OWYN of 5.1% and 4.8%, respectively, while Atkins declined 22.1%, largely as expected.

Gross profit of $329.0 million decreased 17.6% versus the comparable year ago period, driven by higher input costs. Gross margin was 32.2%, a 470-basis point decline versus the comparable year ago period, driven mainly by $6.5 million of one-time OWYN integration expenses and $6.2 million of restructuring costs.

Selling and marketing expenses of $97.0 million decreased 4.8% versus the comparable year ago period driven by planned marketing declines for Atkins, which more than offset increases to support growth for Quest and OWYN.

G&A expenses of $113.3 million, which contain restructuring costs of $10.8 million, integration expenses of $4.1 million, and term loan transaction fees of $3.0 million, decreased 1.7% versus the comparable year ago period, which contained $12.1 million of integration expenses and $0.7 million of term loan transaction fees.

As part of the Company's process to evaluate the carrying value of its brands, the Company recognized an aggregate $331.0 million non-cash, impairment charge related to Goodwill, and the Atkins and OWYN brand intangible assets. The impairment is largely the result of current fiscal year performance, updated projections of future revenue, and declines in stock price.

Net interest expense of $13.8 million reflected a 18.4% decrease versus the comparable year ago period due to lower interest rates.

The effective tax rate was 22.1%.

Net loss of $186.4 million compared to net income of $116.0 million versus the comparable year ago period.

Adjusted EBITDA of $168.4 million decreased 20.5% versus the comparable year ago period.

Reported loss per diluted share was $1.99 versus reported earnings per share of $1.14 in the comparable year ago period.

Adjusted Diluted EPS was $1.26 versus $1.49 in the comparable year ago period.

Weighted average diluted shares outstanding of 93.7 million declined modestly versus the comparable year ago period, reflecting share repurchases.

Balance Sheet and****Cash Flow

At the end of the third quarter of fiscal year 2026, the Company had cash of $123.9 million and an outstanding principal balance on its term loan of $400.0 million, bringing the Company's quarter-end trailing twelve-month Net Debt to Adjusted EBITDA ratio to 1.2x(6). Higher cash and debt balances reflect the Company's strategic decision to borrow an additional $150.0 million concurrently with a three-year extension of the Company's existing credit facilities, which closed in November 2025. Year-to-date cash flow from operations was about $102.2 million versus $133.1 million in the comparable year ago period. Capital expenditures were approximately $10.1 million.

During the quarter, the Company repurchased approximately 2.1 million shares of its common stock for approximately $25 million.

Fiscal Year2026Outlook

The Company is updating its previously provided outlook for fiscal year 2026:

  • Net Sales expected to range between $1.345 to $1.355 billion, or a decline of roughly 7% to 6% year-over-year

  • Gross Margins expected to decline approximately 375 basis points year-over-year

  • Adjusted EBITDA expected to range between $220 to $225 million, or -21% to -19% year-over-year

The Company continues to expect net interest expense in the range of $19 to $21 million. The Company now expects capital expenditures in the range of $20 to $25 million. Finally, given the effect of year-to-date share repurchases, the Company now expects a weighted average diluted share count of approximately 90 million shares.

For the fourth quarter of fiscal year 2026:

  • The Company expects Net Sales to range between $322 to $332 million, or -13% to -10% year-over-year

  • Adjusted EBITDA expected to range from $52 to $57 million, or -22% to -14% year-over-year

  • The Company expects an effective tax rate of approximately 25%

The foregoing outlook assumes current economic conditions, consumer purchasing behavior and prevailing tariff rates remain generally consistent across the Company's fiscal year.


| (1) | | All comparisons for the third quarter ended May 30, 2026, versus the comparable year-ago period ended May 31, 2025. |

| (2) | | Adjusted Diluted Earnings Per Share is a non-GAAP financial measure. The Company excludes restructuring costs, acquisition-related costs,such as Business Transaction costs, integration expense and depreciation and amortization expensein calculating Adjusted Diluted Earnings Per Share. Please refer to "Reconciliation of Adjusted Diluted Earnings Per Share" in this press release for an explanation and reconciliation of this non-GAAP financial measure. |

| (3) | | Adjusted Earnings Before Interest, Taxes, Depreciation and Amortization ("EBITDA") is a non-GAAP financial measure. Please refer to the "Reconciliation of EBITDA and Adjusted EBITDA" in this press release for an explanation and reconciliation of this non-GAAP financial measure. |

| (4) | | The Company does not provide a forward-looking reconciliation of expected Fiscal Year 2026 Adjusted EBITDA to Net Income, the most directly comparable GAAP financial measure, because we are unable to provide such a reconciliation without unreasonable effort due to the unavailability of reliable estimates for certain components of consolidated net income and the respective reconciliations, and the inherent difficulty of predicting what the changes in these components will be throughout the fiscal year. As these items may vary greatly between periods, we are unable to address the probable significance of the unavailable information, which could significantly affect our future financial results. |

| (5) | | Combined Quest, Atkins, and OWYNCircanaMULO++C and Company unmeasured channel estimate for the 13-weeks ending May 31, 2026, vs. the comparable 13-week year ago period. |

| (6) | | Net Debt to Adjusted EBITDA is a non-GAAP financial measure which Simply Good Foods defines as the total debt outstanding under our credit agreement with Barclays Bank PLC and other parties ("Credit Agreement"), reduced by cash and cash equivalents, and divided by the Company's trailing twelve month Adjusted EBITDA, as previously defined. The Company does not provide a forward-looking reconciliation of Net Debt to Adjusted EBITDA to Net Debt to Consolidated Net Income, the most directly comparable GAAP financial measures, expected for Fiscal Year 2026, because we are unable to provide such a reconciliation without unreasonable effort due to the unavailability of reliable estimates for certain components of consolidated net income and the respective reconciliations, and the inherent difficulty of predicting what the changes in these components will be throughout the fiscal year. As these items may vary greatly between periods, we are unable to address the probable significance of the unavailable information, which could significantly affect our future financial results. |

| | | |

Conference Call and Webcast Information The Company will host a conference call with members of the executive management team to discuss these results today, Thursday, July 9, 2026, at 6:30 a.m. Mountain time (8:30 a.m. Eastern time). Investors interested in participating in the live call can dial 877-407-0792 from the U.S. or 201-689-8263 from international locations. A live webcast will be available via the "Investors" section of the Company's website at www.thesimplygoodfoodscompany.com. A telephone replay will be available approximately two hours after the call concludes and will remain accessible through July 23, 2026, by dialing 844-512-2921 from the U.S., or 412-317-6671 from international locations, and entering confirmation code 13760722.

About The Simply Good Foods Company The Simply Good Foods Company (Nasdaq: SMPL), headquartered in Denver, Colorado, is a consumer packaged food and beverage company with ambitious goals to raise the bar on what food can be with trusted brands and innovative nutritious snacking products. Within our portfolio of trusted brands (Quest™, Atkins™, and OWYN™), we offer a wide variety of nutritional snacks and beverages, including high protein chips, bars, ready-to-drink (RTD) shakes, and powders, and low sugar, low carb sweets and baked goods. We are a leader of the nutritious snacking movement, poised to expand our healthy lifestyle platform through innovation-driven organic growth and external investment opportunities. To learn more, visit www.thesimplygoodfoodscompany.com.

Investor Contact Matt Siler Vice President, Investor Relations and Treasury The Simply Good Foods Company [email protected]

Forward Looking Statements

Certain statements made herein are not historical facts but are forward-looking statements for purposes of the safe harbor provisions under The Private Securities Litigation Reform Act of 1995. Forward-looking statements generally are accompanied by or include words such as “will”, “expect”, “intends” or other similar words, phrases or expressions. These statements relate to future events or our future financial or operational performance and involve known and unknown risks, uncertainties and other factors that could cause our actual results, levels of activity, performance or achievement to differ materially from those expressed or implied by these forward-looking statements. We caution you that these forward-looking statements are not guarantees of future performance and involve risks, uncertainties and assumptions that are difficult to predict. You should not place undue reliance on forward-looking statements. These statements reflect our current views with respect to future events, are based on assumptions and are subject to risks and uncertainties. These risks and uncertainties relate to, among other things, our operations being dependent on changes in consumer preferences and purchasing habits regarding our products, a global supply chain and effects of supply chain constraints, inflationary pressure and tariffs on us and our contract manufacturers, our ability to continue to operate at a profit or to maintain our margins, the sufficiency of our sources of liquidity and capital, our ability to maintain current operation levels and implement our growth strategies, our ability to maintain and gain market acceptance for our products or new products, our ability to capitalize on attractive opportunities, our ability to respond to competition and changes in the economy including changes regarding inflation and increasing ingredient and packaging costs and labor challenges due to tariffs or other challenges at our contract manufacturers and third party logistics providers, the amounts of or changes with respect to certain anticipated raw materials and other costs, difficulties and delays in achieving the synergies and cost savings in connection with acquisitions, changes in the business environment in which we operate including general financial, economic, capital market, regulatory and geopolitical conditions affecting us and the industry in which we operate, our ability to maintain adequate product inventory levels to timely supply customer orders, changes in taxes, tariffs, duties, governmental laws and regulations, the availability of or competition for other brands, assets or other opportunities for investment by us or to expand our business, competitive product and pricing activity, difficulties of managing growth profitably, the effect pandemics or other global disruptions on our business, financial condition and results of operations, the loss of one or more members of our management team, potential for increased costs, the harm to our business resulting from unauthorized access of the information technology systems we use in our business, and other risks and uncertainties indicated in the Company’s Form 10-K, Form 10-Q, and Form 8-K reports (including all amendments to those reports) filed with the U.S. Securities and Exchange Commission from time to time. In addition, forward-looking statements provide the Company’s expectations, plans or forecasts of future events and views as of the date of this communication. Except as required by law, the Company undertakes no obligation to update such statements to reflect events or circumstances arising after such date and cautions investors not to place undue reliance on any such forward-looking statements. These forward-looking statements should not be relied upon as representing the Company’s assessments as of any date subsequent to the date of this communication.

| |

| The Simply Good Foods Company and Subsidiaries Consolidated Balance Sheets (Unaudited, dollars in thousands, except share and per share data) |

| |

| | | May 30, 2026 | | August 30, 2025 |

| Assets | | | | |

| Current assets: | | | | |

| Cash | | $ | 123,884 | | | $ | 98,468 | |

| Accounts receivable, net | | | 156,067 | | | | 164,978 | |

| Inventories, net | | | 164,314 | | | | 167,217 | |

| Prepaid expenses | | | 4,432 | | | | 7,209 | |

| Other current assets | | | 15,441 | | | | 15,812 | |

| Total current assets | | | 464,138 | | | | 453,684 | |

| | | | | |

| Long-term assets: | | | | |

| Property and equipment, net | | | 42,334 | | | | 39,738 | |

| Intangible assets, net | | | 956,883 | | | | 1,261,603 | |

| Goodwill | | | 551,974 | | | | 589,974 | |

| Other long-term assets | | | 47,115 | | | | 51,046 | |

| Total assets | | $ | 2,062,444 | | | $ | 2,396,045 | |

| | | | | |

| Liabilities and stockholders’ equity | | | | |

| Current liabilities: | | | | |

| Accounts payable | | $ | 57,025 | | | $ | 78,298 | |

| Accrued interest | | | 63 | | | | 44 | |

| Accrued expenses and other current liabilities | | | 39,690 | | | | 46,219 | |

| Total current liabilities | | | 96,778 | | | | 124,561 | |

| | | | | |

| Long-term liabilities: | | | | |

| Long-term debt, less current maturities | | | 397,037 | | | | 249,066 | |

| Deferred income taxes | | | 107,057 | | | | 166,091 | |

| Other long-term liabilities | | | 43,452 | | | | 49,494 | |

| Total liabilities | | | 644,324 | | | | 589,212 | |

| See commitments and contingencies (Note 9) | | | | |

| | | | | |

| Stockholders’ equity: | | | | |

| Preferred stock, $0.01 par value, 100,000,000 shares authorized, none issued | | | — | | | | — | |

| Common stock, $0.01 par value, 600,000,000 shares authorized, 104,050,545 and 103,688,071 shares issued at May 30, 2026, and August 30, 2025, respectively | | | 1,041 | | | | 1,037 | |

| Treasury stock, 15,609,338 shares and 3,957,571 shares at cost at May 30, 2026, and August 30, 2025, respectively | | | (344,670 | ) | | | (129,337 | ) |

| Additional paid-in-capital | | | 1,358,758 | | | | 1,346,687 | |

| Retained earnings | | | 404,478 | | | | 590,879 | |

| Accumulated other comprehensive loss | | | (1,487 | ) | | | (2,433 | ) |

| Total stockholders’ equity | | | 1,418,120 | | | | 1,806,833 | |

| Total liabilities and stockholders’ equity | | $ | 2,062,444 | | | $ | 2,396,045 | |

| | | | | | | | | |

| |

| The Simply Good Foods Company and Subsidiaries Consolidated Statements of Income and Comprehensive Income (Unaudited, dollars in thousands, except share and per share data) |

| |

| | | Thirteen Weeks Ended | | Thirty-Nine Weeks Ended |

| | | May 30, 2026 | | May 31, 2025 | | May 30, 2026 | | May 31, 2025 |

| Net sales | | $ | 356,983 | | | $ | 380,956 | | | $ | 1,023,194 | | | $ | 1,081,879 | |

| Cost of goods sold | | | 240,884 | | | | 242,437 | | | | 694,162 | | | | 682,737 | |

| Gross profit | | | 116,099 | | | | 138,519 | | | | 329,032 | | | | 399,142 | |

| | | | | | | | | |

| Operating expenses: | | | | | | | | |

| Selling and marketing | | | 39,173 | | | | 33,799 | | | | 97,017 | | | | 101,871 | |

| General and administrative | | | 40,453 | | | | 41,229 | | | | 113,334 | | | | 115,306 | |

| Depreciation and amortization | | | 4,337 | | | | 4,171 | | | | 13,279 | | | | 12,479 | |

| Business transaction costs | | | — | | | | — | | | | — | | | | 820 | |

| Loss on impairment | | | 82,000 | | | | — | | | | 331,000 | | | | — | |

| Total operating expenses | | | 165,963 | | | | 79,199 | | | | 554,630 | | | | 230,476 | |

| | | | | | | | | |

| (Loss) income from operations | | | (49,864 | ) | | | 59,320 | | | | (225,598 | ) | | | 168,666 | |

| | | | | | | | | |

| Other income (expense): | | | | | | | | |

| Interest income | | | 689 | | | | 673 | | | | 2,068 | | | | 2,150 | |

| Interest expense | | | (5,776 | ) | | | (4,900 | ) | | | (15,895 | ) | | | (19,099 | ) |

| Gain (loss) on foreign currency transactions | | | 1 | | | | (337 | ) | | | 134 | | | | (342 | ) |

| Other income | | | 15 | | | | (14 | ) | | | 151 | | | | 20 | |

| Total other (expense) | | | (5,071 | ) | | | (4,578 | ) | | | (13,542 | ) | | | (17,271 | ) |

| | | | | | | | | |

| (Loss) income before income taxes | | | (54,935 | ) | | | 54,742 | | | | (239,140 | ) | | | 151,395 | |

| Income tax (benefit) expense | | | (2,963 | ) | | | 13,640 | | | | (52,739 | ) | | | 35,424 | |

| Net (loss) income | | $ | (51,972 | ) | | $ | 41,102 | | | $ | (186,401 | ) | | $ | 115,971 | |

| | | | | | | | | |

| Other comprehensive income: | | | | | | | | |

| Foreign currency translation, net of reclassification adjustments | | | 101 | | | | 309 | | | | 946 | | | | (504 | ) |

| Comprehensive (loss) income | | $ | (51,871 | ) | | $ | 41,411 | | | $ | (185,455 | ) | | $ | 115,467 | |

| | | | | | | | | |

| (Loss) earnings per share from net (loss) income: | | | | | | | | |

| Basic | | $ | (0.58 | ) | | $ | 0.41 | | | $ | (1.99 | ) | | $ | 1.15 | |

| Diluted | | $ | (0.58 | ) | | $ | 0.40 | | | $ | (1.99 | ) | | $ | 1.14 | |

| Weighted average shares outstanding: | | | | | | | | |

| Basic | | | 89,940,680 | | | | 100,923,690 | | | | 93,677,801 | | | | 100,787,087 | |

| Diluted | | | 89,940,680 | | | | 101,635,521 | | | | 93,677,801 | | | | 101,669,998 | |

| | | | | | | | | | | | | | | | | |

| |

| The Simply Good Foods Company and Subsidiaries Consolidated Statements of****Cash Flows (Unaudited, dollars in thousands) |

| |

| | | Thirty-Nine Weeks Ended |

| | | May 30, 2026 | | May 31, 2025 |

| Operating activities | | | | |

| Net (loss) income | | $ | (186,401 | ) | | $ | 115,971 | |

| Adjustments to reconcile net (loss) income to net cash provided by operating activities: | | | | |

| Depreciation and amortization | | | 18,096 | | | | 15,480 | |

| Amortization of deferred financing costs and debt discount | | | 491 | | | | 1,334 | |

| Stock compensation expense | | | 13,186 | | | | 12,819 | |

| Loss on impairment | | | 331,000 | | | | — | |

| Estimated credit losses | | | 19 | | | | 231 | |

| Unrealized (gain) loss on foreign currency transactions | | | (134 | ) | | | 342 | |

| Deferred income taxes | | | (59,034 | ) | | | 10,583 | |

| Amortization of operating lease right-of-use asset | | | 4,494 | | | | 5,192 | |

| Other | | | 4,864 | | | | 1,063 | |

| Changes in operating assets and liabilities: | | | | |

| Accounts receivable, net | | | 9,270 | | | | (2,382 | ) |

| Inventories, net | | | (864 | ) | | | (23,185 | ) |

| Prepaid expenses | | | 2,753 | | | | (1,612 | ) |

| Other current assets | | | 434 | | | | (783 | ) |

| Accounts payable | | | (21,009 | ) | | | 12,887 | |

| Accrued interest | | | 19 | | | | (221 | ) |

| Accrued expenses and other current liabilities | | | (9,854 | ) | | | (10,788 | ) |

| Other assets and liabilities | | | (5,160 | ) | | | (3,844 | ) |

| Net cash provided by operating activities | | | 102,170 | | | | 133,087 | |

| | | | | |

| Investing activities | | | | |

| Purchases of property and equipment | | | (10,090 | ) | | | (2,516 | ) |

| Acquisition of business, net of cash acquired | | | — | | | | 1,713 | |

| Investments in intangible and other assets | | | — | | | | (1,389 | ) |

| Net cash used in investing activities | | | (10,090 | ) | | | (2,192 | ) |

| | | | | |

| Financing activities | | | | |

| Proceeds from option exercises | | | 1,056 | | | | 11,956 | |

| Tax payments related to issuance of restricted stock units and performance stock units | | | (2,167 | ) | | | (2,824 | ) |

| Repurchase of common stock | | | (213,204 | ) | | | (24,338 | ) |

| Principal payments of long-term debt | | | — | | | | (150,000 | ) |

| Proceeds from issuance of long-term debt | | | 150,000 | | | | — | |

| Deferred financing costs | | | (2,632 | ) | | | — | |

| Net cash used in financing activities | | | (66,947 | ) | | | (165,206 | ) |

| | | | | |

| Cash and cash equivalents | | | | |

| Net increase (decrease) in cash | | | 25,133 | | | | (34,311 | ) |

| Effect of exchange rate on cash | | | 283 | | | | (211 | ) |

| Cash at beginning of period | | | 98,468 | | | | 132,530 | |

| Cash and cash equivalents at end of period | | $ | 123,884 | | | $ | 98,008 | |

| | | | | | | | | |

Net Sales by Geographic Area and Brands

The following is a summary of revenue disaggregated by geographic area and brands:

| | | Thirteen Weeks Ended | | Thirty-Nine Weeks Ended |

| (In thousands) | | May 30, 2026 | | May 31, 2025 | | May 30, 2026 | | May 31, 2025 |

| North America (1) | | | | | | | | |

| Atkins | | $ | 84,649 | | $ | 112,287 | | $ | 254,636 | | $ | 329,105 |

| Quest | | | 230,260 | | | 227,737 | | | 652,045 | | | 630,445 |

| OWYN | | | 34,774 | | | 33,551 | | | 94,091 | | | 99,611 |

| Total North America | | | 349,683 | | | 373,575 | | | 1,000,772 | | | 1,059,161 |

| International | | | 7,300 | | | 7,381 | | | 22,422 | | | 22,718 |

| Total net sales | | $ | 356,983 | | $ | 380,956 | | $ | 1,023,194 | | $ | 1,081,879 |

| |

| (1) The North America geographic area consists of net sales substantially related to the United States and there is no individual foreign country to which more than 10% of the Company’s net sales are attributed or that is otherwise deemed individually material. |

| |

Reconciliation of EBITDA and Adjusted EBITDA

**EBITDA and Adjusted EBITDA.**EBITDA and Adjusted EBITDA are non-GAAP financial measures commonly used in our industry and should not be construed as alternatives to net income as an indicator of operating performance or as alternatives to cash flow provided by operating activities as a measure of liquidity (each as determined in accordance with GAAP). Simply Good Foods defines EBITDA as net income or loss before interest income, interest expense, income tax expense, depreciation and amortization, and Adjusted EBITDA as further adjusted to exclude the following items: loss on impairment, stock-based compensation expense, business transaction costs, purchase price accounting inventory step-up, integration costs, term loan transaction fees, restructuring, and other non-core expenses. The Company believes that EBITDA and Adjusted EBITDA, when used in conjunction with net income, are useful to provide additional information to investors. Management of the Company uses EBITDA and Adjusted EBITDA to supplement net income because these measures reflect operating results of the on-going operations, eliminate items that are not directly attributable to the Company’s underlying operating performance, enhance the overall understanding of past financial performance and future prospects, and allow for greater transparency with respect to the key metrics the Company’s management uses in its financial and operational decision making. The Company also believes that EBITDA and Adjusted EBITDA are frequently used by securities analysts, investors and other interested parties in the evaluation of companies in its industry. EBITDA and Adjusted EBITDA may not be comparable to other similarly titled captions of other companies due to differences in the non-GAAP calculation.

The following unaudited table provides a reconciliation of EBITDA and Adjusted EBITDA to its most directly comparable GAAP measure, which is net income, for the thirteen and thirty-nine weeks ended May 30, 2026, and May 31, 2025:

| (In thousands) | | Thirteen Weeks Ended | | Thirty-Nine Weeks Ended |

| | May 30, 2026 | | May 31, 2025 | | May 30, 2026 | | May 31, 2025 |

| Net (loss) income | | $ | (51,972 | ) | | $ | 41,102 | | | $ | (186,401 | ) | | $ | 115,971 | |

| Interest income | | | (689 | ) | | | (673 | ) | | | (2,068 | ) | | | (2,150 | ) |

| Interest expense | | | 5,776 | | | | 4,900 | | | | 15,895 | | | | 19,099 | |

| Income tax (benefit) expense | | | (2,963 | ) | | | 13,640 | | | | (52,739 | ) | | | 35,424 | |

| Depreciation and amortization | | | 6,027 | | | | 5,345 | | | | 18,096 | | | | 15,480 | |

| EBITDA | | | (43,821 | ) | | | 64,314 | | | | (207,217 | ) | | | 183,824 | |

| Loss on impairment | | | 82,000 | | | | — | | | | 331,000 | | | | — | |

| Stock-based compensation expense | | | 5,559 | | | | 4,027 | | | | 13,186 | | | | 12,819 | |

| Business transaction costs | | | — | | | | — | | | | — | | | | 820 | |

| Inventory step-up | | | — | | | | — | | | | — | | | | 1,412 | |

| Integration expense (1) | | | — | | | | 5,226 | | | | 10,621 | | | | 12,112 | |

| Term loan transaction fees | | | — | | | | — | | | | 3,030 | | | | 715 | |

| Restructuring and other costs | | | 13,549 | | | | — | | | | 18,073 | | | | — | |

| Other (2) | | | (46 | ) | | | 287 | | | | (318 | ) | | | 221 | |

| Adjusted EBITDA | | $ | 57,241 | | | $ | 73,854 | | | $ | 168,375 | | | $ | 211,923 | |

| |

| (1) Includes one-time effects from actions taken to mitigate OWYN product quality issues. (2) Other items consist principally of exchange impact of foreign currency transactions and other expenses. |

| |

Reconciliation of Adjusted Diluted Earnings Per Share

Adjusted Diluted Earnings per Share. Adjusted Diluted Earnings per Share is a non-GAAP financial measure commonly used in our industry and should not be construed as an alternative to diluted earnings per share as an indicator of operating performance. Simply Good Foods defines Adjusted Diluted Earnings Per Share as diluted earnings per share before loss on impairment, stock-based compensation expense, business transaction costs, purchase price accounting inventory step-up, integration costs, restructuring, and term loan transaction fees on a theoretical tax effected basis of such adjustments. The tax effect of such adjustments to Adjusted Diluted Earnings Per Share is calculated by applying an overall assumed statutory tax rate to each gross adjustment as shown in the reconciliation to Adjusted EBITDA, as previously defined. The assumed statutory tax rate reflects a normalized effective tax rate estimated based on assumptions regarding the Company's statutory and effective tax rate for each respective reporting period, including the current and deferred tax effects of each adjustment, and is adjusted for the effects of tax reform, if any. The Company consistently applies the overall assumed statutory tax rate to periods throughout each fiscal year and reassesses the overall assumed statutory rate on annual basis. The Company believes that the inclusion of these supplementary adjustments in presenting Adjusted Diluted Earnings per Share, when used in conjunction with diluted earnings per share, are appropriate to provide additional information to investors, reflects more accurately operating results of the on-going operations, enhances the overall understanding of past financial performance and future prospects and allows for greater transparency with respect to the key metrics the Company uses in its financial and operational decision making. The Company also believes that Adjusted Diluted Earnings per Share is frequently used by securities analysts, investors and other interested parties in the evaluation of companies in its industry. Adjusted Diluted Earnings per Share may not be comparable to other similarly titled captions of other companies due to differences in the non-GAAP calculation.

The following unaudited tables below provide a reconciliation of Adjusted Diluted Earnings Per Share to its most directly comparable GAAP measure, which is diluted earnings per share, for the thirteen and thirty-nine weeks ended May 30, 2026, and May 31, 2025:

| | | | | | | | | |

| | | Thirteen Weeks Ended | | Thirty-Nine Weeks Ended |

| | | May 30, 2026 | | May 31, 2025 | | May 30, 2026 | | May 31, 2025 |

| Diluted (loss) earnings per share | | $ | (0.58 | ) | | $ | 0.40 | | | $ | (1.99 | ) | | $ | 1.14 | |

| | | | | | | | | |

| Depreciation and amortization | | | 0.07 | | | | 0.05 | | | | 0.19 | | | | 0.15 | |

| Loss on impairment | | | 0.91 | | | | — | | | | 3.53 | | | | — | |

| Stock-based compensation expense | | | 0.06 | | | | 0.04 | | | | 0.14 | | | | 0.13 | |

| Business transaction costs | | | — | | | | — | | | | — | | | | 0.01 | |

| Inventory step-up | | | — | | | | — | | | | — | | | | 0.01 | |

| Integration expense | | | — | | | | 0.05 | | | | 0.11 | | | | 0.12 | |

| Term loan transaction fees | | | — | | | | — | | | | 0.03 | | | | 0.01 | |

| Restructuring and other costs | | | 0.15 | | | | — | | | | 0.19 | | | | — | |

| Tax effects of adjustments (1) | | | (0.19 | ) | | | (0.04 | ) | | | (0.95 | ) | | | (0.11 | ) |

| Rounding (2) | | | — | | | | 0.01 | | | | 0.01 | | | | — | |

| Adjusted diluted earnings per share | | $ | 0.42 | | | $ | 0.51 | | | $ | 1.26 | | | $ | 1.46 | |

| |

| (1) This line item reflects the aggregate tax effect of all non-tax adjustments reflected in the preceding line items of the table. The tax effect of each adjustment is computed (i) by dividing the gross amount of the adjustment, as shown in the Adjusted EBITDA reconciliation, by the number of diluted weighted average shares outstanding for the applicable fiscal period and (ii) applying an overall assumed statutory tax rate of 25% for the thirteen and thirty-nine week periods ended May 30, 2026, as well as the thirteen and thirty-nine week periods ended May 31, 2025. |

| (2) Adjusted Diluted Earnings Per Share amounts are computed independently for each quarter. Therefore, the sum of the quarterly Adjusted Diluted Earnings Per Share amounts may not equal the year to date Adjusted Diluted Earnings Per Share amounts due to rounding. |

| |

Reconciliation of Net Debt to Adjusted EBITDA

Net Debt to Adjusted EBITDA. Net Debt to Adjusted EBITDA is a non-GAAP financial measure which Simply Good Foods defines as the total debt outstanding under our credit agreement with Barclays Bank PLC and other parties (“Credit Agreement”), reduced by cash and cash equivalents, and divided by the trailing twelve months of Adjusted EBITDA, as previously defined.

The following unaudited table below provides a reconciliation of Net Debt to Adjusted EBITDA as of May 30, 2026:

| (In thousands) | | May 30, 2026 |

| Net Debt: | | |

| Total debt outstanding under the Credit Agreement | | $ | 400,000 | |

| Less: cash and cash equivalents | | | (123,884 | ) |

| Net Debt as of May 30, 2026 | | $ | 276,116 | |

| | | |

| Trailing twelve months Adjusted EBITDA: | | |

| Add: Adjusted EBITDA for the thirty-nine weeks ended May 30, 2026 | | $ | 168,375 | |

| Add: Adjusted EBITDA for the fiscal year ended August 30, 2025 | | | 278,162 | |

| Less: Adjusted EBITDA for the thirty-nine weeks ended May 31, 2025 | | | (211,923 | ) |

| Trailing twelve months Adjusted EBITDA as of May 30, 2026 | | $ | 234,614 | |

| | | |

| Net Debt to Adjusted EBITDA | | | 1.2 | x |

×

Prompts

The Simply Good Foods Company (ticker SMPL), listed in United States.

ETFs Holding The Simply Good Foods Company

ETF Weight in ETF Shares Market value As of
DSMC 0.61% 58,876 $ 781.873K Jun 30, 2026
SQLV 0.34% 7,378 $ 97.98K Jun 30, 2026
FSCC 0.31% 97,509 $ 1.116M Aug 31, 2026
FSEV 0.19% 939 $ 12.47K Jun 30, 2026
IVSS 0.14% 2,779 $ 36.905K Jun 30, 2026
VFVA 0.10% 86,036 $ 985.112K Aug 31, 2026
RESM 0.04% 121 $ 1,606.88 Jun 30, 2026
FEAC 0.04% 835 $ 11.089K Jun 30, 2026
AVUV 0.04% 921,159 $ 11.625M Nov 16, 2026
AVSC 0.04% 99,170 $ 1.252M Nov 16, 2026
FESM 0.04% 160,042 $ 2.125M Jun 30, 2026
JMEE 0.03% 67,669 $ 845.863K Nov 17, 2026
JSTC 0.02% 5,054 $ 63.781K Nov 17, 2026
DXUV 0.01% 53,266 $ 673.815K Nov 12, 2026
AVUS 0.00% 17,280 $ 218.074K Nov 16, 2026