Skip navigation Opens in a new window About Us Careers CRA News Investors Holiday Closure Schedule |* Locations |* Support |* Search |* Additional Logins * Credit Cards * [FSA/HRA/HSA](https://bankwithsouthern.lh1ondemand.com/) * [RETIREMENT…
Skip navigation
Opens in a new window



|* Locations
|* Support
|* Search
|* Additional Logins
* Credit Cards
*   [FSA/HRA/HSA](https://bankwithsouthern.lh1ondemand.com/)

*   [RETIREMENT PLAN](https://www.go-retire.com/bankwithsouthern/)

*   [TRUST PORTFOLIO](https://login2.fisglobal.com/idp/0496A/?ClientID=PALUI)
Login

Account Login

Click Here to Access or Enroll for Online Banking.
Learn More >
Enroll Now >
Login
Account Login
Click Here to Access or Enroll for Online Banking.

You are about to leave BankWithSouthern.com
This link takes you to a third-party website that is not controlled by Southern Bank, and whose privacy policy may differ from ours. Southern Bank is not responsible for and does not guarantee the content of, or products/services provided by, this third-party site.
If you do not wish to leave the site, please click the “X” in the upper right hand corner, or reload the page in your browser.
Continue >
This link takes you to the login portal for your Southern Bank credit card. The portal is provided by our trusted partner, Elan Financial Services, who is the creditor and issuer of our credit cards. Southern Bank does not control the content provided by Elan Financial Services, and their privacy policies may differ from ours.
Continue >
You are now leaving Southern Bank's website and will be redirected to a co-branded site operated in partnership with Banzai. While we have partnered with Banzai to provide educational content, Southern Bank is not responsible for the content, products, or services on the external site. Please note, the privacy and security policies of Banzai differs from ours. For more information, consult Banzai's Privacy Policy and Terms of Use.
Continue >
Press Release
07/23/2026
Southern Bank to Award a Total of $400,000 to 22 Non-Profits in Missouri Communities Through Matching Grant Partnership with the FHLB Des Moines’ Member Impact Fund
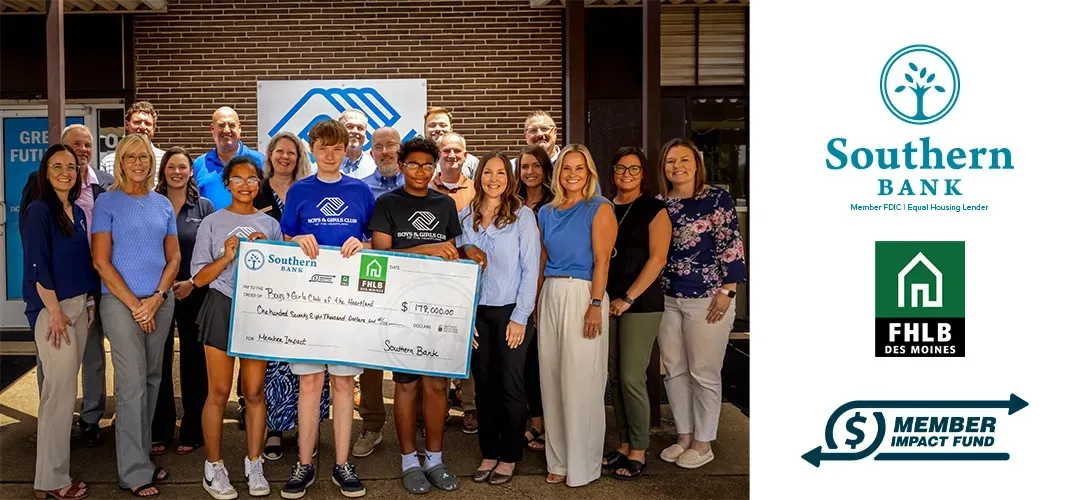
Southern Bank announced that 22 non-profit organizations in Missouri communities will receive grants made possible through the Federal Home Loan Bank of Des Moines’ (FHLB Des Moines) Member Impact Fund. This matching grant program is designed to amplify the community engagement of FHLB Des Moines member institutions, like Southern Bank, by supporting local housing and economic needs.
“We are very thankful for the opportunity to participate with the FHLB Des Moines’ Member Impact Fund to help our communities,” said Matt Funke, President and CEO of Southern Bank. “A key part of Southern Bank’s vision to ‘create opportunity through growth’ is providing for the well-being of our communities, working to advance their economic, social, and educational prospects. Our team members value ‘making a difference,’ and we seek opportunities to support our community – this FHLB program helps us by generously multiplying the impact that we can make across Missouri.”
The FHLB Des Moines received 956 applications for funding from 174 member institutions and it matched $3 for every $1 contributed by a member institution, resulting in $6.5 million in contributions from members and $19.4 million awarded by FHLB Des Moines to Missouri non-profits.
Southern Bank committed its funds, along with the matching funds available from FHLB Des Moines, to contribute to charities and non-profits in Missouri. A list of awardees is below:
- Gibson Center for Behavioral Change – Cape Girardeau
- Cape Area Habitat for Humanity – Cape Girardeau
- Boonslick Senior Center – Boonville
- Hill crest Platte County – Platte Woods
- Pro Deo Youth Center – Lee’s Summit
- Synergy Services – Kansas City
- Grace and Purpose Recovery Home for Women – Chillicothe
- North Central Missouri Children’s Advocacy Center – Trenton
- Boys and Girls Club of the Heartland – Poplar Bluff
- Missouri Delta Medical Center – Sikeston
- Food Bank, First Assembly of God Church – Van Buren
- Big Springs Sheltered Workshop – Van Buren
- Qulin Food Pantry – Qulin
- Boys & Girls Club of the Greater West Plains Area – West Plains
- Kenny Rogers Children’s Center – Sikeston
- Independent Living Center of Southeast Missouri – Poplar Bluff
- Springfield Victory Mission – Springfield
- Crosslines Community Outreach – Springfield
- Senior Friendship Site – Forsyth
- Pivotal Point Transitional Housing – St. Joseph
- Lutheran Development Group – St. Louis
- Dutchtown Main Streets – St. Louis
Since its launch in 2023, the Member Impact Fund has provided more than $106 million in grants from FHLB Des Moines, generating over $144 million in combined support for affordable housing and community development. Notably, every eligible application submitted to the program has received funding, reflecting the FHLB Des Moines’ strong commitment to partnership and impact.
About Southern Bank
Founded in 1887, Southern Bank has built a legacy of serving customers and communities. Today, with over $5 billion in assets, Southern Bank has more than 60 branches across four states. To learn more, please visit bankwithsouthern.com. Southern Bank is Member FDIC and an Equal Housing Lender.
About Federal Home Loan Bank of Des Moines
The FHLB Des Moines is deeply committed to strengthening communities, serving 13 states and three U.S Pacific territories as a member-owned cooperative. FHLB works together with over 1,200 member financial institutions to support affordable housing, economic development and community improvement.
FHLB Des Moines is one of 11 regional Banks that make up the Federal Home Loan Bank System. Members include community and commercial banks, credit unions, insurance companies, thrifts and community development financial institutions. FHLB Des Moines is wholly owned by its members and receives no taxpayer funding. For additional information about FHLB Des Moines, please visit fhlbdm.com
.
More in Press Release
More in Press Release
[
\
Press Release\
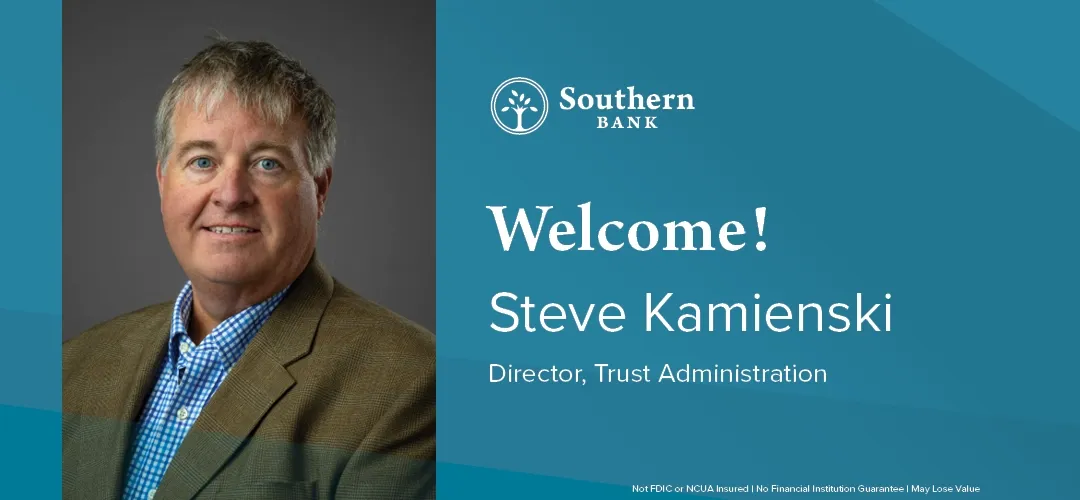
Southern Bank Welcomes Steve Kamienski
--------------------------------------
Southern Bank Welcomes Steve Kamienski as Director of Trust Administration.
Read More >](https://www.bankwithsouthern.com/news/southern-bank-welcomes-steve-kamienski/)
[
\
Press Release\
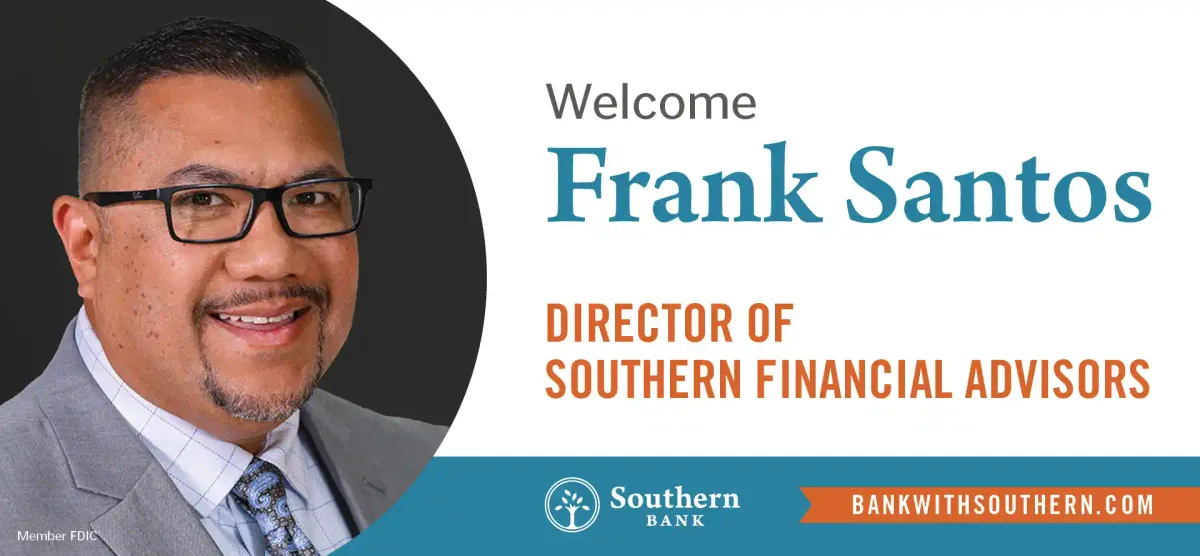
Frank Santos New Director of Southern Financial Advisors
--------------------------------------------------------
Southern Bank Welcomes Frank Santos as New Director of Southern Financial Advisors
Read More >](https://www.bankwithsouthern.com/news/frank-santos-director-of-southern-financial-advisors/)
[
\
Press Release\
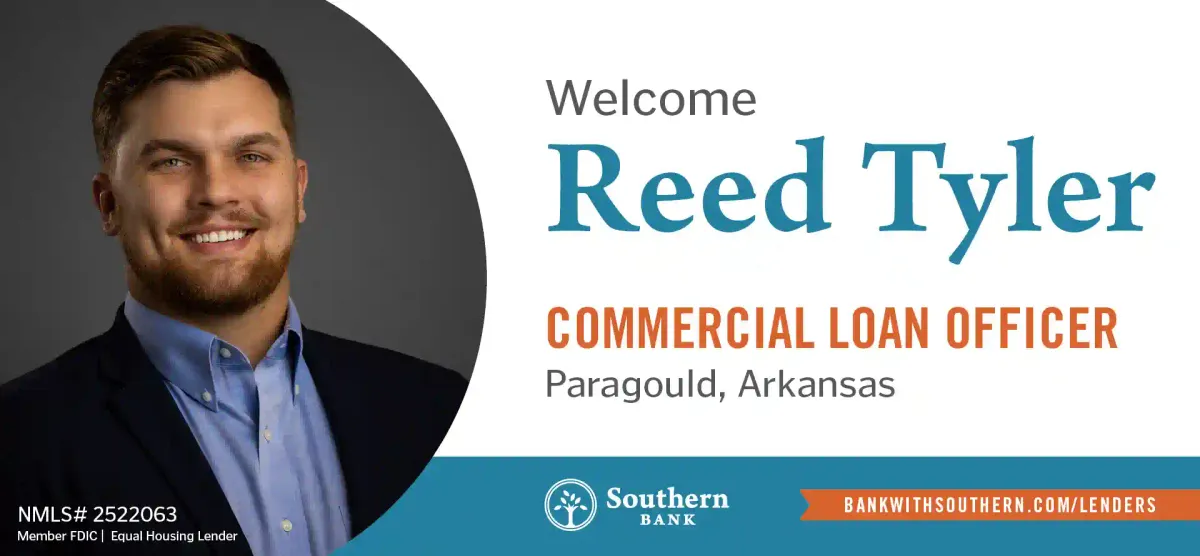
Reed Tyler New Commercial Loan Officer
--------------------------------------
Southern Bank Welcomes Reed Tyler as New Commercial Loan Officer
Read More >](https://www.bankwithsouthern.com/news/reed-tyler-new-commercial-loan-officer/)

Routing Number: 281573259
(855) 452-7272
Personal
Online & Mobile Banking
Checking & Savings
Mortgage & Refinance
Loans & Credit
Business
Southern Wealth & Insurance
Business Financing
Business Banking
Business Services
Southern Wealth & Insurance
Personal>
Online & Mobile Banking>
Digital Banking Overview
Online Banking
Mobile Banking
Innovations
Security & Technology
Banking Tools
Zelle®
Checking & Savings>
Bank Accounts Overview
Checking Accounts
Mastercard® Debit Card
Savings Accounts
Money Market Accounts
CDs
Compare Accounts
High Yield Savings Account
Mortgage & Refinance>
Home Loan Overview
Mortgage
Refinance
Home Equity
Home Buyer Help
Loans & Credit>
Loans & Credit Overview
Auto, ATV, RV, Boat
Deposit Secured Loans
Credit Cards
Calculators
Make a Loan Payment
Find A Loan Officer
Business>
Business Banking>
Business Banking Overview
Business Accounts
Public Entities
Business Switch Kit
Business Financing>
Business Loans Overview
Agricultural Loans
Small Business Loans, USDA & RDA Loans
Working Capital Loans
Business Real Estate
Equipment Loans
Business Lending Team
Business Services>
Business Services Overview
Cash Management
Remote Deposit Capture
Clover Merchant Services
Business Credit Cards
Make a Loan Payment
Zelle® Small Business
Southern Wealth & Insurance>
Overview
Southern Financial Advisors
Southern Wealth & Trust
Southern Insurance
### Locations
Southern Bank in Advance
310 Ruth St.
Advance, MO 63730
Southern Bank in Alton
100 Wallace Drive
Alton, MO 65606
Southern Bank in Arnold
3494 Jeffco Blvd.
Arnold, MO 63010
Southern Bank in Benton
52 W. Missouri St.
Benton, MO 63736
Southern Bank in Bloomfield
505 Highway 25 South
Bloomfield, MO 63825
Southern Bank in Boonville
400 E Spring Street
Boonville, MO 65233
Southern Bank in Brookfield
322 S Main Street
Brookfield, MO 64628
Southern Bank in Cape Girardeau
380 N. Kingshighway St
Cape Girardeau, MO 63701
Southern Bank in Cape Girardeau
3168 William Street
Cape Girardeau, MO 63703
Southern Bank in Chaffee
125 E. Yoakum
Chaffee, MO 63740
Southern Bank in Chillicothe
515 Washington Street
Chillicothe, MO 64601
Southern Bank in Clever
7410 Veterans Blvd.
Clever, MO 65631
Southern Bank in Dexter
713 Business 60 West
Dexter, MO 63841
Southern Bank in Dexter
303 W. Market
Dexter, MO 63841
Southern Bank in Doniphan
302 Washington Street
Doniphan, MO 63935
Southern Bank in Essex
101 Trotter St
Essex, MO 63846
Southern Bank in Forsyth
15775 US Hwy 160
Forsyth, MO 65653
Southern Bank in Gideon
106 Main St.
Gideon, MO 63848
Southern Bank in Jackson
727 West Main Street
Jackson, MO 63755
Southern Bank in Kansas City
7553 NW Barry Road
Kansas City, MO 64153
Southern Bank in Kansas City
8405 N Oak Trafficway
Kansas City, MO 64155
Southern Bank in Kearney
2041 Commerce Drive
Kearney, MO 64060
Southern Bank in Kennett
301 First Street
Kennett, MO 63857
Southern Bank in Kimberling City
11892 State Hwy 13
Kimberling City, MO 65686
Southern Bank in Lee's Summit
1150 NE Douglas Street
Lee's Summit, MO 64086
Southern Bank in Lee's Summit
5000 NE Lakewood Way
Lee's Summit, MO 64064
Southern Bank in Macon
707 E. Briggs Drive
Macon, MO 63552
Southern Bank in Marshfield
1292 Banning Street
Marshfield, MO 65706
Southern Bank in Maryville
105 N Main
Maryville, MO 64468
Southern Bank in Nixa
305 W Mt Vernon
Nixa, MO 65714
Southern Bank in Nixa
9005 Sawgrass Ave
Nixa, MO 65714
Southern Bank in Ozark
2471 W Jackson
Ozark, MO 65721
Southern Bank in Poplar Bluff
2991 Oak Grove Road
Poplar Bluff, MO 63901
Southern Bank in Poplar Bluff
4214 Highway PP
Poplar Bluff, MO 63901
Southern Bank in Poplar Bluff
531 Vine Street
Poplar Bluff, MO 63901
Southern Bank in Poplar Bluff
2001 North Westwood Blvd
Poplar Bluff, MO 63901
Southern Bank in Qulin
13371 Highway 53
Qulin, MO 63961
Southern Bank in Rogersville
175 Johnstown Drive
Rogersville, MO 65742
Southern Bank in Rolla
210 West 10th Street
Rolla, MO 65401
Southern Bank in Sikeston
1205 South Main Street
Sikeston, MO 63801
Southern Bank in Smithville
100 NE State Hwy 92
Smithville, MO 64089
Southern Bank in Springfield
2911 East Sunshine
Springfield, MO 65804
Southern Bank in Springfield
3000 W Republic Road
Springfield, MO 65807
Southern Bank in Springfield
4803 South National Suite 100
Springfield, MO 65810
Southern Bank in St. Louis
5232 S. Lindbergh Blvd.
St. Louis, MO 63126
Southern Bank in St. Louis
6121 Telegraph Rd.
St Louis, MO 63129
Southern Bank in St. Louis - Dutchtown
3311 Meramec St
St. Louis, MO 63118
Southern Bank in St. Joseph
3727 Frederick
St. Joseph, MO 64506
Southern Bank in St. Joseph
5305 N Belt Hwy
St. Joseph, MO 64506
Southern Bank in Thayer
116 Chestnut Street
Thayer, MO 65791
Southern Bank in Thayer
323 E. Walnut St.
Thayer, MO 65791
Southern Bank in Trenton
816 Main Street
Trenton, MO 64683
Southern Bank in Van Buren
502 Main Street
Van Buren, MO 63965
Southern Bank in West Plains
1599 Porter Wagoner
West Plains, MO 65775
Southern Bank in West Plains
960 Preacher Roe Blvd
West Plains, MO 65775
Southern Bank in Bald Knob
306 South Elm
Bald Knob, AR 72010
Southern Bank in Batesville
1583 South St. Louis Street
Batesville, AR 72501
Southern Bank in Bradford
5227 Highway 367 North
Bradford, AR 72020
Southern Bank in Cabot
2033A West Main Street
Cabot, AR 72023
Southern Bank in Jonesboro
2775 East Nettleton
Jonesboro, AR 72401
Southern Bank in Jonesboro
1925 South Main
Jonesboro, AR 72401
Southern Bank in Paragould
1727 West Kingshighway
Paragould, AR 72451
Southern Bank in Searcy
2208 East Race Ave
Searcy, AR 72143
Southern Bank in Anna
358 South Main Street
Anna, IL 62906
Southern Bank in Cairo
800 Washington Ave
Cairo, IL 62914
Southern Bank in Tamms
145 Russell Ave.
Tamms, IL 62988
Southern Bank in Overland Park
8101 W. 135th St.
Overland Park, KS 66223
Southern Bank in Overland Park - Lending Office
6701 College Blvd
Overland Park, KS 66211
Close


Copyright © 2026 - Southern Bank. All rights reserved.
Terms of Use
Privacy Policy
Accessibility
Online Privacy Policy
Smart Marketing
NMLS# 405563

NMLS# 405563