Agreement and Plan of Merger On November 4, 2026, Shoals Technologies Group, Inc., a Delaware corporation (“Shoals”), entered into an Agreement and Plan of Merger and Reorganization (the “Merger Agreement”) by and among Shoals, Array Technologies, Inc., a Delaware corporation (“Array”), and Pensacola Merger Sub, Inc., a Delaware corporation and a direct wholly owned subsidiary of Array (“Merger Sub”), pursuant to which, subject to the terms and conditions of the Merger Agreement, Merger Sub will merge with and into Shoals (the “Merger”) with Shoals surviving the Merger as a direct wholly owned subsidiary of Array. All defined terms used in this summary of the Merger Agreement that are not otherwise defined herein have the meanings ascribed to such terms in the Merger Agreement.
|
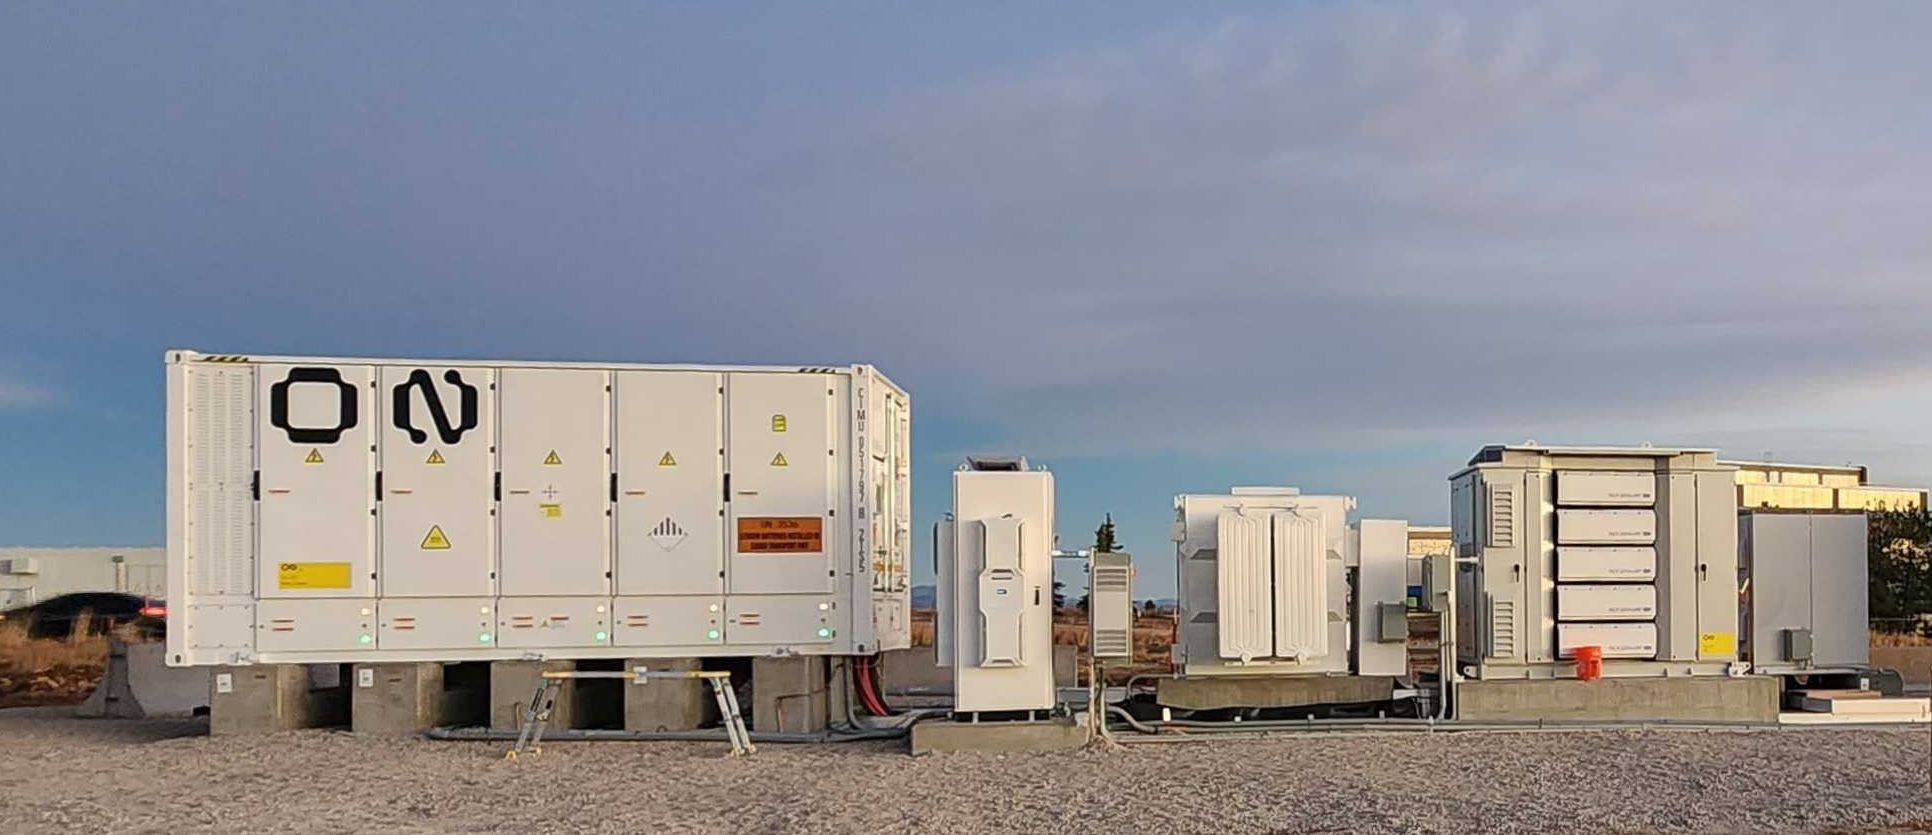
Shoals Technologies Group, Inc. is a design-engineering company and manufacturer of advanced electrical infrastructure solutions for mission-critical applications in solar photovoltaic, battery energy storage, and data center power systems. The company provides electrical balance of systems (EBOS) components and system solutions, including the Big Lead Assembly (BLA) trunk bus, homeruns, interconnection and extension solutions, combiners, recombiners, load break disconnects, and wireless performance monitoring systems. Its product portfolio also encompasses battery energy storage infrastructure, such as the Recombiner platform, prefabricated wiring systems, and disconnect switches, as well as emerging offerings for data center power distribution. Shoals serves utility-scale solar developers, commercial and industrial customers, and original equipment manufacturers in domestic and international markets. Founded in 1996 as an automotive component supplier, the company pivoted to the solar industry in 2002, initially supplying components to FirstSolar. It completed its initial public offering in January 2021. Summarised from the company's own disclosures, fiscal year ended Feb 2026 |
Industry Electrical Equipment & Parts | Homepage shoals.com |
| Sector Industrials | IR page investors.shoals.com/overview/default.aspx | |
|
Tags
solar photovoltaic, battery energy storage, data center power, electrical balance of systems, trunk bus, recombiners, load break disconnects, wire harnesses, prefabricated wiring, mission-critical infrastructure, Big Lead Assembly, BLA, Recombiner, Homeruns, Interconnection & Extensions, Combiners, Transition Boxes, Cable Management Solutions, Wireless Performance Monitoring Systems, Prefabricated Wiring Systems, Disconnect Switches, Multi-Load Break Disconnect Solutions
|
Press page — |
Metrics
| Valuation | |
|---|---|
| Market cap | $ 1.378B |
| Market cap (USD) | $ 1.378B |
| P/E | 36.43 |
| PEG | — |
| P/BV | 2.16 |
| P/S | 2.13 |
| P/OCF | -139.55 |
| P/FCF | -39.90 |
| Dividend yield | — |
| Turnover / mcap | — |
| Returns | |
|---|---|
| ROE | 5.8% |
| ROI | 4.6% |
| ROIC | 5.3% |
| Profit margin | 7.1% |
| Growth | |
|---|---|
| Revenue growing | No |
| Profits growing | No |
| Revenue up 3y | No |
| Revenue up 5y | — |
| Earnings growth 3y (net profit CAGR) | -35.9% |
| Quality | |
|---|---|
| Profitable | Yes |
| Margin expanding | No |
| Buying back stock | No |
| Diluting (TTM) | No |
| Debt/Equity | 22.8% |
| Podcast bulls (TTM) | Sign up |
| Podcast bears (TTM) | Sign up |
| Podcast sentiment (TTM) | Sign up |
| Podcast sentiment % (TTM) | Sign up |
| News sentiment (TTM) | 60 |
| Quality score | -29.4% |
| Insiders | |
|---|---|
| Buys, 1w | Sign up |
| Buys, 1m | Sign up |
| Buys, 1y | Sign up |
| Sells, 1w | Sign up |
| Sells, 1m | Sign up |
| Sells, 1y | Sign up |
Sign up to see this company's insider trades
Filed figures
Lines the statements and their notes report beside the headline figures, read from the filings' XBRL as filed (no restatement applied), with figures computed from one filing's own lines. Cash-flow lines carry their cash direction: an outflow is negative. Each period links to its filing; a figure's period, report date and tag are in its tooltip.
| Figure | Dec 2018 | Dec 2019 | Dec 2020 | Dec 2021 | Dec 2022 | Dec 2023 | Dec 2024 | Dec 2025 |
|---|---|---|---|---|---|---|---|---|
| Balance sheet detail | ||||||||
| Trade receivables (USD) | — | — | 27M | 31.5M | 50.6M | 107M | 78.2M | 129M |
| ↳ YoY growth | +16.6% | +60.6% | +111.8% | -27.0% | +64.7% | |||
| ↳ 5y CAGR | +36.7% | |||||||
| Borrowings, current (USD) | — | — | 3.5M | 2M | 2M | 2M | 0.00 | — |
| Borrowings, non-current (USD) | — | — | 355M | 245M | 237M | 179M | 142M | — |
| Lease liabilities (USD) | — | — | — | 0.00 | 4.42M | 3.26M | 2.12M | 41.9M |
| Cash and deposits (USD) | 108,000 | 7.08M | 10.1M | 5.01M | 8.77M | 22.7M | 23.5M | 7.32M |
| Intangible assets (USD) | — | — | 72M | 65.2M | 56.6M | 48.7M | 41.1M | 33.5M |
| Right-of-use assets (USD) | — | — | — | — | 4.06M | 2.87M | 1.79M | 46M |
| Net debt (borrowings + leases - cash) (USD) | — | — | 349M | 242M | 235M | 162M | 120M | — |
| Cash flow detail | ||||||||
| Operating cash flow (USD) | — | 36.2M | 54.1M | -4.08M | 39.5M | 92M | 80.4M | 17.1M |
| Purchases of property, plant and equipment (USD) | — | -1.72M | -3.24M | -4.13M | -3.15M | -10.6M | -8.39M | -33M |
| Change in receivables (cash effect) (USD) | — | -473,000 | 288,000 | 818,000 | -19.2M | -56.8M | 28.9M | -50.6M |
| Change in inventories (cash effect) (USD) | — | -694,000 | -6.48M | -17.2M | -36.9M | 15M | -5.84M | -35.1M |
| Change in payables (cash effect) (USD) | — | 4.2M | 4.25M | -3.88M | -11M | 5.17M | 5.64M | 43.3M |
| Share buybacks (cash effect) (USD) | — | — | — | — | 0.00 | 0.00 | -25.3M | 0.00 |
| Interest paid (cash effect) (USD) | — | -1.82M | -3.03M | -10.8M | -12.8M | -23.1M | -16.3M | -9.11M |
| Income taxes paid (cash effect) (USD) | — | 0.00 | 0.00 | -1.19M | -786,000 | -1.32M | -109,000 | 183,000 |
| Share-based compensation (USD) | — | 0.00 | 8.25M | 11.3M | 16.1M | 20.9M | 14.2M | 9.9M |
| Operating cash flow before change in receivables (USD) | — | 36.7M | 53.8M | -4.9M | 58.7M | 149M | 51.5M | 67.7M |
| Free cash flow (OCF - PPE - intangibles) (USD) | — | 34.5M | 50.8M | -8.21M | 36.3M | 81.4M | 72M | -16M |
| Income detail | ||||||||
| Provision for credit losses (USD) | — | — | 0.00 | 0.00 | 200,000 | 296,000 | 0.00 | 0.00 |
| Credit cost ratio (credit losses / average receivables) (%) | — | — | — | 0.0% | 0.5% | 0.4% | 0.0% | 0.0% |
| Reported | Mar 11, 2022 | Mar 11, 2022 | Feb 28, 2023 | Feb 28, 2023 | Feb 25, 2025 | Feb 25, 2025 | Feb 25, 2025 | Feb 24, 2026 |
Sign up to see institutional holdings
Sign UpPodcast Mentions
Sign up to see podcast mentions and sentiment
Sign UpMaterial events reported to the SEC on Form 8-K or 6-K, newest first. The link opens the filing itself on EDGAR. Press releases from the company's own website, newest first.
November 4, 2026
-
Combines market-leading product portfolios and proven engineering capabilities to deliver a differentiated offering that simplifies project execution, reduces installation cost and enhances long-term system performance
-
Reinforces both companies’ competitive positions in solar and creates the scale to pursue new growth opportunities in battery storage, data center infrastructure and other high-growth adjacencies
-
Transaction represents a significant value creation opportunity, with preliminary, indicative pro forma full year 2027 revenue estimated to be in the range of $2.2 billion to $2.4 billion and Adjusted EBITDA to be in the range of $410 million to $480 million for the combined company, including year-one synergies
-
Identified commercial and cost savings opportunities expected to generate more than $100 million of incremental Adjusted EBITDA synergies annually within three years following closing
-
Brandon Moss, Shoals’ Chief Executive Officer, to lead the combined company; Kevin Hostetler, ARRAY’s Chief Executive Officer, to serve as Special Advisor
-
Under the terms of the merger agreement, Shoals shareholders are expected to own approximately 65% of the combined company’s basic shares outstanding at closing (64.5% fully diluted), while ARRAY will serve as the legal acquirer
-
In connection with the transaction, ARRAY will commit to redeem $317.5 million of its Series A Perpetual Preferred Stock (the “Preferred Stock”), with $161.3 million to be redeemed within 90 days after the closing date of the merger and the remaining $156.3 million to be redeemed in three installments of not less than $52 million each in 2028, 2029 and 2030 (the “Mandatory Redemptions”)
-
Companies to host joint conference call today, November 4, at 8:00 a.m. Eastern Time to discuss the transaction
ALBUQUERQUE, N.M. and PORTLAND, Tenn., Nov. 04, 2026 (GLOBE NEWSWIRE) -- ARRAY Technologies (Nasdaq: ARRY) (“ARRAY”), a leading provider of structural balance-of-system (“SBOS”) solutions for utility-scale solar, and Shoals Technologies Group, Inc. (Nasdaq: SHLS) (“Shoals”), a leading provider of electrical balance-of-system (“EBOS”) solutions for utility-scale solar and battery energy storage, today announced that they have entered into a definitive agreement to combine in a stock-for-stock merger (the “Merger Agreement”). The transaction creates an integrated energy infrastructure platform that brings together complementary, market-leading solutions across foundations, trackers, fixed-tilt racking, electrical infrastructure, wire management and power delivery systems.
Under the terms of the Merger Agreement, ARRAY will be the legal acquirer in the transaction and will serve as the corporate parent of the combined company. Shoals’ shareholders will receive a fixed exchange ratio of 1.6931 ARRAY shares for each Shoals share they own. Immediately following the closing of the transaction, Shoals shareholders are expected to own approximately 65% of the combined company’s basic shares outstanding (64.5% on a fully diluted basis), with ARRAY shareholders expected to own the remaining approximately 35% of the combined company’s basic shares outstanding (35.5% on a fully diluted basis). Other than the Mandatory Redemptions, the transaction is not expected to require ARRAY to refinance or redeem any of its outstanding debt or preferred securities.
The combined company will serve solar and battery storage customers through a unified design package, coordinated purchasing and integrated warranty support across SBOS and EBOS solutions, while delivering increasing levels of integration over time designed to reduce installation costs, streamline project execution and lower long-term maintenance requirements.
“Today marks an important milestone for Shoals, ARRAY and the customers we serve. By bringing together two highly complementary businesses with experienced teams, we are creating an integrated platform with broader capabilities, deeper customer relationships and a stronger foundation for long-term growth. We believe the combined company will be positioned to better service customers, deliver more innovative and integrated solutions, realize meaningful synergies and pursue expansion opportunities across the solar value chain, data center markets and beyond,” said Brandon Moss, Chief Executive Officer of Shoals.
“This transaction represents a compelling opportunity to create meaningful value for customers of both ARRAY and Shoals by bringing together our complementary strengths. Although structural and electrical systems must operate seamlessly together in the field, they have historically been designed and sourced through separate channels. This combination changes that. Together, we expect to deliver a differentiated, technically integrated and interoperable platform that simplifies project execution, enhances project economics and accelerates innovation for customers,” said Kevin Hostetler, Chief Executive Officer of ARRAY.
Strategic and Financial Rationale
The combination of ARRAY and Shoals is expected to build a stronger, more diversified platform with greater scale, an enhanced global footprint, broader customer reach and significant financial and operational benefits to create enhanced shareholder value. The combined company is expected to:
- Serve customers more effectively through a unified design package, coordinated purchasing and integrated warranty support across combined offerings. The combined company intends to offer customers enhanced flexibility and packaging choice across foundations, trackers, electrical infrastructure and wire management solutions, including the solar industry’s best performing ground screw, single-axis tracker, DC wiring solution and cable management hanger.
- Enhance customer value by streamlining project execution, reducing installation costs, and lowering long-term maintenance requirements through increased product integration. SBOS and EBOS solutions are highly symbiotic across solar and battery storage projects. By bringing these complementary product categories together, the combined company expects to deliver more integrated solutions that reduce interface complexity, enhance energy yield and reliability, simplify installation and lower customers’ total cost of ownership.
- Build a stronger innovation engine. Together, ARRAY and Shoals bring decades of technical expertise and operating experience across engineering, product innovation, project design and customer delivery spanning more than 250 GW of projects. This deeper technical foundation is expected to accelerate product development, enhance interoperability and support the creation of innovative, integrated solutions across solar, energy storage and adjacent power infrastructure markets.
- Capture significant cost savings. The combined company expects to realize significant savings in overhead and other expenses. Year-one cost synergies are expected to deliver approximately $20 million of incremental, run-rate Adjusted EBITDA.
- Capitalize on cross-selling opportunities to drive incremental revenue growth. Only approximately 20% of projects served by ARRAY and Shoals in 2025 and 20261 utilized products from both companies, underscoring a significant cross-selling opportunity. The combined company intends to capture this opportunity by leveraging each company’s customer relationships, complementary product offerings and geographic strengths to accelerate broader adoption across the expanded customer base. Year-one cross-selling synergies are expected to generate approximately $15 million of incremental run-rate Adjusted EBITDA.
- Strengthen its cash generation profile. The combined company expects to benefit from Shoals’ approximately $1.6 billion of tax amortization and $237 million of Net Operating Losses2, which are anticipated to reduce taxable income and limit the cash tax obligations of the combined company for the next several years. In addition, the Mandatory Redemptions of Preferred Stock are expected to reduce cash distributions by nearly $100 million over the next five years.3
- Draw upon its larger scale and improved financial flexibility to enhance shareholder value. The combined company is expected to benefit from greater scale, a more diversified revenue base and a stronger balance sheet. These attributes are expected to enhance financial flexibility, enabling the company to invest in organic and inorganic growth opportunities and pursue disciplined expansion into new product categories over time. Pro forma for the transaction, the combined company expects net debt to Adjusted EBITDA to be 2.6x as of year-end 2026 and estimated to be less than 2x by year-end 2027.
Leadership, Governance and Name
Upon completion of the transaction, Brandon Moss, Shoals’ current Chief Executive Officer, will serve as Chief Executive Officer of the combined company. Kevin Hostetler, ARRAY’s current Chief Executive Officer, will serve as Special Advisor. Brad Forth, current Chairman of the Board of Directors of both ARRAY and Shoals, will serve as Chairman of the Board of the combined company. The combined company’s Board of Directors is expected to consist of ten directors, comprising four independent directors from each of the current Shoals and ARRAY Boards of Directors, as well as Brad Forth and Brandon Moss.
“Having had the privilege of serving as Chairman of both ARRAY and Shoals, I have seen firsthand the complementary products, talented teams and shared commitment to customers offered by both companies,” said Brad Forth, Chairman of the Board of Directors of ARRAY and Shoals. “Together, ARRAY and Shoals are well positioned to deliver enhanced value to customers, shareholders and employees. I also want to thank Kevin for his leadership and important contributions to ARRAY, as well as his valuable insights as he transitions to a Special Advisor role. I look forward to continuing to work with Brandon, who brings proven leadership, deep industry expertise and strategic vision to lead the combined company in this next phase of growth.”
The combined company intends to announce a new corporate name and ticker symbol in the coming months to reflect the expanded scope of its products, services and strategic opportunities.
ARRAY Preferred Stock and Balance Sheet
In connection with the merger, ARRAY has entered into a letter agreement with the holders of its Preferred Stock. The letter agreement provides for, among other things:
-
A commitment to pay to redeem (i) $161.3 million of Preferred Stock at a price equal to 93% of the liquidation preference, with such redemption to be completed within 90 days following the closing date of the merger (the "Initial Redemption"), and (ii) an additional $156.3 million of Preferred Stock at a price equal to 96% of the liquidation preference, with such redemption to be completed in up to three installments of not less than $52 million each to occur by each of the first, second and third anniversaries of the Initial Redemption;
-
An option to redeem the balance of the Preferred Stock in excess of the Mandatory Redemptions at a price equal to 96% of the liquidation preference, provided that such redemption occurs within 48 months of the closing date of the merger, with redemptions for any amounts remaining thereafter to be at the price contemplated by the original Preferred Stock Certificate of Designations, which is 100% of the liquidation preference; and
-
A reduction in the minimum amount of each redemption from $200 million to $50 million.
Following the completion of the Initial Redemption, the combined company expects the liquidation preference of the outstanding Preferred Stock to be approximately $348.7 million with 2027 dividends of approximately $25 million, assuming the Initial Redemption is completed by March 31, 2027.
ARRAY and Shoals believe these actions will simplify the combined company’s capital structure, increase free cash flow by reducing future preferred stock distributions, and support the long-term strategic objectives of the combined business.
Preliminary, Indicative Financial Outlook
Based on backlog, current business conditions and other factors, the combined company is estimated to generate, on a preliminary, indicative basis, pro forma full-year 2027 revenues in the range of $2.2 billion to $2.4 billion and Adjusted EBITDA in the range of $410 million to $480 million, including expected year-one synergies.4 The combined company does not expect to pay a material amount of cash taxes in 2027.
The combined company expects to deliver more than $100 million of annual Adjusted EBITDA synergies within three years following the closing, driven by corporate overhead efficiencies, selling expense optimization, procurement benefits, operational improvements and increased revenue.
Estimated pro forma balance sheet and other financial items for the combined company as of December 31, 2026 include:
| Financial Item | Estimated at December 31, 2026 |
| Basic shares outstanding (mm) | 439.5 |
| Diluted shares outstanding (mm) | 442.1 |
| Net debt ($mm) | $873.3 |
| Preferred Stock Liquidation Preference ($mm)5 | $348.7 |
Following completion of the merger, the combined company intends to maintain a disciplined approach to capital allocation, prioritizing investment in organic growth and innovation, reducing leverage and enhancing financial flexibility, and selectively pursuing strategic acquisitions that complement its capabilities and support long-term shareholder value creation.
The companies expect to provide additional financial details in the proxy materials to be filed with the Securities and Exchange Commission (“SEC”) in connection with the transaction by year-end.
Timing and Approvals
The transaction has been unanimously approved by members of the Boards of Directors of both ARRAY and Shoals who voted on the deal. Brad Forth did not participate in the Boards' consideration of or vote on the transaction.
The companies expect the transaction to close in the first quarter of 2027, subject to approval by shareholders of both ARRAY and Shoals, the receipt of requisite regulatory approvals, authorization for the combined company’s shares to be listed on Nasdaq and other customary closing conditions.
ARRAY and Shoals Third Quarter 2026 Results
In separate press releases today, ARRAY and Shoals independently reported results for the third quarter 2026. The press releases are available in the Investor Relations sections of the companies' respective websites.
Conference Call and Additional Materials
A joint conference call and webcast will be held today at 8:00 a.m. ET (7:00 a.m. CT). In connection with the transaction announcement, ARRAY and Shoals have canceled their previously scheduled quarterly earnings conference calls.
Interested investors and other parties can access the live webcast through the Investor Relations section of each company’s website at www.ir.arraytechinc.com and www.investors.shoals.com , as well as at www.PoweringForwardTogether.com , a new joint website dedicated to the merger. An archived replay of the webcast will be available shortly after the event concludes.
Advisors
Jefferies LLC is serving as exclusive financial advisor, Latham & Watkins LLP is serving as legal counsel and Joele Frank, Wilkinson Brimmer Katcher is serving as strategic communications advisor to Shoals.
JPMorgan Securities LLC is serving as financial advisor, Jones Day is serving as legal counsel and Edelman Smithfield is serving as strategic communications advisor to ARRAY. In addition, Lazard is serving as financial advisor to ARRAY’s Special Committee. Goldman Sachs & Co. LLC assisted ARRAY with certain financial arrangements in connection with the transaction.
1 Based on project-level matching of Shoals and ARRAY projects from January 2025 to September 2026 and assuming ARRAY owned APA and AWM over that period. Figures are approximate.
2 Amounts are approximate as of September 30, 2026.
3 Assumes minimum redemptions are made on the latest permitted repayment date under the agreement with the Preferred Stock investors. Management may elect to make larger or earlier redemptions, which would result in additional savings.
4 These preliminary, indicative ranges of estimated 2027 revenue and adjusted EBITDA figures are provided solely to show the potential scale of the combined company and do not represent financial projections of either Shoals or Array. These indicative ranges were developed by reference to each company’s separately prepared projections evaluated by the respective boards and management teams of Shoals and ARRAY, and are not the projections relied upon by either company's board of directors or financial advisor in evaluating the transaction. These indicative ranges may not be indicative of future performance and should not be relied upon as such. Actual combined company results may differ materially from such indicative estimates. No independent auditor or accountant has audited, examined, or performed any procedures on these indicative ranges, which were not prepared with a view toward complying with the guidelines established by the American Institute of Certified Public Accountants with respect to prospective financial information. Except as required by law, neither Shoals nor ARRAY undertakes any obligation to update these indicative ranges, even if any underlying assumptions are no longer appropriate.
5 Includes the Initial Redemption of Preferred Stock, but not any subsequent redemptions.
About ARRAY Technologies
ARRAY Technologies (NASDAQ: ARRY) is a leading global provider of solar tracking technology and fixed-tilt systems to utility-scale and distributed generation customers who construct, develop, and operate solar photovoltaic sites. With solutions engineered to withstand harsh weather conditions, ARRAY’s high-quality solar trackers, fixed-tilt systems, software platforms, foundation solutions, and field services combine to maximize energy production and deliver value to our customers for the entire lifecycle of a project. Founded and headquartered in the United States, ARRAY is rooted in manufacturing and driven by technology – relying on its domestic manufacturing, diversified global supply chain, and customer-centric approach to design, deliver, commission, train, and support solar energy deployment around the world. For more news and information on ARRAY, please visit www.arraytechinc.com .
About Shoals Technologies Group
Shoals Technologies Group is a leading manufacturer of advanced electrical infrastructure solutions for mission critical applications across utility scale solar, battery storage, and data center power systems. Since its founding in 1996, the Company has designed innovative technologies and systems solutions that allow its customers to substantially increase installation efficiency and safety while improving system performance and reliability at scale. Shoals Technologies Group is a recognized leader in the energy transition industry. For additional information, please visit: https://www.shoals.com .
Non-GAAP Financial Measures
This press release includes certain financial measures that are not presented in accordance with U.S. Generally Accepted Accounting Principles (“GAAP”), including Adjusted EBITDA, Net Debt, and Net Debt to Adjusted EBITDA. ARRAY and Shoals believe these non-GAAP financial measures provide useful information to investors regarding operating performance because they exclude certain items that management does not believe are indicative of ongoing operating results. The non-GAAP financial information is presented for supplemental informational purposes only and should not be considered a substitute for financial information presented in accordance with GAAP and may be different from similarly titled non-GAAP measures used by other companies.
Shoals defines Adjusted EBITDA as net income plus/(minus) (i) interest expense, (ii) interest income, (iii) income tax expense, (iv) depreciation expense, (v) amortization of intangibles, (vi) equity-based compensation, (vii) gain (loss) on sale of asset, (viii) wire insulation shrinkback litigation expenses, (ix) plant optimization expenses, (x) shareholder litigation expenses, (xi) litigation settlement expense, net of insurance recoveries, and (xii) transaction, integration, and restructuring costs. ARRAY defines Adjusted EBITDA as net income (loss) to common stockholders plus (i) other income, net, (ii) gain on extinguishment of debts, net, (iii) foreign currency (gain) loss, net, (iv) preferred dividends and accretion, (v) interest expense, (vi) income tax expense, (vii) depreciation expense, (viii) amortization of intangibles, (ix) amortization of developed technology and backlog, (x) equity-based compensation, (xi) change in fair value of contingent consideration, (xii) certain legal expenses, and (xiii) acquisition-related expenses. ARRAY defines Net Debt as total debt less cash and cash equivalents and Net Debt to Adjusted EBITDA as Net Debt divided by pro forma Adjusted EBITDA for the applicable period. Shoals and ARRAY define pro forma Adjusted EBITDA as the combined Adjusted EBITDA of ARRAY and Shoals for the applicable period as if the proposed transaction had been completed at the beginning of that period. Pro forma Adjusted EBITDA has not been prepared in accordance with Article 11 of Regulation S-X.
November 4, 2026
– Quarterly Revenue of $195.3 million –
– Income from Operations of $29.0 million –
– Net Income of $17.9 million –
– Adjusted EBITDA1 of $39.8 million –
– Backlog and Awarded Orders of $791.7 million –
– Provides Fourth Quarter and Raises Full-year Outlook –
PORTLAND, Tenn., Nov. 04, 2026 (GLOBE NEWSWIRE) -- Shoals Technologies Group, Inc. (“Shoals” or the “Company”) (Nasdaq: SHLS), a global leader in electrical infrastructure solutions for the energy transition market, today announced results for its third quarter ended September 30, 2026.
“We’re very pleased with our strong results in the period, as productivity improvements drove both quarterly revenue and Adjusted EBITDA above our expected range. We remain focused on making meaningful operational improvements as we finish 2026 on a strong note. The long-term health of the market remains robust and we’re well positioned to continue the momentum into 2027 and beyond,” said Brandon Moss, CEO of Shoals.
"Our strategy is working — and the results prove it. With the move into our new facility complete, our focus today is on the customer; delivering quality solutions, on time, with market-leading customer service. With an unmatched market position, world-class manufacturing, and a breakthrough innovation pipeline, we are built for what's ahead and excited about the opportunities in front of us," added Mr. Moss.
____________________________________
1Non-GAAP financial measures referenced in this release are used by management to assist investors and analysts in comparing our performance across reporting periods on a consistent basis by excluding items that we do not believe are indicative of our core operating performance. Reconciliations of non-GAAP operating measures to the most directly comparable GAAP financial measures are included in the non-GAAP reconciliation in this release. Non-GAAP measures should not be used as a substitute for the closest comparable GAAP measures.
Third Quarter 2026 Financial Results
Revenue increased 43.8%, to $195.3 million, compared to $135.8 million for the prior-year period, driven by strong underlying demand for products, the impact of market share capture initiatives, and an increase in the volume of projects in the current year.
Gross profit was $62.4 million, compared to $50.3 million in the prior-year period. Gross profit as a percentage of revenue was 31.9% compared to 37.0% in the prior-year period. Gross profit as a percentage of revenue declined year over year primarily due to operational inefficiencies associated with the ramp-up and transition into the new manufacturing facility and product mix within the quarter, along with costs incurred to address product quality matters, including rework and corrective actions, as well as incremental lease accounting amortization.
General and administrative expenses were $31.0 million, compared to $29.4 million during the same period in the prior year. The increase in general and administrative expenses was the result of a $5.4 million increase in cash and share-based incentive compensation expense due to improved financial performance in comparison to the prior year and increased headcount, which was offset by $4.1 million in decreased spending related to legal matters in the current quarter in comparison to the prior year quarter.
Income from operations was $29.0 million, compared to $18.7 million during the prior-year period.
Net income was $17.9 million compared to $11.9 million during the prior-year period. Earnings per share was $0.11 in the current period and $0.07 in the prior-year period.
Adjusted EBITDA1 was $39.8 million, compared to $32.2 million in the prior-year period.
Adjusted Net Income1 was $24.5 million compared to $21.2 million during the prior-year period. Adjusted Diluted Earnings Per Share1 was $0.14 compared to $0.13 in the prior-year period.
Backlog and Awarded Orders
The Company’s backlog and awarded orders as of September 30, 2026, were $791.7 million, representing a 9.8% increase compared to the prior-year period and a 1.2% sequential decrease from June 30, 2026. The increase in backlog and awarded orders as compared to the prior-year period reflects consistent demand for the Company’s innovative products, with growth in emerging battery energy storage markets.
Backlog represents signed purchase orders or contractual minimum purchase commitments with take-or-pay provisions and awarded orders are orders we are in the process of documenting with a contract but for which a contract has not yet been signed.
Fourth Quarter 2026 Outlook
At this time, the Company is providing an outlook for the fourth quarter. Based on current business conditions, business trends and other factors, for the quarter ending December 31, 2026, the Company expects:
- Revenue in the range of $165 million to $185 million; and
- Adjusted EBITDA1 in the range of $36 million to $40 million.
Revised Full-Year 2026 Outlook
Based on current business conditions, business trends and other factors, for the full year 2026, the Company now expects:
- Revenue in the range of $665 million to $685 million;
- Adjusted EBITDA1 in the range of $129 million to $133 million;
- Cash flow from operations in the range of $55 million to $65 million;
- Capital expenditures in the range of $20 million to $30 million; and
- Interest expense in the range of $11 million to $13 million.
A reconciliation of Adjusted EBITDA1 guidance, which is a forward-looking measure that is a non-GAAP measure, to the most closely comparable GAAP measure is not provided because we are unable to provide such reconciliation without unreasonable effort. The inability to provide a quantitative reconciliation is due to the uncertainty and inherent difficulty in predicting the occurrence, the financial impact and the periods in which the components of the applicable GAAP measures and non-GAAP adjustments may be recognized. The GAAP measure may include the impact of such items as non-cash share-based compensation, amortization of intangible assets and the tax effect of such items, in addition to other items we have historically excluded from Adjusted EBITDA and Adjusted Net Income. We expect to continue to exclude these items in future disclosures of these non-GAAP measures and may also exclude other similar items that may arise in the future.
Webcast and Conference Call Information
In a separate press release issued today, the Company announced it had entered into an Agreement and Plan of Merger and Reorganization with ARRAY Technologies, Inc. Additional information is available in the transaction press release. In light of the transaction announcement, the Company’s previously scheduled third quarter 2026 earnings call will instead be conducted as a joint analyst call with ARRAY Technologies, Inc. on November 4, 2026 at 8:00 a.m. EDT.
Interested investors and other parties can view materials related to the Company’s quarterly earnings results on the Investor Relations section of the Company’s website at https://investors.shoals.com .
About Shoals Technologies Group, Inc.
Shoals Technologies Group is a leading manufacturer of advanced electrical infrastructure solutions for mission-critical applications across utility-scale solar, battery storage, and data center power systems. Since its founding in 1996, the Company has designed innovative technologies and systems solutions that allow its customers to substantially increase installation efficiency and safety while improving system performance and reliability at scale. Shoals Technologies Group is a recognized leader in the energy transition industry. For additional information, please visit: https://www.shoals.com
.
Investor Relations Contact
Shoals Technologies Group, Inc.
Email: [email protected]
Forward-Looking Statements
This report contains forward-looking statements that are based on our management’s beliefs and assumptions and on information currently available to our management. Forward-looking statements include information concerning our possible or assumed future results of operations; expectations regarding the utility-scale solar market; project delays; regulatory environment, including changes or potential changes to such environment; the effects of strategic pricing actions, volume discounts and customer mix in our key markets; pipeline and orders; business strategies, plans and expectations, including sales and marketing goals; technology developments; financing and investment plans; warranty and liability accruals and estimates of loss or gains; estimates of potential loss related to the wire insulation shrinkback matter discussed in our public filings; litigation strategy and expected benefits or results from the current intellectual property and wire insulation shrinkback litigation; potential growth opportunities, including opportunities associated with our entry into new markets; and production and capacity at our plants. Forward-looking statements include statements that are not historical facts and can be identified by terms such as “anticipate,” “believe,” “could,” “estimate,” “expect,” “intend,” “may,” “plan,” “potential,” “predict,” “project,” “seek,” “should,” “will,” “would” or similar expressions and the negatives of those terms.
Forward-looking statements involve known and unknown risks, uncertainties and other factors that may cause our actual results, performance or achievements to be materially different from any future results, performance or achievements expressed or implied by the forward-looking statements.
Some of the key factors and scenarios that could cause actual results to differ from our expectations include, among others, the completion of our proposed transaction with Array Technologies, Inc. on the anticipated terms and timing, including obtaining stockholder and regulatory approvals, the anticipated tax treatment, redemption of Array’s preferred stock, unforeseen liabilities, future capital expenditures, revenues, expenses, earnings, synergies, economic performance, indebtedness, financial condition, losses, future prospects, business and management strategies, expansion and growth of Array’s and our businesses and the satisfaction of other conditions to the completion of the proposed Array transaction; the risk that a condition to closing may not be satisfied, that an event, change or other circumstance could give rise to the termination of the proposed Array transaction, or that the proposed Array transaction may not be completed on the expected timeline or at all; failure to realize the anticipated benefits of the proposed Array transaction, including because of a delay in completing the transaction or because our businesses are not integrated successfully on the anticipated timeline, or at all, or integration is more costly or difficult than expected; potential litigation relating to the proposed Array transaction that could be instituted against us, Array, or our respective directors and officers; the risk that disruptions from the proposed Array transaction will harm our or Shoals’ businesses, including our current plans and operations, or divert management’s attention from ongoing business operations and opportunities; our ability to retain and hire key personnel; potential adverse reactions or changes to business, employee, customer or supplier relationships resulting from the announcement, pendency or completion of the proposed Array transaction; the risk that the announcement, pendency or completion of the proposed Array transaction could adversely affect the market price or long-term value of our common stock; if demand for solar energy projects diminishes, we may not be able to grow, and our financial results, business and prospects could be materially adversely impacted; if we fail to accurately estimate the potential losses related to the wire insulation shrinkback matter, or fail to recover the costs and expenses incurred by us from the supplier, and our profit margins, financial results, business and prospects could be materially adversely impacted; the interruption of the flow of raw materials from international vendors has disrupted our supply chain, including as a result of the imposition of additional duties, tariffs, and other charges on imports and exports; the imposition of trade restrictions, import tariffs, anti-dumping, and countervailing duties; we have modified, and in the future may modify, our business strategy to abandon lines of business or implement new lines of business, and modifying our business strategy could have an adverse effect on our business and financial results; amounts included in our backlog and awarded orders may not result in actual revenue or translate into profits; defects or performance problems in our products or their parts, whether due to manufacturing, installation, or use, including those related to the wire insulation shrinkback matter, have a high consequence of failure and can lead to equipment and systems failure, physical injury or death, and in the past have, and in the future could, result in loss of customers, reputational damage and decreased revenue, and materially adversely impact our business, financial condition and results of operations; we have experienced, and may experience in the future, delays, disruptions, quality control, or reputational problems in our manufacturing operations in part due to our vendor concentration; if we fail to retain our key personnel and attract additional qualified personnel, our business strategy and prospects could suffer; our products are primarily manufactured and shipped from our production facilities in Tennessee, and any damage or disruption at these facilities may harm our business; we may face difficulties integrating and optimizing our consolidated Tennessee-based manufacturing and distribution operations, and may not fully realize the anticipated benefits thereof; safety issues may subject us to penalties, negatively impact customer relationships, result in higher operating costs, and negatively impact employee morale and turnover; the market for our products is competitive, and we face increased competition as new and existing competitors introduce EBOS system solutions and components, which could negatively affect our results of operations and market share; macroeconomic conditions, including high inflation, high interest rates, and geopolitical instability, impact our business and financial results; we are subject to risks associated with the patent infringement complaints that we filed with the U.S. International Trade Commission and District Courts; if we fail to, or incur significant costs in order to obtain, maintain, protect, defend, or enforce our intellectual property portfolio and other proprietary rights, including the patents we are asserting in ongoing patent infringement litigation; acquisitions, joint ventures, and/or investments and the failure to integrate acquired businesses could disrupt our business and negatively impact revenue, results of operations and cash flow; a loss of one or more of our significant customers, their inability to perform under their contracts, or their default in payment could harm our business, financial condition, results of operations and prospects; a significant drop in the price of electricity may harm our business; the unauthorized access to our information technology systems or the disclosure of personal or sensitive data or confidential information, whether through a breach of our computer system or otherwise, could severely disrupt our business; failure of our information technology systems, including those managed by third parties, whether intentional or inadvertent, could lead to delays in our business operations and, if significant or extreme, affect our results of operations; our expansion outside the U.S. could subject us to additional business, financial, regulatory, and competitive risks; our indebtedness could adversely affect our financial flexibility, restrict our current and future operations, and our competitive position; existing electric utility industry, federal, state, and municipal renewable energy and solar energy policies and regulations, including zoning and siting laws, and any subsequent changes, present technical, regulatory, and economic barriers to the purchase and use of solar energy systems that may significantly reduce demand for our products or harm our ability to compete; changes in tax laws or regulations that are applied adversely to us, or our customers could materially adversely affect our business, financial condition, results of operations, and prospects; and the market price of our Class A common stock may decline and may continue to be subject to significant volatility.
These and other important risk factors are described more fully in the Company’s most recent Annual Report on Form 10-K and subsequent Quarterly Reports on Form 10-Q and other documents filed with the Securities and Exchange Commission and could cause actual results to vary from expectations. Given these uncertainties, you should not place undue reliance on forward-looking statements. Also, forward-looking statements represent our management’s beliefs and assumptions only as of the date of this report. You should read this report with the understanding that our actual future results may be materially different from what we expect.
Except as required by law, we assume no obligation to update these forward-looking statements, or to update the reasons actual results could differ materially from those anticipated in these forward-looking statements, even if new information becomes available in the future.
Non-GAAP Financial Measures
Adjusted Gross Profit, Adjusted Gross Profit Percentage, Adjusted EBITDA, Adjusted Net Income, and Adjusted Diluted Earnings per Share (“EPS”)
We define Adjusted Gross Profit as gross profit plus plant optimization expenses. We define Adjusted Gross Profit Percentage as Adjusted Gross Profit divided by revenue. We define Adjusted EBITDA as net income plus/(minus) (i) interest expense, (ii) interest income, (iii) income tax expense, (iv) depreciation expense, (v) amortization of intangibles, (vi) equity-based compensation, (vii) gain (loss) on sale of asset (viii) wire insulation shrinkback litigation expenses, (ix) plant optimization expenses, (x) shareholder litigation expenses, (xi) litigation settlement expense, net of insurance recoveries, and (xii) transaction, integration, and restructuring costs. We define Adjusted Net Income as net income plus (i) amortization of intangibles, (ii) amortization / write-off of deferred financing costs, (iii) equity-based compensation, (iv) gain (loss) on sale of asset (v) wire insulation shrinkback litigation expenses, (vi) plant optimization expenses, (vii) shareholder litigation expenses, (viii) litigation settlement expenses, net of insurance recoveries, and (ix) transaction, integration, and restructuring costs, all net of applicable income taxes. We define Adjusted Diluted EPS as Adjusted Net Income divided by the diluted weighted average shares of Class A common stock outstanding for the applicable period.
Beginning with the three months ended March 31, 2026, we revised our definition of Adjusted EBITDA to exclude shareholder litigation costs, which are reflected in General and Administrative expenses on our consolidated statements of operations. Comparative amounts for prior periods have been recast to conform to the current period presentation. Management believes this revised definition provides a more meaningful representation of the Company’s ongoing operating performance as the costs are not reflective of our core operations.
Adjusted Gross Profit, Adjusted Gross Profit Percentage, Adjusted EBITDA, Adjusted Net Income, and Adjusted Diluted EPS are intended as supplemental measures of performance that are neither required by, nor presented in accordance with, GAAP. We present Adjusted Gross Profit, Adjusted Gross Profit Percentage, Adjusted EBITDA, Adjusted Net Income, and Adjusted Diluted EPS because we believe they assist investors and analysts in comparing our performance across reporting periods on a consistent basis by excluding items that we do not believe are indicative of our core operating performance. In addition, we use Adjusted Gross Profit, Adjusted Gross Profit Percentage, Adjusted EBITDA, Adjusted Net Income, and Adjusted Diluted EPS: (i) as factors in evaluating management’s performance when determining incentive compensation, as applicable; (ii) to evaluate the effectiveness of our business strategies; and (iii) because our credit agreement uses measures similar to Adjusted EBITDA, Adjusted Net Income and Adjusted Diluted EPS to measure our compliance with certain covenants.
Among other limitations, Adjusted Gross Profit, Adjusted Gross Profit Percentage, Adjusted EBITDA, Adjusted Net Income, and Adjusted Diluted EPS do not reflect our cash expenditures, or future requirements for capital expenditures or contractual commitments; do not reflect the impact of certain cash charges resulting from matters we consider not to be indicative of our ongoing operations; and may be calculated by other companies in our industry differently than we do or not at all, which may limit their usefulness as comparative measures.
Because of these limitations, Adjusted Gross Profit, Adjusted Gross Profit Percentage, Adjusted EBITDA, Adjusted Net Income, and Adjusted Diluted EPS should not be considered in isolation or as substitutes for performance measures calculated in accordance with GAAP. You should review the reconciliation of gross profit to Adjusted Gross Profit and Adjusted Gross Profit Percentage, net income to Adjusted EBITDA, and net income to Adjusted Net Income and Adjusted Diluted EPS below and not rely on any single financial measure to evaluate our business.
| Shoals Technologies Group, Inc. Condensed Consolidated Balance Sheets (Unaudited) (in thousands, except shares and par value) | |||||||
| **September 30, **2026 | December 31, 2025 | ||||||
| Assets | |||||||
| Current Assets | |||||||
| Cash and cash equivalents | $ | 7,674 | $ | 7,320 | |||
| Accounts receivable, net | 159,822 | 128,793 | |||||
| Unbilled receivables | 12,617 | 22,133 | |||||
| Inventory | 148,348 | 89,878 | |||||
| Insurance receivable | 499 | — | |||||
| Other current assets | 12,174 | 9,762 | |||||
| Total Current Assets | 341,134 | 257,886 | |||||
| Property, plant and equipment, net | 62,686 | 53,302 | |||||
| Goodwill | 69,941 | 69,941 | |||||
| Other intangible assets, net | 27,810 | 33,499 | |||||
| Deferred tax assets | 428,540 | 438,027 | |||||
| Right-of-use operating lease assets | 42,881 | 46,044 | |||||
| Other assets | 5,704 | 5,402 | |||||
| Total Assets | $ | 978,696 | $ | 904,101 | |||
| Liabilities and Stockholders’ Equity | |||||||
| Current Liabilities | |||||||
| Accounts payable | $ | 27,400 | $ | 64,875 | |||
| Accrued expenses and other | 44,143 | 22,215 | |||||
| Litigation settlement liability | 5,999 | — | |||||
| Warranty liability—current portion | 5,281 | 3,202 | |||||
| Deferred revenue | 56,216 | 37,031 | |||||
| Total Current Liabilities | 139,039 | 127,323 | |||||
| Revolving line of credit | 163,750 | 136,750 | |||||
| Right-of-use operating lease liabilities | 36,391 | 38,661 | |||||
| Warranty liability, less current portion | 403 | 403 | |||||
| Other long-term liabilities | 991 | 991 | |||||
| Total Liabilities | 340,574 | 304,128 | |||||
| Commitments and Contingencies | |||||||
| Stockholders’ Equity | |||||||
| Preferred stock, $0.00001 par value - 5,000,000 shares authorized; none issued and outstanding as of September 30, 2026 and December 31, 2025 | — | — | |||||
| Class A common stock, $0.00001 par value - 1,000,000,000 shares authorized; 172,380,287 and 171,358,711 shares issued; 168,471,900 and 167,450,324 outstanding as of September 30, 2026 and December 31, 2025, respectively | 2 | 2 | |||||
| Additional paid-in capital | 501,528 | 493,090 | |||||
| Treasury stock, at cost, 3,908,387 shares as of September 30, 2026 and December 31, 2025 | (25,272 | ) | (25,272 | ) | |||
| Retained earnings | 161,864 | 132,153 | |||||
| Total Stockholders' Equity | 638,122 | 599,973 | |||||
| Total Liabilities and Stockholders’ Equity | $ | 978,696 | $ | 904,101 |
| Shoals Technologies Group, Inc. Condensed Consolidated Statements of Operations (Unaudited) (in thousands, except per share amounts) | |||||||||||||||
| Three Months Ended September 30, | Nine Months Ended September 30, | ||||||||||||||
| 2026 | 2025 | 2026 | 2025 | ||||||||||||
| Revenue | $ | 195,308 | $ | 135,804 | $ | 499,237 | $ | 327,006 | |||||||
| Cost of revenue | 132,912 | 85,552 | 346,306 | 207,412 | |||||||||||
| Gross profit | 62,396 | 50,252 | 152,931 | 119,594 | |||||||||||
| Operating expenses | |||||||||||||||
| General and administrative expenses | 31,003 | 29,423 | 90,482 | 74,180 | |||||||||||
| Depreciation and amortization | 2,427 | 2,158 | 7,043 | 6,433 | |||||||||||
| Total operating expenses | 33,430 | 31,581 | 97,525 | 80,613 | |||||||||||
| Income from operations | 28,966 | 18,671 | 55,406 | 38,981 | |||||||||||
| Interest expense | (3,894 | ) | (2,832 | ) | (10,271 | ) | (7,483 | ) | |||||||
| Interest income | — | 38 | 327 | 232 | |||||||||||
| Litigation settlement expense, net of recoveries | (1,000 | ) | — | (6,250 | ) | — | |||||||||
| Gain (loss) on sale of assets | (2 | ) | (7 | ) | (4 | ) | 3,127 | ||||||||
| Foreign currency gain (loss) | 18 | — | (10 | ) | — | ||||||||||
| Income before income taxes | 24,088 | 15,870 | 39,198 | 34,857 | |||||||||||
| Income tax expense | (6,218 | ) | (3,991 | ) | (9,487 | ) | (9,405 | ) | |||||||
| Net income | $ | 17,870 | $ | 11,879 | $ | 29,711 | $ | 25,452 | |||||||
| Earnings per share of Class A common stock: | |||||||||||||||
| Basic | $ | 0.11 | $ | 0.07 | $ | 0.18 | $ | 0.15 | |||||||
| Diluted | $ | 0.11 | $ | 0.07 | $ | 0.17 | $ | 0.15 | |||||||
| Weighted average shares of Class A common stock outstanding: | |||||||||||||||
| Basic | 168,377 | 167,369 | 168,000 | 167,206 | |||||||||||
| Diluted | 170,133 | 168,750 | 170,058 | 167,725 |
| Shoals Technologies Group, Inc. Condensed Consolidated Statements of Cash Flows (Unaudited) (in thousands) | |||||||
| Nine Months Ended September 30, | |||||||
| 2026 | 2025 | ||||||
| Cash Flows from Operating Activities | |||||||
| Net income | $ | 29,711 | $ | 25,452 | |||
| Adjustments to reconcile net income to net cash provided by operating activities: | |||||||
| Depreciation and amortization | 13,802 | 9,984 | |||||
| Amortization/write off of deferred financing costs | 699 | 467 | |||||
| Equity-based compensation | 11,795 | 7,674 | |||||
| Provision for obsolete or slow-moving inventory | 3,030 | 1,090 | |||||
| Provision for warranty expense | 8,947 | 256 | |||||
| Deferred taxes | 9,487 | 10,574 | |||||
| Other | 5,295 | (3,127 | ) | ||||
| Changes in assets and liabilities: | |||||||
| Accounts receivable | (31,029 | ) | (39,283 | ) | |||
| Unbilled receivables | 9,516 | 13,129 | |||||
| Inventory | (61,500 | ) | (5,463 | ) | |||
| Other assets | (3,413 | ) | 2,465 | ||||
| Accounts payable | (37,475 | ) | 12,566 | ||||
| Accrued expenses and other | 17,530 | 11,661 | |||||
| Warranty liability | (6,868 | ) | (33,653 | ) | |||
| Litigation receivable and settlement liabilities | 5,500 | — | |||||
| Deferred revenue | 19,185 | 7,362 | |||||
| Net Cash Provided by (Used in) Operating Activities | (5,788 | ) | 21,154 | ||||
| Cash Flows from Investing Activities | |||||||
| Purchases of property, plant and equipment | (17,501 | ) | (25,879 | ) | |||
| Proceeds from sale of property, plant and equipment | — | 5,088 | |||||
| Net Cash Used in Investing Activities | (17,501 | ) | (20,791 | ) | |||
| Cash Flows from Financing Activities | |||||||
| Employee withholding taxes related to net settled equity awards | (3,357 | ) | (344 | ) | |||
| Proceeds from revolving credit facility | 60,000 | 50,000 | |||||
| Repayments of revolving credit facility | (33,000 | ) | (65,000 | ) | |||
| Excise taxes on treasury stock transactions | — | 59 | |||||
| Net Cash Provided by (Used in) Financing Activities | 23,643 | (15,285 | ) | ||||
| Net Increase (Decrease) in Cash and Cash Equivalents | 354 | (14,922 | ) | ||||
| Cash and Cash Equivalents—Beginning of Period | 7,320 | 23,511 | |||||
| Cash and Cash Equivalents—End of Period | $ | 7,674 | $ | 8,589 |
Shoals Technologies Group, Inc.
**Adjusted Gross Profit, Adjusted Gross Profit Percentage, Adjusted EBITDA, Adjusted Net Income and
Adjusted Diluted Earnings per Share (“EPS”) (Unaudited)
**
Reconciliation of Gross Profit to Adjusted Gross Profit and Adjusted Gross Profit Percentage (in thousands):
| Three Months Ended September 30, | Nine Months Ended September 30, | ||||||||||||||
| 2026 | 2025 | 2026 | 2025 | ||||||||||||
| Revenue | $ | 195,308 | $ | 135,804 | $ | 499,237 | $ | 327,006 | |||||||
| Cost of revenue | 132,912 | 85,552 | 346,306 | 207,412 | |||||||||||
| Gross profit | $ | 62,396 | $ | 50,252 | $ | 152,931 | $ | 119,594 | |||||||
| Gross profit percentage | 31.9 | % | 37.0 | % | 30.6 | % | 36.6 | % | |||||||
| Plant optimization expense(b) | $ | 115 | $ | — | $ | 1,232 | $ | — | |||||||
| Adjusted gross profit | $ | 62,511 | $ | 50,252 | $ | 154,163 | $ | 119,594 | |||||||
| Adjusted gross profit percentage | 32.0 | % | 37.0 | % | 30.9 | % | 36.6 | % |
Reconciliation of Net Income to Adjusted EBITDA (in thousands):
| Three Months Ended September 30, | Nine Months Ended September 30, | |||||||||||||
| 2026 | 2025 | 2026 | 2025 | |||||||||||
| Net income | $ | 17,870 | $ | 11,879 | $ | 29,711 | $ | 25,452 | ||||||
| Interest expense | 3,894 | 2,832 | 10,271 | 7,483 | ||||||||||
| Interest income | — | (38 | ) | (327 | ) | (232 | ) | |||||||
| Income tax expense | 6,218 | 3,991 | 9,487 | 9,405 | ||||||||||
| Depreciation expense | 3,174 | 1,466 | 8,113 | 4,296 | ||||||||||
| Amortization of intangibles | 1,910 | 1,909 | 5,703 | 5,710 | ||||||||||
| Equity-based compensation | 4,096 | 2,421 | 11,794 | 7,675 | ||||||||||
| (Gain) loss on sale of asset | 2 | 7 | 4 | (3,127 | ) | |||||||||
| Wire insulation shrinkback litigation expenses(a) | 711 | 6,831 | 7,294 | 11,906 | ||||||||||
| Plant optimization expenses(b) | 115 | 676 | 1,232 | 676 | ||||||||||
| Shareholder litigation expenses(c) | 144 | 261 | 2,264 | 1,174 | ||||||||||
| Litigation settlement expense(c) | 1,000 | — | 6,250 | — | ||||||||||
| Transaction, integration and restructuring costs(d) | 671 | — | 671 | — | ||||||||||
| Adjusted EBITDA | $ | 39,805 | $ | 32,235 | $ | 92,467 | $ | 70,418 |
Reconciliation of Net Income to Adjusted Net Income (in thousands):
| Three Months Ended September 30, | Nine Months Ended September 30, | ||||||||||||||
| 2026 | 2025 | 2026 | 2025 | ||||||||||||
| Net income | $ | 17,870 | $ | 11,879 | $ | 29,711 | $ | 25,452 | |||||||
| Amortization of intangibles | 1,910 | 1,909 | 5,703 | 5,710 | |||||||||||
| Amortization / write-off of deferred financing costs | 387 | 156 | 699 | 467 | |||||||||||
| Equity-based compensation | 4,096 | 2,421 | 11,794 | 7,675 | |||||||||||
| (Gain) loss on sale of asset | 2 | 7 | 4 | (3,127 | ) | ||||||||||
| Wire insulation shrinkback litigation expenses(a) | 711 | 6,831 | 7,294 | 11,906 | |||||||||||
| Plant optimization expenses(b) | 115 | 676 | 1,232 | 676 | |||||||||||
| Shareholder litigation expenses(c) | 144 | 261 | 2,264 | 1,174 | |||||||||||
| Litigation settlement expense(c) | 1,000 | — | 6,250 | — | |||||||||||
| Transaction, integration and restructuring costs(d) | 671 | — | 671 | — | |||||||||||
| Tax impact of adjustments(e) | (2,413 | ) | (2,943 | ) | (9,588 | ) | (5,875 | ) | |||||||
| Adjusted Net Income | $ | 24,493 | $ | 21,197 | $ | 56,034 | $ | 44,058 | |||||||
(a) For the three and nine months ended September 30, 2026, represents $0.7 million and $7.3 million, respectively, of expenses incurred in connection with the lawsuit initiated by the Company against the supplier of the defective wire. For the three and nine months ended September 30, 2025, represents $6.8 million and $11.9 million, respectively, of expenses incurred in connection with the lawsuit initiated by the Company against the supplier of the defective wire. We consider this litigation distinct from ordinary course legal matters given the expected magnitude of the expenses, the nature of the allegations in the Company’s complaint, the amount of damages sought, and the impact of the matter underlying the litigation on the Company’s financial results. In the future, we also intend to exclude from our non-GAAP measures the benefit of recovery, if any. We believe excluding expenses from these discrete litigation events provides investors with a better view of the operating performance of our business and allows for comparability through periods.
(b) For the three and nine months ended September 30, 2026, represents $0.1 million and $1.2 million of expenses incurred in connection with actions taken to consolidate our operations into a newly constructed facility, including items such as professional fees, relocation, facility set-up and other costs, which relates to costs classified within cost of revenue based on their nature and function. For the three and nine months ended September 30, 2025, represents $0.7 million of expenses incurred in connection with actions taken to consolidate our operations into a newly constructed facility, which primarily consisted of costs classified within general and administrative expenses based on their nature and function. We believe excluding expenses from these events provides investors with a better view of the operating performance of our business and allows for comparability through periods.
(c) For the three and nine months ended September 30, 2026, represents $0.1 million and $2.3 million, respectively, of expenses incurred in connection with the Company’s defense of certain derivative and class action litigation and for the three and nine months ended September 30, 2026, represents $1.0 million and $6.3 million, respectively, in settlement expenses associated with this litigation. For the three and nine months ended September 30, 2025, represents $0.3 million and $1.2 million, respectively, of expenses incurred in connection with the Company’s defense of certain derivative and class action litigation. We consider expenses incurred in connection with these legal matters distinct from normal matters and expenses within the operation of our business.
(d) Represents costs incurred in connection with the recently announced proposed transaction with ARRAY Technologies, Inc., primarily consisting of legal, investment banking, accounting, consulting and other professional and advisory fees. We believe these costs are not reflective of our core operations and that excluding them provides a more meaningful view of our ongoing operating performance.
(e) Shoals Technologies Group, Inc. is subject to U.S. Federal income taxes, in addition to state and local taxes. Represents the estimated tax impact of all Adjusted Net Income add-backs, excluding those which represent permanent differences between book versus tax. The adjustment to the provision for income tax reflects the effective tax rates below.
| Three Months Ended September 30, | Nine Months Ended September 30, | ||||||||||
| 2026 | 2025 | 2026 | 2025 | ||||||||
| Statutory U.S. Federal income tax rate | 21.0 | % | 21.0 | % | 21.0 | % | 21.0 | % | |||
| Permanent adjustments | 3.1 | % | 0.6 | % | 3.1 | % | 0.6 | % | |||
| State and local taxes (net of federal benefit) | 2.6 | % | 2.4 | % | 2.6 | % | 2.4 | % | |||
| Effective income tax rate for Adjusted Net Income | 26.7 | % | 24.0 | % | 26.7 | % | 24.0 | % |
Calculation of Adjusted Diluted Earnings per Share (in thousands, except per share amounts):
| Three Months Ended September 30, | Nine Months Ended September 30, | ||||||||||
| 2026 | 2025 | 2026 | 2025 | ||||||||
| Diluted weighted average shares outstanding | 170,133 | 168,750 | 170,058 | 167,725 | |||||||
| Adjusted Net Income | $ | 24,493 | $ | 21,197 | $ | 56,034 | $ | 44,058 | |||
| Adjusted Diluted EPS | $ | 0.14 | $ | 0.13 | $ | 0.33 | $ | 0.26 |

Source: Shoals Technologies Group
Prompts
Click prompts to add them under the company line, click again to take one out, then copy the result into your AI chat. Shared by Asian Century Stocks and Uncovered Thai Stocks. Thank you.
ETFs Holding Shoals Technologies Group, Inc.
Exchange-traded funds whose newest published daily portfolio holds one of the company's listings, largest weight first.
| ETF | Weight in ETF | Shares | Market value | As of |
|---|---|---|---|---|
| AIPO | 0.51% | 494,431 | $ 3.99M | Nov 13, 2026 |
| LOPP | 0.47% | 7,776 | $ 76.982K | Jun 30, 2026 |
| CCNR | 0.33% | 160,915 | $ 1.406M | Jul 31, 2026 |
| TMSL | 0.33% | 890,611 | $ 8.817M | Jun 30, 2026 |
| SCDS | 0.19% | 2,476 | $ 17.431K | Nov 17, 2026 |
| PSC | 0.18% | 431,335 | $ 4.27M | Jun 30, 2026 |
| ESSC | 0.17% | 7,140 | $ 62.404K | Jul 31, 2026 |
| CCSO | 0.16% | 8,153 | $ 65.387K | Nov 17, 2026 |
| AVSC | 0.09% | 339,647 | $ 2.724M | Nov 16, 2026 |
| FSML | 0.08% | 10,637 | $ 105.306K | Jun 30, 2026 |
| IVSS | 0.04% | 1,213 | $ 12.009K | Jun 30, 2026 |
| DFAT | 0.04% | 1,631,442 | $ 13.166M | Nov 12, 2026 |
| FTLS short | -0.04% | -123,868 | $ 0.00 | Nov 16, 2026 |
| DFSV | 0.04% | 1,283,765 | $ 10.36M | Nov 12, 2026 |
| DFAS | 0.02% | 1,036,372 | $ 8.364M | Nov 12, 2026 |
| JSTC | 0.02% | 6,048 | $ 48.505K | Nov 17, 2026 |
| AVSU | 0.01% | 4,450 | $ 35.689K | Nov 16, 2026 |
| DFSU | 0.01% | 22,319 | $ 180.114K | Nov 12, 2026 |
| DFAC | 0.01% | 656,989 | $ 5.302M | Nov 12, 2026 |
| DXUV | 0.01% | 42,774 | $ 345.186K | Nov 12, 2026 |
| DFUV | 0.00% | 87,154 | $ 703.333K | Nov 12, 2026 |
| DCOR | 0.00% | 181,834 | $ 1.467M | Nov 12, 2026 |
| DFAU | 0.00% | 43,722 | $ 352.837K | Nov 12, 2026 |
| DFUS | 0.00% | 51,745 | $ 417.582K | Nov 12, 2026 |
| EBI | 0.00% | 157 | $ 1,086.44 | Aug 31, 2026 |
| FESM | 0.00% | 276 | $ 2,732.40 | Jun 30, 2026 |
| VFMO | 0.00% | 46 | $ 318.32 | Aug 31, 2026 |
| AVUS | 0.00% | 67,732 | $ 543.211K | Nov 16, 2026 |