Home Press Room Press Release Smithfield Foods Reports Third Quarter Results FinancialOCT 27TH, 2026 Packaged Meats Delivers Higher Q3 Operating Profit YoY; on Track for Fifth Consecutive Year Above $1 Billion in Operating Profit Company Completes…
Home
Press Room
Press Release
Smithfield Foods Reports Third Quarter Results

FinancialOCT 27TH, 2026
-
Packaged Meats Delivers Higher Q3 Operating Profit YoY; on Track for Fifth Consecutive Year Above $1 Billion in Operating Profit
-
Company Completes Nathan’s Famous Acquisition, Bolstering its Packaged Meats Brand Portfolio
-
Company Updates FY 2026 Outlook to Reflect Strong Packaged Meats Performance and Softer Commodity Markets
-
Strong Balance Sheet and Improved Cash Generation Support Continued Investment and Capital Allocation Priorities
SMITHFIELD, Va., October 27, 2026 -- Smithfield Foods, Inc. (Nasdaq: SFD), an American food company and an industry leader in value-added packaged meats and fresh pork, today reported results for its fiscal 2026 third quarter ended September 27, 2026.
Third Quarter Fiscal 2026 Financial Highlights
-
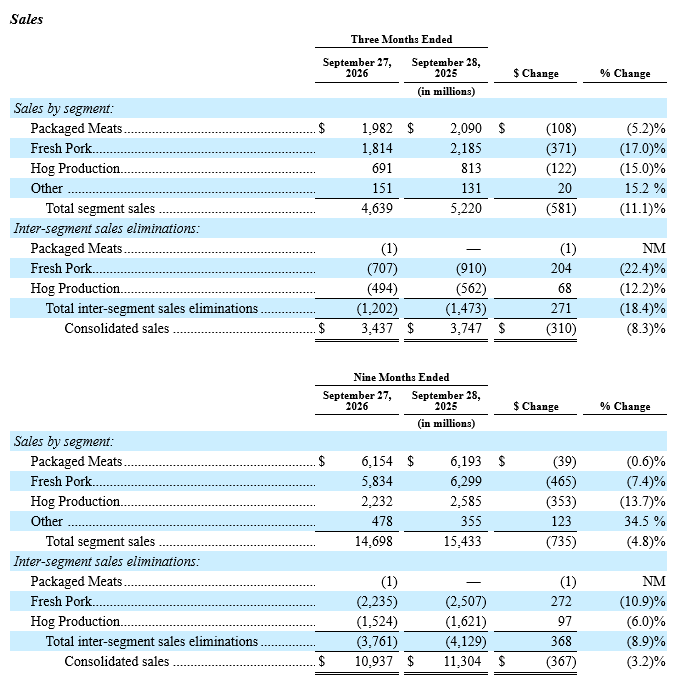
Sales of $3.4 billion, down 8.3% from the third quarter of fiscal 2025
-
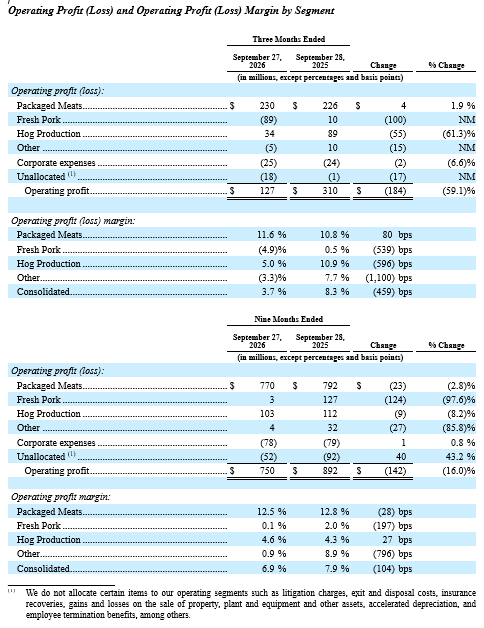
Operating profit of $127 million, compared to $310 million in the third quarter of fiscal 2025; adjusted operating profit(1) of $145 million, compared to $310 million in the third quarter of fiscal 2025
-
Operating profit margin of 3.7%, compared to 8.3% in the third quarter of fiscal 2025; adjusted operating profit margin(1) of 4.2%, compared to 8.3% in the third quarter of fiscal 2025
-
Packaged Meats operating profit of $230 million, compared to $226 million in the third quarter of fiscal 2025
-
Packaged Meats operating profit margin of 11.6%, compared to 10.8% in the third quarter of fiscal 2025
-
Diluted earnings per share of $0.23, compared to $0.63 in the third quarter of fiscal 2025; adjusted diluted earnings per share(1) of $0.26, compared to $0.58 in the third quarter of fiscal 2025
First Nine Months Fiscal 2026 Financial Highlights
-
Sales of $10.9 billion, down 3.2% from the first nine months of fiscal 2025
-
Operating profit of $750 million, compared to $892 million for the first nine months of fiscal 2025; adjusted operating profit(1) of $783 million, compared to $934 million for the first nine months of fiscal 2025
-
Operating profit margin of 6.9%, compared to 7.9% for the first nine months of fiscal 2025; adjusted operating profit margin(1) of 7.2%, compared to 8.3% for the first nine months of fiscal 2025
-
Packaged Meats operating profit of $770 million, compared to $792 million for the first nine months of fiscal 2025; Packaged Meats adjusted operating profit(1) of $770 million, compared to $787 million for the first nine months of fiscal 2025
-
Packaged Meats operating profit margin of 12.5%, compared to 12.8% for the first nine months of fiscal 2025; Packaged Meats adjusted operating profit margin(1) of 12.5%, compared to 12.7% for the first nine months of fiscal 2025
-
Diluted earnings per share of $1.45, compared to $1.68 for the first nine months of fiscal 2025; adjusted diluted earnings per share(1) of $1.52, compared to $1.72 for the first nine months of fiscal 2025
-
Net cash flows from operating activities of $365 million, up $244 million from the first nine months of fiscal 2025
(1) A non-GAAP measure. Please see the table in the Non-GAAP Financial Measures section for a reconciliation to the most comparable GAAP measure.
CEO Perspective“We reported third quarter adjusted operating profit within the range we provided in September, led by strong results in our cornerstone Packaged Meats segment, with our upstream segments challenged by lower pork commodity markets,” said Smithfield President and CEO Shane Smith. “Packaged Meats remains on track to deliver its fifth consecutive year above $1 billion in operating profit in fiscal 2026. The completion of the Nathan’s Famous acquisition further strengthens our brand portfolio and expands our opportunities for profitable growth.”
Smith added, “While we expect commodity market pressure in our upstream businesses to continue in the fourth quarter, our teams remain focused on navigating this environment with operational discipline. We have a strong balance sheet and solid cash generation, giving us the financial flexibility to support our dividend and reinvest in the business, driving shareholder value and positioning Smithfield for long-term growth.”
**Review of Financial Results
Results of Operations**
Financial PositionAs of September 27, 2026, we had $3,481 million of available liquidity consisting of $1,178 million in cash and cash equivalents and $2,303 million of availability under our committed credit facilities. We ended the quarter with a ratio of net debt to adjusted EBITDA(1) on a trailing twelve months basis of 0.5x.
(1) A non-GAAP measure. Please see the table in the Non-GAAP Financial Measures section for a reconciliation to the most comparable GAAP measure.
Dividend UpdateOn April 21, 2026, May 28, 2026, and August 27, 2026, we paid dividends of $0.3125 per share to shareholders. We anticipate a remaining quarterly dividend for fiscal year 2026 of $0.3125 per share, resulting in an annual dividend rate of $1.25 per share. The declaration of dividends is subject to the discretion of our Board and depends on various factors, including our net income, financial condition, cash requirements, business prospects, and other factors that our Board deems relevant to its analysis and decision making.
FY 2026 OutlookAs we look to the remainder of 2026, our outlook takes into account current macroeconomic challenges including softer fresh pork and hog commodity markets.
The Company’s financial outlook is as follows:
-
Total Company sales to be down low-single-digits compared to fiscal year 2025
-
Packaged Meats segment adjusted operating profit ranging from $1,090 million to $1,140 million
-
Fresh Pork segment adjusted operating results ranging from a loss of $50 million to breakeven
-
Hog Production segment adjusted operating results ranging from a loss of $25 million to a profit of $25 million
-
Total Company adjusted operating profit ranging from $900 million to $1,000 million
-
Capital expenditures of between $350 million and $375 million. Our capital expenditures outlook includes investments in profit improvement projects as well as projects for maintenance and repair, and excludes investments in our proposed Sioux Falls processing facility
-
An effective tax rate of between 22.5% and 24.5%
The Company’s outlook for 2026 includes 53 weeks of results and approximately two months of results for Nathan’s Famous following the October 26, 2026 acquisition close, and excludes the impact of the investment in the new processing facility in Sioux Falls, South Dakota.
Conference Call InformationA conference call to discuss the fiscal third quarter financial results is scheduled for today, October 27, 2026, at 9:00 a.m. Eastern Time. A live audio webcast of the conference call, together with related materials, will be available online at investors.smithfieldfoods.com or by dialing 844-539-3338 (international callers please dial 412-652-1269).
A recorded replay of the conference call is expected to be available approximately three hours after the conclusion of the call and can be accessed both online at investors.smithfieldfoods.com and by dialing 855-669-9658 (international callers please dial 412-317-0088). The PIN number to access the telephone replay is 9213986. The replay will be available until November 3, 2026. For more information, please visit investors.smithfieldfoods.com.
About Smithfield FoodsSmithfield Foods, Inc. (Nasdaq: SFD) is an American food company with a leading position in packaged meats and fresh pork products. With a diverse brand portfolio and strong relationships with U.S. farmers and customers, we responsibly meet demand for quality protein around the world. For more information, please visit investors.smithfieldfoods.com.
Non-GAAP Financial MeasuresThis press release includes certain financial information that is not presented in accordance with generally accepted accounting principles in the United States (“GAAP”), including (1) adjusted net income attributable to Smithfield, (2) adjusted net income per diluted common share attributable to Smithfield, (3) EBITDA, (4) adjusted EBITDA, (5) adjusted EBITDA margin, (6) adjusted operating profit, (7) adjusted operating profit margin, (8) net debt and (9) ratio of net debt to adjusted EBITDA. We refer to these measures as “non-GAAP” financial measures.
(1) Adjusted net income attributable to Smithfield is defined as net income, excluding the effects of transactions or events that are not part of our core business activities or are unusual in nature (whether gains or losses) and the tax effects of the foregoing items. We believe that adjusted net income attributable to Smithfield is a useful measure because it excludes the effects of items that are unusual in nature, infrequent in occurrence or otherwise stem from strategic decisions to restructure our operations. (2) Adjusted net income per diluted common share attributable to Smithfield is defined as adjusted net income attributable to Smithfield divided by diluted weighted average shares outstanding. (3) EBITDA is defined as earnings before interest, taxes, depreciation and amortization. We believe that EBITDA is a useful measure because it excludes the effects of financing and investing activities by eliminating interest and depreciation costs to provide a comparable year-over-year analysis. (4) Adjusted EBITDA is defined as EBITDA further adjusted for the effects of items that are unusual in nature, infrequent in occurrence or otherwise stem from strategic decisions to restructure our operations. We believe that adjusted EBITDA is a useful measure because it excludes the effects of items that are unusual in nature, infrequent in occurrence or otherwise stem from strategic decisions to restructure our operations. (5) Adjusted EBITDA margin is defined as adjusted EBITDA divided by total sales. We believe that adjusted EBITDA margin is a useful measure because it evaluates overall operating performance, ability to pursue and service possible debt opportunities and possible future investment opportunities. (6) Adjusted operating profit is defined as operating profit, excluding the effects of items that are unusual in nature, infrequent in occurrence or otherwise stem from strategic decisions to restructure our operations. (7) Adjusted operating profit margin is adjusted operating profit expressed as a percentage of sales. We believe that adjusted net income per diluted common share attributable to Smithfield, adjusted operating profit and adjusted operating profit margin provide a better understanding of underlying operating results and trends of established, ongoing operations of our business. (8) Net debt is defined as long-term debt and finance lease obligations, including the current portion, minus cash and cash equivalents. We believe that net debt is a useful measure because it helps to give investors a clear understanding of our financial position and is also used to calculate certain leverage ratios. (9) Ratio of net debt to adjusted EBITDA is defined as net debt divided by adjusted EBITDA. We believe that ratio of net debt to adjusted EBITDA is a useful measure because it monitors the sustainability of our debt levels and our ability to take on additional debt against adjusted EBITDA, which is used as an operating performance measure.
Although these non-GAAP measures are frequently used by investors and securities analysts in their evaluations of companies in industries similar to ours, these non-GAAP measures have limitations as analytical tools, are not measurements of our performance under GAAP and should not be considered as alternatives to operating profit, net income or any other performance measures derived in accordance with GAAP and should not be used by investors or other users of our financial statements in isolation for formulating decisions, as such non-GAAP measures exclude a number of important cash and non-cash charges.
You should be aware that our presentation of these and other non-GAAP financial measures in this press release may not be comparable to similarly titled measures used by other companies. A reconciliation of each of these non-GAAP measures to its most directly comparable financial measure calculated in accordance with GAAP is provided in this release.
The Company’s outlook for fiscal year 2026 includes adjusted operating profit and adjusted segment operating profit. The Company is not able to reconcile its fiscal year 2026 projected adjusted results to its fiscal year 2026 projected GAAP results because certain information necessary to calculate such measures on a GAAP basis is unavailable or dependent on the timing of future events outside of our control. Therefore, because of the uncertainty and variability of the nature of and the amount of any potential applicable future adjustments, which could be significant, the Company is unable to provide a reconciliation for these forward-looking non-GAAP measures without unreasonable effort.
Forward-Looking StatementsThis press release contains forward-looking statements within the meaning of the Private Securities Litigation Reform Act of 1995. All statements other than statements of historical facts contained in this press release, including statements regarding our strategy, future financial condition, future operations, projected costs, prospects, plans, objectives of management, and expected market growth, are forward-looking statements. In some cases, you can identify forward-looking statements because they contain words such as “may,” “will,” “shall,” “should,” “expects,” “plans,” “anticipates,” “intends,” “projects,” “contemplates,” “believes,” or “estimates” or other similar terms or expressions that concern our expectations, strategy, plans, or intentions. Specific forward-looking statements in this press release include our financial outlook for 2026, our ability to expand opportunities for profitable growth through the Nathan’s Famous acquisition, the anticipated remaining dividend payment of $0.3125 per share in fiscal 2026, as well as our ability to support our dividend and reinvest in the business, and our objective of creating shareholder value and positioning Smithfield for long-term growth.
We have based the forward-looking statements contained in this press release primarily on our current expectations, estimates, forecasts and projections about future events and trends that we believe may affect our business, results of operations, financial condition and prospects. Although we believe that we have a reasonable basis for each forward-looking statement contained in this press release, the results, events and circumstances reflected in the forward-looking statements may not be achieved or occur, and actual results, events or circumstances could differ materially from those described in the forward-looking statements. We undertake no duty to update any statement made in this press release in light of new information or future events.
The forward-looking statements contained in this press release are subject to substantial risks and uncertainties that could affect our current expectations and our actual results, including, among others: (1) the cyclical nature of our operations and fluctuations in commodity prices; (2) our dependence on third- party suppliers; (3) our ability to execute on our strategy to optimize the size of our hog production operations; (4) our ability to navigate geopolitical risks including increased tariffs on our exports; (5) our ability to mitigate higher input costs through productivity improvements in our operations, procurement strategies and the use of derivative instruments; (6) our ability to compete successfully in the food industry; (7) our ability to anticipate and meet consumer trends and interests through product innovation; (8) compliance with laws and regulations, including environmental, cybersecurity and tax laws and regulations in the United States and Mexico; (9) our ability to defend litigation brought against us and the sufficiency of our accruals for related contingent losses; (10) our ability to prevent cyberattacks, security breaches or other disruptions of our information technology systems; (11) future investments in our business, our anticipated capital expenditures and our estimates regarding our capital requirements; (12) our dividend policy and our ability to pay dividends; and (13) our status as a “controlled company” and any resulting potential conflicts of interest. A detailed discussion of these factors and other risks that affect our business is contained in our SEC filings, including our reports on Form 10-K and Form 10-Q, particularly under the heading “Risk Factors.” Copies of these filings are available online from the SEC or by contacting Smithfield’s Investor Relations Department at [email protected] or by clicking on SEC Filings on the Smithfield Investor Relations website at investors.smithfieldfoods.com.
A full PDF of this release, including financial charts can be found HERE.

Privacy Preference Center
When you visit any website, it may store or retrieve information on your browser, mostly in the form of cookies. This information might be about you, your preferences, or your device, and is mostly used to make the site work as you expect. The information does not usually identify you directly, but it can give you a more personalized web experience. Because we respect your right to privacy, you can choose not to allow some types of cookies. Click on the different category headings to learn more and change our default settings. Blocking some types of cookies may impact your experience of the site and the services we are able to offer.
Privacy Policy
Allow All
Manage Consent Preferences
Strictly Necessary Cookies
Always Active
These cookies are necessary for the website to function and cannot be switched off in our systems. They are usually only set in response to actions made by you which amount to a request for services, such as setting your privacy preferences, logging in or filling in forms. You can set your browser to block or alert you about these cookies, but some parts of the site will not then work. These cookies do not store any personally identifiable information.
Performance Cookies
Performance Cookies
These cookies allow us to count visits and traffic sources so we can measure and improve the performance of our site. They help us to know which pages are the most and least popular and see how visitors move around the site. All information these cookies collect is aggregated and therefore anonymous. If you do not allow these cookies we will not know when you have visited our site, and will not be able to monitor its performance.
Functional Cookies
Functional Cookies
These cookies enable the website to provide enhanced functionality and personalisation. They may be set by us or by third party providers whose services we have added to our pages. If you do not allow these cookies then some or all of these services may not function properly.
Targeting Cookies
Targeting Cookies
These cookies may be set through our site by our advertising partners. They may be used by those companies to build a profile of your interests and show you relevant adverts on other sites. They do not store directly personal information, but are based on uniquely identifying your browser and internet device. If you do not allow these cookies, you will experience less targeted advertising.
Cookie List
Clear
Apply Cancel
Leg.Interest
checkbox label label
checkbox label label
checkbox label label
Reject All