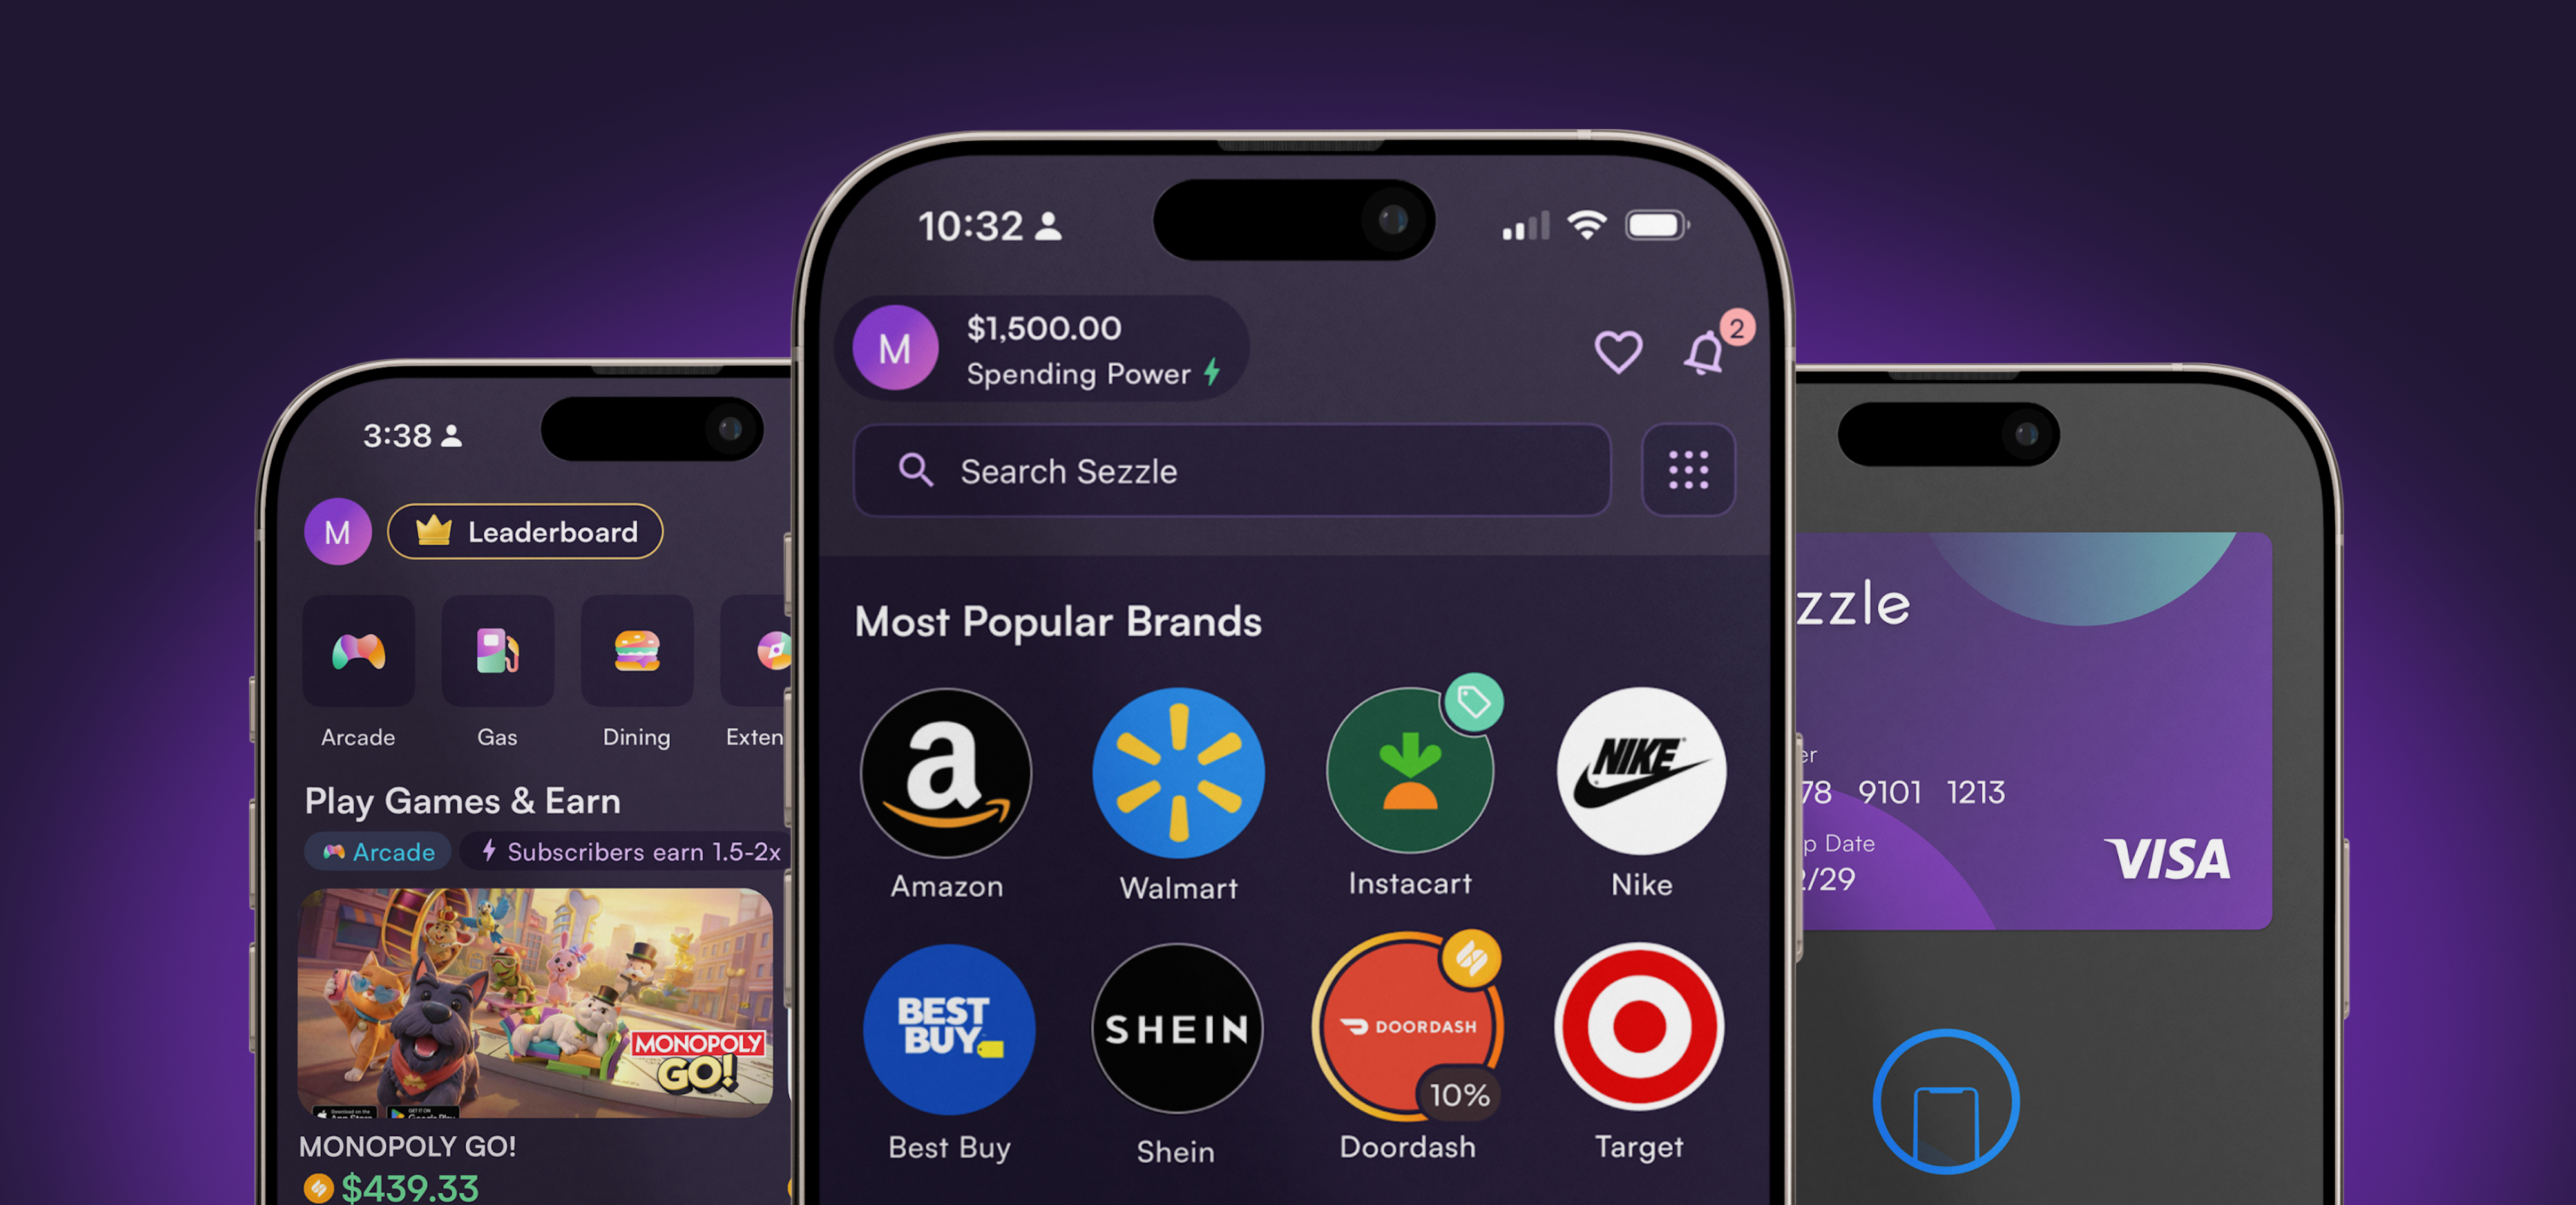
Sezzle Inc. is a payments company that operates a digital shopping and payments platform providing consumers with buy-now-pay-later solutions. Launched in 2017, the company offers installment payment products including pay-in-four, pay-in-two, and pay-in-full options, allowing users to split purchases into installments over time. The platform integrates with merchant websites via widgets or APIs and is accessible through a mobile application and online dashboard. Sezzle serves consumers in the United States and Canada, targeting Gen Z and Millennial demographics, while partnering with merchants to provide an alternative to traditional credit. The company’s credit products are primarily originated by its banking partner, WebBank. Additional features include Sezzle Premium, Sezzle Anywhere for virtual card usage, and Sezzle Up for voluntary credit reporting. The platform also offers rewards through the Sezzle Earn tab, which includes financial literacy modules powered by Zogo and partner-sponsored offers. Sezzle operates as a Delaware public benefit corporation, focusing on financial empowerment and responsible credit access for its user base.

Summarised from the company's own disclosures, fiscal year ended Feb 2026

Industry Credit Services Homepage sezzle.com
Sector Financial Services IR page investors.sezzle.com
Tags
buy-now-pay-later, installment payments, digital payments, consumer credit, fintech, merchant integration, mobile payments, credit reporting, financial literacy, rewards programs, Sezzle Platform, Pay-in-Four, Pay-in-Full, Pay-in-Two, Sezzle Premium, Sezzle Anywhere, Sezzle On-Demand, Payment Streaks, Sezzle Earn, Sezzle Up, Money IQ, WebBank, Zogo, Sezzle Mobile
Press page sezzle.com/news

Metrics

Valuation  
Market cap $ 3.65B
Market cap (USD) $ 3.65B
P/E 20.74
PEG —
P/BV 13.14
P/S 11.39
P/OCF 9.55
P/FCF 9.57
Dividend yield —
Turnover / mcap —
Returns  
ROE 103.3%
ROI 43.0%
ROIC 46.6%
Profit margin 56.4%
Growth  
Revenue growing Yes
Profits growing Yes
Revenue up 3y No
Revenue up 5y —
Earnings growth 3y (net profit CAGR) —
Quality  
Profitable Yes
Margin expanding Yes
Buying back stock No
Diluting (TTM) No
Debt/Equity 82.4%
Podcast bulls (TTM) Sign up
Podcast bears (TTM) Sign up
Podcast sentiment (TTM) Sign up
Podcast sentiment % (TTM) Sign up
News sentiment (TTM) 47
Quality score 52.9%
Insiders  
Buys, 1w Sign up
Buys, 1m Sign up
Buys, 1y Sign up
Sells, 1w Sign up
Sells, 1m Sign up
Sells, 1y Sign up

Sign up to see this company's insider trades

Figure FY 2025 FY 2024 FY 2023 FY 2022 FY 2021 FY 2020
Revenue 235.878M 139.396M 60.626M 125.57M 114.817M 0
Net profit 133.13M 78.522M 7.098M -38.094M -75.168M 0
Free cash flow 209.252M 40.83M -25.772M 8.46M -72.818M —

Figure FY 2025 FY 2024 FY 2023 FY 2022 FY 2021 FY 2020
Share price 63.48 255.8 20.52 — — —
Price performance 12m -0.75 11.47 — — — —

Filed figures

Figure Dec 2019 Dec 2020 Dec 2021 Dec 2022 Dec 2023 Dec 2024 Dec 2025
Balance sheet detail
Lease liabilities (USD) — 142,743 262,921 79,312 1.04M 919,271 824,000
Cash and deposits (USD) 36.6M 84.3M 77M 68.3M 67.6M 73.2M 64.1M
Intangible assets (USD) — 537,046 910,584 1.32M 1.9M 2.44M 3.33M
Right-of-use assets (USD) — 145,576 285,865 86,715 994,476 800,424 665,000
Cash flow detail
Operating cash flow (USD) — -24.8M -72.1M 8.51M -25.7M 40.9M 210M
Purchases of property, plant and equipment (USD) — -410,896 -686,032 -52,236 -81,609 -69,760 -655,000
Change in payables (cash effect) (USD) — 47.5M 35.7M -12.9M -9.12M -4.34M -13M
Share buybacks (cash effect) (USD) — -611,215 -2.65M -381,434 -1.68M -23.6M -64.7M
Interest paid (cash effect) (USD) — -3.77M -4.82M -7.79M -16.4M -14M -15.3M
Income taxes paid (cash effect) (USD) — -8,326 -56,017 -65,395 -452,426 -4.77M -28.1M
Share-based compensation (USD) — 7.01M 14.2M 10.3M 6.93M 5.19M 6.52M
Free cash flow (OCF - PPE - intangibles) (USD) — -25.2M -72.8M 8.46M -25.8M 40.8M 209M
Income detail
Total comprehensive income (USD) — -31.9M -75.1M -39.3M 7.09M 77.6M 134M
Comprehensive income to owners (USD) — -31.9M -75.1M -39.3M 7.09M 77.6M 134M
Reported Aug 16, 2021 Mar 30, 2022 Mar 30, 2022 Feb 28, 2023 Feb 29, 2024 Feb 27, 2025 Feb 26, 2026

Operating KPIs — quarters

KPI Sep 25
Monthly active users YoY growth (company-stated) +38.0%
Reported Nov 5, 2025

Sign up to see institutional holdings

Sign Up

Podcast Mentions

Sign up to see podcast mentions and sentiment

Sign Up

Sezzle Inc. — Regulation FD Disclosure Bull 0 Bear 0 Routine

Beginning November 9, 2026, Sezzle Inc. (the “Company”) may commence investor and analyst presentations using the slide presentation which is attached as Exhibit 99.1 to this Current Report on Form 8-K (the “Investor Presentation”) and is incorporated herein by reference.

The information contained in the Investor Presentation is summary information that is intended to be considered in the context of the Company’s Securities and Exchange Commission (“SEC”) filings and other public announcements that the Company may make, by press release or otherwise, from time to time. The Company undertakes no duty or obligation to publicly update or revise the information contained in this report.

Sezzle Reports Third Quarter 2026 Results Bull 5 Bear 0 Results

Wed, 04 Nov 2026 17:01:00 -0400 | Globe Newswire

Content Section

  • Total Transaction Volume__1 (TTV) reached $1.4 billion, representing 34.9% YoY growth
  • Total Revenue grew 42.6% YoY to a record $166.5 million, outpacing TTV growth by 7.7 percentage points
  • Active Subscribers up 68.1% YoY to 955,000
  • Net Income increased 79.3% YoY to $47.8 million, or $1.38 per Diluted Share, up 84.0%; Adjusted Net Income rose 89.9% to $47.7 million, with Adjusted Net Income per Diluted Share increasing 95.7% to $1.37
  • Raised FY2026 guidance to approximately 42.5% Total Revenue growth, $190.0 million of Adjusted Net Income (48.8% YoY growth)2, and $5.45–$5.50 of Adjusted Net Income per Diluted Share
  • Introduced preliminary FY2027 guidance for Adjusted Net Income__2 per Diluted Share of $7.20, representing 30.9%–32.1% growth over FY2026 guidance

MINNEAPOLIS, Nov. 04, 2026 (GLOBE NEWSWIRE) -- Sezzle Inc. (NASDAQ:SEZL ) (Sezzle or Company) // Sezzle is pleased to update the market on key financial metrics for the quarter ended September 30, 2026.

"We enter the holiday season with Subscribers approaching one million and transaction frequency reaching a Company high," stated Charlie Youakim, Sezzle Executive Chairman and CEO. "SezzleCash is showing encouraging results, bringing new Subscribers onto the platform, many of whom subsequently shop with Anywhere at checkout. We are raising FY2026 guidance for the fourth time, with Total Revenue growth now expected to reach approximately 42.5%, Adjusted Net Income of $190 million, and Adjusted Net Income per Diluted Share of $5.45–$5.50. We are also introducing preliminary FY2027 guidance of $7.20 in Adjusted Net Income per Diluted Share."

Third Quarter 2026 Highlights

  • Total Transaction Volume increased 34.9% YoY to a quarterly high of $1.4 billion, supported by continued growth in the Subscriber base and incremental volume from SezzleCash and Sezzle Send. Average quarterly transaction3 frequency rose to a Company high of 7.8x from 6.5x in the prior comparable period.
  • Total Revenue increased 42.6% YoY to a record $166.5 million, exceeding TTV growth by 7.7 percentage points. Total Revenue as a percentage of TTV expanded 60 basis points to 11.9% from 11.3% in 3Q25.
  • Active Subscribers4 grew 68.1% YoY to 955,000 (rounded to the nearest thousand). SezzleCash demonstrated early traction as an added benefit of Sezzle Anywhere, contributing to Subscriber acquisition and engagement.
  • Total Operating Expenses increased 25.9% YoY to $102.3 million, well below Total Revenue growth of 42.6%. Operating Expenses decreased 8.2 percentage points YoY to 61.4% of Total Revenue and 0.5 percentage points to 7.3% of TTV.
  • Transaction Related Costs5 decreased 1.0 percentage point YoY to 4.2% of TTV, with all three components improving. The Provision for Credit Losses eased to 2.7% of TTV from 3.1% in 3Q25, and the Company's FY2026 target is now approximately 2.5% of TTV, compared with its prior target range of 2.5%–3.0% of TTV (previously expressed as a percentage of GMV). Transaction Expense declined to 1.3% of TTV from 1.7% in 3Q25, benefiting in part from a $3.7 million payment network incentive. Net Interest Expense declined to a Company low of 0.2% of TTV from 0.4%. In absolute terms, Transaction Related Costs were $58.8 million, 9.8% higher YoY.
  • Operating Income grew 80.7% YoY to $64.3 million, nearly twice the rate of Total Revenue growth. Operating Margin improved 8.2 percentage points YoY to 38.6%, and Operating Income reached 4.6% of TTV, up from 3.4% in 3Q25.
  • Total Revenue Less Transaction Related Costs5 set a new quarterly high of $107.7 million, up 70.3% YoY. As a share of Total Revenue and TTV, the metric expanded to 64.7% and 7.7%, up 10.5 and 1.6 percentage points YoY, respectively.
  • Non-Transaction Related Operating Expenses5 rose 46.2% YoY to $46.2 million, representing 27.8% of Total Revenue compared with 27.1% in 3Q25. Marketing expenses moderated sequentially to $15.9 million from $19.4 million in 2Q26, while remaining above the $8.8 million reported in 3Q25. Higher Third-party Technology and Data costs also reflected continued investment in the Company's technology infrastructure to support platform growth and resilience.
    • Corporate Strategic Project Costs were $2.4 million in the quarter, reflecting professional services for the antitrust suit and national bank charter application.
  • Net Income rose 79.3% YoY to $47.8 million, or $1.38 per Diluted Share, compared with $0.75 in 3Q25. Net Income Margin widened 5.9 percentage points YoY to 28.7%.
    • Adjusted Net Income6 nearly doubled, rising 89.9% YoY to $47.7 million and representing 28.6% of Total Revenue. Adjusted Net Income per Diluted Share came in at $1.37, versus $0.70 in 3Q25.
  • Adjusted EBITDA6 climbed 77.1% YoY to $70.2 million. Adjusted EBITDA Margin expanded 8.2 percentage points YoY to 42.1% of Total Revenue.

Balance Sheet and Liquidity

  • As of September 30, 2026, Sezzle had $107.9 million of cash, cash equivalents, and restricted cash, $37.7 million of which was restricted.
  • The Company had $104.0 million outstanding on its $300.0 million credit facility as of quarter end.
  • To support the broader launch of SezzleCash and Sezzle Send, Sezzle entered into a retention arrangement with WebBank, under which WebBank originates and holds eligible SezzleCash and Sezzle Send loans off the Company's balance sheet. Sezzle continues to service the loans.

Guidance****7

The Company is raising its FY2026 guidance as follows:

2026 Guidance
Nov 2025 Feb 2026 May 2026
Total Revenue Growth Not provided 25%–30% 30%–35%
Adjusted Net Income7 Not provided $170.0M $180.0M
Adjusted Net Income Per Diluted Share $4.35 $4.70 $5.10

The Company is also introducing preliminary FY2027 guidance for Adjusted Net Income Per Diluted Share8 as follows:

2027 Guidance
Adjusted Net Income Per Diluted Share $7.20

Initiatives Update

  • SezzleCash completed its first full quarter following its June launch, showing encouraging signs of Subscriber acquisition and cross-selling. More than 15% of SezzleCash-eligible new Anywhere Subscribers made their first transaction through SezzleCash, with over 60% of those Subscribers subsequently shopping with Sezzle at checkout. Sezzle Send launched in beta during 3Q26 and rolled out to all users in October, introducing peer-to-peer payments to the Sezzle platform.
  • September enhancements to Sezzle Up, the Company's opt-in credit reporting program, expanded eligibility and streamlined enrollment. Average weekly enrollments approximately doubled in the 30 days following these changes compared with the preceding 30-day period.
  • Subsequent to quarter end, Sezzle soft-launched Sezzle Anywhere in Canada. The offering includes Canada's only BNPL virtual card that can be used anywhere Visa is accepted, both online and in-store.
  • In October 2026, Sezzle filed an application with the Office of the Comptroller of the Currency to establish Sezzle Bank, N.A., a national bank, along with an application to the Federal Deposit Insurance Corporation for federal deposit insurance.

Upcoming Investor Events

  • Sezzle Management will participate in the upcoming investor events:
    • November 10, 2026: Citi’s 15th Annual FinTech Conference
    • November 11, 2026: KBW Fintech Ecosystem Conference
    • November 17, 2026: TD Cowen 2026 Financials & Fintech Conference
    • December 9, 2026: Needham Midwest Non-Deal Roadshow

Quarterly Conference Call and Presentation

The Company will host its third quarter earnings conference call on November 4, 2026, at 5:00pm ET.

To register for the call, please navigate to: https://dpregister.com/sreg/10212561/1050d1c7acb

All participants can access the webcast using the following link: https://event.choruscall.com/mediaframe/webcast.html?webcastid=fYeuLPav

Upon registration, participants will receive the dial-in number. Those without internet access or unable to pre-register may dial in by calling: 1-866-777-2509 (US/CA toll free) or 1-412-317-5413 (international toll). A replay will be available until November 11, 2026. To access the replay dial 1-855-669-9658 (US toll free) or 1-412-317-0088 (International toll). Replay access code: 7590410.

In conjunction with the earnings call, the Company will release its presentation on the Sezzle Investor Relations website before the call. Please navigate to the Sezzle Investor Relations website for the presentation that management will review on the call.

3Q26 GAAP Operating Results

For the three months ended
($ in thousands) Sep 30, 2026 Sep 30, 2025 YoY Difference
Total Revenue $ 166,503 $ 116,796 42.6 %
Operating Expenses $ 102,252 $ 81,235 25.9 %
Operating Expenses as % of Total Revenue 61.4 % 69.6 % (8.2 ppt)
Operating Expenses as % of TTV 7.3 % 7.8 % (0.5 ppt)
Operating Income $ 64,251 $ 35,561 80.7 %
Operating Income as % of Total Revenue 38.6 % 30.4 % 8.2 ppt
Operating Income as % of TTV 4.6 % 3.4 % 1.2 ppt
Net Income $ 47,825 $ 26,671 79.3 %
Net Income as % of Total Revenue 28.7 % 22.8 % 5.9 ppt
Net Income per Diluted Share $ 1.38 $ 0.75 84.0 %

3Q26 Non-GAAP Operating Results****9

For the three months ended
($ in thousands) Sep 30, 2026 Sep 30, 2025 YoY Difference
Non-Transaction Related Operating Expenses $ 46,244 $ 31,623 46.2 %
Non-Transaction Related Operating Expenses as % of Total Revenue 27.8 % 27.1 % 0.7 ppt
Transaction Related Costs $ 58,789 $ 53,535 9.8 %
Transaction Related Costs as % of Total Revenue 35.3 % 45.8 % (10.5 ppt)
Transaction Related Costs as % of TTV 4.2 % 5.2 % (1.0 ppt)
Total Revenue Less Transaction Related Costs $ 107,714 $ 63,261 70.3 %
Total Revenue Less Transaction Related Costs as % of Total Revenue 64.7 % 54.2 % 10.5 ppt
Total Revenue Less Transaction Related Costs as % of TTV 7.7 % 6.1 % 1.6 ppt
Adjusted EBITDA $ 70,177 $ 39,623 77.1 %
Adjusted EBITDA Margin 42.1 % 33.9 % 8.2 ppt
Adjusted Net Income $ 47,702 $ 25,119 89.9 %
Adjusted Net Income Margin 28.6 % 21.5 % 7.1 ppt
Adjusted Net Income per Diluted Share $ 1.37 $ 0.70 95.7 %

Appendix - Reconciliation of GAAP to Non-GAAP Financial Measures

Reconciliation of Operating Expenses to Non-transaction Related Operating Expenses

For the three months ended
($ in thousands) September 30, 2026 September 30, 2025
Operating expenses $ 102,252 $ 81,235
Transaction expense (18,342 ) (17,435 )
Provision for credit losses (37,666 ) (32,177 )
Non-transaction related operating expenses $ 46,244 $ 31,623

Reconciliation of Operating Expenses to Transaction Related Costs

For the three months ended
($ in thousands) September 30, 2026 September 30, 2025
Operating expenses $ 102,252 $ 81,235
Personnel (16,804 ) (14,320 )
Third-party technology and data (6,496 ) (3,705 )
Marketing, advertising, and tradeshows (15,893 ) (8,775 )
General and administrative (7,051 ) (4,823 )
Net interest expense 2,781 3,923
Transaction related costs $ 58,789 $ 53,535

Reconciliation of Operating Income to Total Revenue Less Transaction Related Costs

For the three months ended
($ in thousands) September 30, 2026 September 30, 2025
Operating income $ 64,251 $ 35,561
Personnel 16,804 14,320
Third-party technology and data 6,496 3,705
Marketing, advertising, and tradeshows 15,893 8,775
General and administrative 7,051 4,823
Net interest expense (2,781 ) (3,923 )
Total revenue less transaction related costs $ 107,714 $ 63,261

Reconciliation of Net Income to Adjusted EBITDA

For the three months ended
($ in thousands) September 30, 2026 September 30, 2025
Net income $ 47,825 $ 26,671
Depreciation and amortization 559 369
Income tax expense 13,591 4,961
Equity and incentive-based compensation 2,921 2,409
Other (income) expense, net 54 6
Corporate strategic projects 2,446 1,284
Net interest expense 2,781 3,923
Adjusted EBITDA $ 70,177 $ 39,623

Reconciliation of Net Income to Adjusted Net Income and Adjusted Net Income per Diluted Share

For the three months ended
($ in thousands, except for per share numbers) September 30, 2026 September 30, 2025
Net income $ 47,825 $ 26,671
Discrete tax benefit (1,999 ) (2,520 )
Corporate strategic projects 2,446 1,284
Other (income) expense, net 54 6
Income tax effect of non-GAAP adjustments(1) (624 ) (322 )
Adjusted net income 47,702 25,119
Diluted weighted-average shares outstanding 34,753 35,675
Adjusted net income per diluted share $ 1.37 $ 0.70

(1) Adjusted prior periods to include the income tax effect of non-GAAP adjustments at an effective tax rate of 24.9%.

Investors should be aware that generally accepted accounting principles prescribe when a company may reserve for particular risks, including litigation exposures. Accordingly, results for a given reporting period could be significantly affected if and when we establish reserves for one or more contingencies. Also, our regular reserve reviews may result in adjustments of varying magnitude as additional information regarding claims activity becomes known. Reported results, therefore, may be volatile in certain accounting periods.

Prompts

Sezzle Inc. (ticker SEZL), listed in United States.

Company History

Date Change Detail
— Former tickers SZL

ETFs Holding Sezzle Inc.

ETF Weight in ETF Shares Market value As of
BPAY 3.12% 1,680 $ 272.026K Nov 16, 2026
IVSS 2.09% 3,284 $ 563.633K Jun 30, 2026
FTKI 1.47% 2,305 $ 373.226K Nov 16, 2026
PSC 1.30% 176,290 $ 30.257M Jun 30, 2026
JSML 0.73% 17,214 $ 2.664M Jul 31, 2026
JSMD 0.67% 45,685 $ 7.07M Jul 31, 2026
MMSC 0.64% 1,986 $ 321.573K Nov 16, 2026
SAGP 0.28% 1,236 $ 212.135K Jun 30, 2026
FSML 0.20% 1,430 $ 245.431K Jun 30, 2026
RESM 0.14% 30 $ 5,148.90 Jun 30, 2026
AVSC 0.13% 25,089 $ 4.062M Nov 16, 2026
SMDX 0.13% 992 $ 160.625K Nov 17, 2026
DFAS 0.11% 232,444 $ 35.952M Nov 12, 2026
VFMO 0.04% 7,016 $ 845.779K Aug 31, 2026
JMEE 0.04% 6,494 $ 1.002M Nov 17, 2026
AVUQ 0.03% 737 $ 119.335K Nov 16, 2026
DFAC 0.01% 63,647 $ 9.844M Nov 12, 2026
MSSM 0.01% 597 $ 71.968K Aug 31, 2026
AVUS 0.01% 12,695 $ 2.056M Nov 16, 2026
DFAU 0.01% 6,233 $ 964.058K Nov 12, 2026
DCOR 0.01% 18,369 $ 2.841M Nov 12, 2026
DXUV 0.01% 2,222 $ 343.677K Nov 12, 2026
DFUS 0.00% 6,404 $ 990.507K Nov 12, 2026
EBI 0.00% 22 $ 2,652.10 Aug 31, 2026
AVSU 0.00% 11 $ 1,781.12 Nov 16, 2026