Revenue of $326.1 million, in line with the midpoint of guidance
Cash flow from operations of $20.4 million; fifth consecutive quarter of positive free cash flow
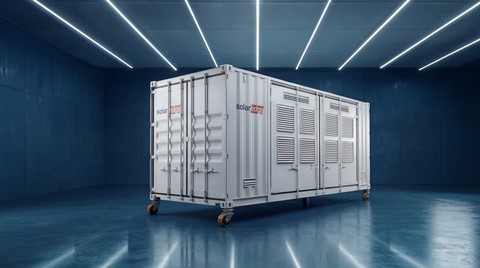
Continued progress on the SolarEdge SST platform for the AI data center opportunity
MILPITAS, Calif.--(BUSINESS WIRE)--Nov. 4, 2026-- SolarEdge Technologies, Inc. (Nasdaq: SEDG), a global leader in smart energy technology, today announced its financial results for the third quarter ended September 30, 2026.
“The SolarEdge team delivered third-quarter revenue of $326.1 million, at the midpoint of our guidance, with profitability in line with expectations,” said Shuki Nir, CEO of SolarEdge. “As near-term market uncertainty persists and given reduced revenue expectations for the fourth quarter, we are taking decisive steps to reduce costs, sharpen our focus, and support profitability amid softer demand. At the same time, we believe that our product innovation initiatives, including strong momentum in Nexis and increasing storage adoption, position us to capitalize on a market recovery. In addition, we are accelerating our efforts in the AI data center power infrastructure market, where live demonstrations of our solid-state transformer (SST) technology are generating increasing interest from potential partners and customers.”
Third Quarter 2026 Financial Highlights(In millions, except percentages and per share data)
| | GAAP | Non-GAAP (1) |
| | Q3 2026 | Q2 2026 | Q3 2025 | Q3 2026 | Q2 2026 | Q3 2025 |
| Revenue | $326.1 | $346.2 | $340.2 | $325.4 | $345.5 | $339.7 |
| Gross margin | 33.2% | 27.5% | 21.2% | 34.7% | 28.6% | 18.8% |
| Operating expenses | $110.1 | $111.2 | $107.3 | $88.8 | $88.5 | $87.7 |
| Operating income (loss) | $(1.9) | $(16.0) | $(35.2) | $23.9 | $10.2 | $(23.8) |
| Net income (loss) | $(8.4) | $(30.8) | $(50.1) | $21.1 | $3.6 | $(18.3) |
| EPS (diluted) | $(0.14) | $(0.50) | $(0.84) | $0.29 | $0.05 | $(0.31) |
| Adjusted EBITDA (loss) (1) | -- | -- | -- | $31.8 | $18.3 | $(14.1) |
| |
| (1) Non-GAAP financial measure. See “Non-GAAP Financial Measures” for additional information on Non-GAAP financial measures and a reconciliation to the most comparable GAAP measures. |
-
GAAP revenues were $326.1 million, down 5.8% from the prior quarter and down 4.1% from the third quarter of 2025.
-
Non-GAAP revenues were $325.4 million, down 5.8% from the prior quarter and down 4.2% from the third quarter of 2025.
-
GAAP gross margin was 33.2%, compared to 27.5% in the prior quarter and 21.2% in the third quarter of 2025. Results include a benefit of $36.0 million related to IEEPA tariff matters.
-
Non-GAAP gross margin was 34.7%, compared to 28.6% in the prior quarter and 18.8% in the third quarter of 2025. Results include a benefit of $36.0 million related to IEEPA tariff matters.
-
GAAP operating expenses were $110.1 million, compared to $111.2 million in the prior quarter and $107.3 million in the third quarter of 2025.
-
Non-GAAP operating expenses were $88.8 million, compared to $88.5 million in the prior quarter and $87.7 million in the third quarter of 2025.
-
GAAP operating loss was $1.9 million, compared to $16.0 million in the prior quarter and $35.2 million in the third quarter of 2025.
-
Non-GAAP operating income was $23.9 million, compared to $10.2 million in the prior quarter and a non-GAAP operating loss of $23.8 million in the third quarter of 2025.
-
GAAP net loss was $8.4 million, compared to $30.8 million in the prior quarter and $50.1 million in the third quarter of 2025.
-
Non-GAAP net income was $21.1 million, compared to $3.6 million in the prior quarter and a non-GAAP net loss of $18.3 million in the third quarter of 2025.
-
Free cash flow was $7.8 million, compared to $3.1 million in the prior quarter and $22.8 million in the third quarter of 2025, marking the fifth consecutive quarter of positive free cash flow.
-
As of September 30, 2026, our cash and investments portfolio, net of debt, was $260.9 million, compared to $264.6 million as of June 30, 2026.
Outlook for the Fourth Quarter of 2026
The Company provides the following guidance for the fourth quarter ending December 31, 2026. This guidance excludes potential IEEPA refunds in the fourth quarter.
| Guidance Metric | Q4 2026 Guidance |
| Revenue | $245 million – $275 million |
| Non-GAAP gross margin* | 17% – 21% |
| Non-GAAP operating expenses* | $87 million – $91 million |
*****Non-GAAP gross margin and Non-GAAP operating expenses are non-GAAP financial measures, and these forward-looking measures have not been reconciled to the most comparable GAAP outlook because it is not possible to do so without unreasonable efforts due to the uncertainty and potential variability of reconciling items, which are dependent on future events and often outside of management’s control and which could be significant. Because such items cannot be reasonably predicted with the level of precision required, we are unable to provide outlook for the comparable GAAP measures. Forward-looking estimates of Non-GAAP gross margin and Non-GAAP operating expenses are made in a manner consistent with the relevant definitions and assumptions noted herein and in our filings with the SEC.
Conference Call
The Company will host a conference call to discuss its results for the third quarter ended September 30, 2026 at 8:00 a.m. ET on Wednesday, November 4, 2026. The live call can be accessed by dialing +800-420-1459. For international callers, please dial +203-518-9861. The Conference ID is SEDG.
To avoid a delay in connecting to the call, please dial-in 10 minutes prior to the start time.
A live webcast will also be available in the Investors Relations section of the Company's website at: http://investors.solaredge.com. A replay of the webcast will be available in the Investor Relations section of the Company's web site approximately two hours after the conclusion of the call and will remain available for approximately 30 calendar days.
About SolarEdge
SolarEdge Technologies is a global leader in renewable energy technology that applies world-class engineering and innovation to provide solar PV solutions for the residential and commercial segments. SolarEdge brings an optimized approach to generating, storing, managing and consuming energy. The company develops and produces PV inverters, Power Optimizers, energy management and optimization solutions, energy storage and grid services. SolarEdge's DC-optimized technology is installed in millions of sites in over 145 countries, and more than 60% of Fortune 100 companies have SolarEdge technology on their rooftops. SolarEdge is accelerating the transition towards distributed, sustainable energy networks which will optimize energy everywhere. SolarEdge is online at www.solaredge.com.
Use of Non-GAAP Financial Measures
To provide investors and others with additional information regarding SolarEdge's results, SolarEdge has disclosed in this earnings release the following non-GAAP financial measures: non-GAAP revenue, non-GAAP operating income (loss), non-GAAP operating expenses, non-GAAP gross margin, non-GAAP net income (loss), non-GAAP net earnings (loss) per share, non-GAAP net free cash flow and Adjusted EBITDA. SolarEdge has provided a reconciliation of each non-GAAP financial measure used in this earnings release to the most directly comparable GAAP financial measure below. These non-GAAP financial measures differ from GAAP in that they exclude stock-based compensation, amortization and impairment of acquired intangible assets, restructuring and impairment charges, acquisition, disposition and other items, certain litigation and other contingencies, amortization of debt issuance cost, non-cash interest expense and non-cash revenue recognized from significant financing component, certain foreign currency exchange rates, gains and losses on investments, income and losses from equity method investments and discrete items that impacted our GAAP tax rate. Our non-GAAP financial measures also reflect the application of our non-GAAP tax rate.
SolarEdge's management uses these non-GAAP financial measures to understand and compare operating results across accounting periods, for internal budgeting and forecasting purposes, for short- and long-term operating plans, to calculate bonus payments and to evaluate SolarEdge's financial performance, the performance of its individual functional groups and the ability of operations to generate cash. Management believes these non-GAAP financial measures reflect SolarEdge's ongoing business in a manner that allows for meaningful period-to-period comparisons and analysis of trends in SolarEdge's business, as they exclude charges and gains that are not reflective of ongoing operating results. Management also believes that these non-GAAP financial measures provide useful information to investors and others in understanding and evaluating SolarEdge's operating results and future prospects from the same perspective as management and in comparing financial results across accounting periods.
The use of non-GAAP financial measures has certain limitations because they do not reflect all items of income and expense that affect SolarEdge's operations. These non-GAAP financial measures should be considered in addition to, not as a substitute for or in isolation from, measures prepared in accordance with GAAP and should not be considered measures of SolarEdge's liquidity. Further, these non-GAAP measures may differ from the non-GAAP information used by other companies, including peer companies, and therefore comparability may be limited. Management encourages investors and others to review SolarEdge's financial information in its entirety and not rely on a single financial measure.
Safe Harbor Statement under the Private Securities Litigation Reform Act of 1995
Statements contained in this press release may contain forward-looking statements that are based on our management's expectations, estimates, projections, beliefs and assumptions in accordance with information currently available to our management. This press release contains certain forward-looking statements within the meaning of Section 27A of the Securities Act of 1933, as amended, and Section 21E of the Securities Exchange Act of 1934, as amended. Forward-looking statements include information, among other things, concerning our possible or assumed future results of operations, our ability to maintain positive free cash flow generation, future demands for solar energy solutions, business strategies, technology developments, new products and services, financing and investment plans; dividend policy; competitive position, industry and regulatory environment, general economic conditions; potential growth opportunities; cancellations and pushouts of existing backlog; installation rates; goodwill impairment; the effects of competition; tariff impacts and other trade measures, including FCC restrictions on equipment produced in foreign countries; the impacts of the One Big Beautiful Bill Act. Forward-looking statements include statements that are not historical facts and can be identified by terms such as "anticipate," "believe," "could," "seek," "estimate," "expect," "intend," "may," "plan," "potential," "predict," "project," "should," "will," "would" or similar expressions and the negatives of those terms.
Forward-looking statements inherently involve known and unknown risks, uncertainties and other factors that may cause our actual results, performance, or achievements to be materially different from any future results, performance or achievements expressed or implied by the forward-looking statements. Given these uncertainties, you should not place undue reliance on forward-looking statements. Also, forward-looking statements represent our management's beliefs and assumptions only as of the date of this release. Important factors that could cause actual results to differ materially from our expectations include, but are not limited to: our ability to be profitable in the future; the rapidly evolving and competitive nature of the solar industry; changes in tax laws, tax treaties, and regulations or the interpretation of them, including the Inflation Reduction Act and the H.R.1; future demand for renewable energy including solar energy solutions; our ability to maintain free cash flow positive generation; macroeconomic conditions in our domestic and international markets, as well as inflation concerns, rising interest rates and recessionary concerns; changes in the U.S. and global trade environments, including the imposition and/or increase of import tariffs or other restrictive trade measures; the retail price of electricity derived from the utility grid or alternative energy sources; our ability to forecast demand for our products accurately and to match production to such demand as well as our customers' ability to forecast demand based on inventory levels; interest rates and supply of capital in the global financial markets in general and in the PV market specifically; competition, including introductions of power optimizer, inverter, EV chargers, batteries, solid-state transformers (SST) and PV system monitoring products by our competitors; developments in alternative technologies or improvements in distributed solar energy generation; historic cyclicality of the solar industry and periodic downturns; product quality or performance problems in our products; changes in our geographic footprint or product and service offerings; our dependence upon a small number of outside contract manufacturers and limited or single source suppliers; delays, disruptions, and quality control problems in manufacturing; shortages, delays, price changes, or cessation of operations or production affecting our suppliers of key components; capacity constraints, delivery schedules, manufacturing yields, and costs of our contract manufacturers and availability of components; changing political, geopolitical conditions, and the conditions of the global energy market; performance of distributors and large installers in selling our products; consolidation in the solar industry among our customers and distributors; our ability to implement our new Enterprise Resource Planning ("ERP") system; our ability to successfully operate our global operations with a reduced work force; our ability to recognize expected benefits from restructuring plans; any unauthorized access to, disclosure, or theft of confidential or personal information or unauthorized access to our network or other similar cyber incidents; attempts by third parties, our employees, or our vendors might gain unauthorized access to our network or seek to compromise our products and services; emerging issues related to the development and use of artificial intelligence; loss of key executives, and our ability to retain key personnel and attract additional qualified personnel; disruption to our business operations due to the evolving conflict in Israel and other conditions in Israel that affect our operations; tax benefits that are available to us under Israeli law require us to meet various conditions and may be terminated or reduced in the future; difficulty to enforce a judgment of a U.S. court against our officers and directors, to assert U.S. securities laws claims in Israel; our dependence on ocean transportation to timely deliver our products in a cost-effective manner; fluctuations in global currency exchange rates; the impact of evolving legal and regulatory requirements, including corporate social responsibility and sustainability requirements; existing and future responses to and effects of pandemics, epidemics or other health crises; reduction, elimination or expiration of government subsidies and economic incentives for on-grid solar electricity applications; changes to net metering policies may reduce demand for electricity from PV systems; stringent and changing data privacy and security laws, rules, regulations and other obligations; federal, state, and local regulations governing the electric utility industry with respect to solar energy; business practices and regulatory compliance of our raw material suppliers; our ability to maintain our brand and to protect and defend our intellectual property; volatility of our stock price; our customers' financial stability, creditworthiness, and debt leverage ratio; our ability to effectively design, launch, market, and sell new generations of our products and services; our ability to retain, and events affecting, our major customers; our ability to service our debt; impairment of our goodwill or other long-lived and intangible assets; our liquidity and ability to service our debt; and the other factors set forth under "Item 1A. Risk Factors" in our Annual Report on Form 10-K/A for the year ended December 31, 2025, filed on March 23, 2026, in subsequent Quarterly Reports on Form 10-Q and in other documents we file from time to time with the SEC that disclose risks and uncertainties that may affect our business. The preceding list is not intended to be an exhaustive list of all of our forward‐looking statements. You should not rely upon forward‐looking statements as predictions of future events. Although we believe that the expectations reflected in the forward‐looking statements are reasonable, we cannot guarantee that future results, levels of activity, performance and events and circumstances reflected in the forward‐looking statements will be achieved or will occur. Statements in this press release speak only as of the date they were made. The Company undertakes no duty or obligation to update any forward-looking statements contained in this release, whether as a result of new information, future events or changes in its expectations or otherwise, except as may be required by applicable law, regulation or other competent legal authority.
| SOLAREDGE TECHNOLOGIES, INC. |
| CONDENSED CONSOLIDATED STATEMENTS OF LOSS (Unaudited) |
| (in thousands, except per share data) |
| |
| | | Three Months Ended****September 30, | | Nine Months Ended****September 30, |
| | | | 2026 | | | | 2025 | | | | 2026 | | | | 2025 | |
| Revenues | | $ | 326,076 | | | $ | 340,177 | | | $ | 982,822 | | | $ | 849,086 | |
| Cost of revenues | | | 217,841 | | | | 268,034 | | | | 711,154 | | | | 727,276 | |
| Gross profit | | | 108,235 | | | | 72,143 | | | | 271,668 | | | | 121,810 | |
| Operating expenses: | | | | | | | | |
| Research and development, net | | | 52,492 | | | | 54,146 | | | | 155,398 | | | | 169,529 | |
| Sales and marketing | | | 26,448 | | | | 26,911 | | | | 81,162 | | | | 87,293 | |
| General and administrative | | | 28,718 | | | | 26,574 | | | | 89,679 | | | | 76,546 | |
| Other operating expense (income), net | | | 2,484 | | | | (338 | ) | | | 18,425 | | | | 41,811 | |
| Total operating expenses | | | 110,142 | | | | 107,293 | | | | 344,664 | | | | 375,179 | |
| Operating loss | | | (1,907 | ) | | | (35,150 | ) | | | (72,996 | ) | | | (253,369 | ) |
| Financial income (expense), net | | | (1,952 | ) | | | 3,040 | | | | (15,367 | ) | | | 5,785 | |
| Other expense, net | | | — | | | | (15,011 | ) | | | — | | | | (10,846 | ) |
| Loss before income taxes | | | (3,859 | ) | | | (47,121 | ) | | | (88,363 | ) | | | (258,430 | ) |
| Income taxes | | | (4,526 | ) | | | (2,563 | ) | | | (8,141 | ) | | | (13,946 | ) |
| Net loss from equity method investments | | | — | | | | (376 | ) | | | — | | | | (951 | ) |
| Net loss | | $ | (8,385 | ) | | $ | (50,060 | ) | | $ | (96,504 | ) | | $ | (273,327 | ) |
| SOLAREDGE TECHNOLOGIES, INC. |
| CONDENSED CONSOLIDATED BALANCE SHEETS (Unaudited) |
| (in thousands, except per share data) |
| |
| | | September 30,2026 | | **December 31, 2**025 |
| ASSETS | | | | |
| CURRENT ASSETS: | | | | |
| Cash and cash equivalents | | $ | 555,083 | | | $ | 455,075 | |
| Restricted cash | | | 42,731 | | | | 84,771 | |
| Marketable securities | | | — | | | | 38,097 | |
| Trade receivables, net of allowances of $29,034 and $17,224, respectively | | | 209,616 | | | | 267,441 | |
| Inventories, net | | | 621,088 | | | | 552,632 | |
| Prepaid expenses and other current assets | | | 408,132 | | | | 341,831 | |
| Total current assets | | | 1,836,650 | | | | 1,739,847 | |
| LONG-TERM ASSETS: | | | | |
| Property, plant and equipment, net | | | 250,764 | | | | 269,351 | |
| Operating lease right-of-use assets, net | | | 47,567 | | | | 48,178 | |
| Intangible assets, net | | | 5,309 | | | | 7,129 | |
| Goodwill | | | 49,859 | | | | 50,123 | |
| Other long-term assets | | | 77,908 | | | | 67,566 | |
| Total long-term assets | | | 431,407 | | | | 442,347 | |
| Total assets | | | 2,268,057 | | | | 2,182,194 | |
| LIABILITIES AND STOCKHOLDERS’ EQUITY | | | | |
| CURRENT LIABILITIES: | | | | |
| Trade payables | | | 490,106 | | | | 271,983 | |
| Employees and payroll accruals | | | 71,845 | | | | 73,992 | |
| Warranty obligations | | | 59,634 | | | | 89,330 | |
| Deferred revenues and customer advances | | | 46,520 | | | | 70,371 | |
| Accrued expenses and other current liabilities | | | 199,733 | | | | 297,819 | |
| Total current liabilities | | | 867,838 | | | | 803,495 | |
| LONG-TERM LIABILITIES: | | | | |
| Convertible senior notes, net | | | 332,724 | | | | 331,561 | |
| Warranty obligations | | | 243,600 | | | | 268,559 | |
| Deferred revenues and customer advances | | | 332,032 | | | | 293,328 | |
| Finance lease liabilities | | | 18,273 | | | | 18,558 | |
| Operating lease liabilities | | | 40,865 | | | | 36,648 | |
| Other long-term liabilities | | | 9,499 | | | | 2,581 | |
| Total long-term liabilities | | | 976,993 | | | | 951,235 | |
| STOCKHOLDERS’ EQUITY: | | | | |
| Common stock of $0.0001 par value - Authorized: 125,000,000; Issued and outstanding: 61,908,887 and 60,360,154 shares as of September 30, 2026 and December 31, 2025, respectively | | | 6 | | | | 6 | |
| Additional paid-in capital | | | 1,949,067 | | | | 1,872,760 | |
| Accumulated other comprehensive income (loss) | | | 4,296 | | | | (11,663 | ) |
| Accumulated deficit | | | (1,530,143 | ) | | | (1,433,639 | ) |
| Total stockholders’ equity | | | 423,226 | | | | 427,464 | |
| Total liabilities and stockholders’ equity | | $ | 2,268,057 | | | $ | 2,182,194 | |
| SOLAREDGE TECHNOLOGIES, INC. |
| CONDENSED CONSOLIDATED STATEMENTS OF CASH FLOWS (Unaudited) |
| (in thousands, except per share data) |
| |
| | | Nine Months Ended September 30, |
| | | | 2026 | | | | 2025 | |
| Cash flows from operating activities: | | | | |
| Net loss | | $ | (96,504 | ) | | $ | (273,327 | ) |
| Adjustments to reconcile net loss to net cash provided by operating activities: | | | | |
| Depreciation and amortization | | | 17,049 | | | | 23,430 | |
| Impairment of asset held-for-sale | | | — | | | | 36,277 | |
| Impairment of privately-held companies | | | — | | | | 15,057 | |
| Stock-based compensation expenses | | | 63,220 | | | | 72,572 | |
| Loss from business disposition | | | 10,874 | | | | 17,875 | |
| Loss (gain) from exchange rate fluctuations | | | (3,376 | ) | | | 2,874 | |
| Loss (gain) from sale of property, plant and equipment | | | 9,550 | | | | (10,075 | ) |
| Other items | | | (924 | ) | | | 281 | |
| Changes in assets and liabilities: | | | | |
| Trade receivables, net | | | 56,214 | | | | (124,459 | ) |
| Inventories, net | | | (50,658 | ) | | | 130,408 | |
| Prepaid expenses and other assets | | | (85,572 | ) | | | 58,655 | |
| Operating lease right-of-use assets, net | | | 9,932 | | | | 8,185 | |
| Trade payables | | | 218,207 | | | | 175,906 | |
| Employees and payroll accruals | | | 9,049 | | | | 1,847 | |
| Warranty obligations | | | (54,627 | ) | | | (37,316 | ) |
| Deferred revenues and customer advances | | | 15,118 | | | | (46,597 | ) |
| Operating lease liabilities | | | (11,172 | ) | | | (10,051 | ) |
| Accrued expenses and other liabilities | | | (50,149 | ) | | | 10,090 | |
| Net cash provided by operating activities | | | 56,231 | | | | 51,632 | |
| Cash flows from investing activities: | | | | |
| Investment in available-for-sale marketable securities | | | — | | | | (454,635 | ) |
| Proceeds from maturities of available-for-sale marketable securities | | | 38,068 | | | | 682,866 | |
| Proceeds from sales of available-for-sale marketable securities | | | — | | | | 76,288 | |
| Purchase of property, plant and equipment | | | (24,550 | ) | | | (14,174 | ) |
| Business dispositions, net of cash sold | | | (2,631 | ) | | | (7,322 | ) |
| Proceeds from sale of property, plant and equipment | | | 661 | | | | 38,026 | |
| Repayment related to governmental grant | | | — | | | | (6,643 | ) |
| Proceeds from sale of investment in privately-held company | | | — | | | | 4,000 | |
| Withdrawal from restricted bank deposits | | | 2,700 | | | | 2,823 | |
| Payments made before lease commencement | | | (26,162 | ) | | | — | |
| Proceeds from loan receivables | | | 91 | | | | 50,743 | |
| Other investing activities | | | 473 | | | | (191 | ) |
| Net cash provided by (used in) investing activities | | | (11,350 | ) | | | 371,781 | |
| Cash flows from financing activities: | | | | |
| Payment for settlement of convertible notes | | | — | | | | (342,250 | ) |
| Repurchase of convertible debt | | | — | | | | (5,093 | ) |
| Issuance of common stock upon exercise of stock-based awards | | | 3,850 | | | | 220 | |
| Tax withholding in connection with stock-based awards, net | | | (2,803 | ) | | | 323 | |
| Other financing activities | | | (1,124 | ) | | | (2,737 | ) |
| Net cash used in financing activities | | | (77 | ) | | | (349,537 | ) |
| Effect of exchange rate changes on cash, cash equivalents and restricted cash | | | 4,474 | | | | 3,181 | |
| Increase in cash, cash equivalents and restricted cash including cash classified within current held-for-sale assets | | | 49,278 | | | | 77,057 | |
| Change in cash classified within current held-for-sale assets | | | 8,690 | | | | — | |
| Increase in cash, cash equivalents and restricted cash | | | 57,968 | | | | 77,057 | |
| Cash, cash equivalents and restricted cash, beginning of period | | | 539,846 | | | | 409,939 | |
| Cash, cash equivalents and restricted cash, end of period | | $ | 597,814 | | | $ | 486,996 | |
| SOLAREDGE TECHNOLOGIES, INC. |
| RECONCILIATION OF NON-GAAP FINANCIAL MEASURES (Unaudited) |
| (in thousands, except per share data and percentages) |
| |
| | Three months ended | Year ended |
| | **September 30,**2026 | | **June 30,**2026 | | **March 31,**2026 | | **December 31,**2025 | | **September 30,**2025 | | December 31, 2025 | | December 31, 2024 | | December 31, 2023 |
| Gross profit (loss) (GAAP) | $ | 108,235 | | | $ | 95,152 | | | $ | 68,281 | | | $ | 74,471 | | | $ | 72,143 | | | $ | 196,281 | | | $ | (877,204 | ) | | $ | 703,823 | |
| Revenues from finance component | | (661 | ) | | | (572 | ) | | | (498 | ) | | | (456 | ) | | | (351 | ) | | | (1,375 | ) | | | (984 | ) | | | (834 | ) |
| Discontinued operation revenues | | — | | | | (152 | ) | | | (64 | ) | | | (1,107 | ) | | | (85 | ) | | | (16,422 | ) | | | — | | | | — | |
| Discontinued operation cost of revenues | | 4 | | | | (240 | ) | | | 573 | | | | (331 | ) | | | (13,101 | ) | | | (4,806 | ) | | | 24,921 | | | | 36,648 | |
| Stock-based compensation | | 4,376 | | | | 3,693 | | | | 3,607 | | | | 3,687 | | | | 3,959 | | | | 16,022 | | | | 21,952 | | | | 23,200 | |
| Amortization of stock-based compensation capitalized in inventories | | 314 | | | | 320 | | | | 313 | | | | 613 | | | | 825 | | | | 2,701 | | | | 3,138 | | | | 1,100 | |
| Amortization and depreciation of acquired assets | | 500 | | | | 499 | | | | 500 | | | | 495 | | | | 501 | | | | 1,970 | | | | 5,412 | | | | 6,038 | |
| Restructuring charges | | — | | | | — | | | | 278 | | | | 344 | | | | 31 | | | | 815 | | | | 15,327 | | | | 23,154 | |
| Gross profit (loss) (Non-GAAP) | $ | 112,768 | | | $ | 98,700 | | | $ | 72,990 | | | $ | 77,716 | | | $ | 63,922 | | | $ | 195,186 | | | $ | (807,438 | ) | | $ | 793,129 | |
| | | | | | | | | | | | | | | | |
| Gross margin (loss) (GAAP) | | 33.2 | % | | | 27.5 | % | | | 22.0 | % | | | 22.2 | % | | | 21.2 | % | | | 16.6 | % | | | (97.3 | )% | | | 23.6 | % |
| Revenues from finance component | | (0.2 | ) | | | (0.3 | ) | | | (0.2 | ) | | | 0.0 | | | | 0.0 | | | | (0.1 | ) | | | (0.1 | ) | | | 0.0 | |
| Discontinued operation revenues | | — | | | | 0.0 | | | | 0.0 | | | | 0.0 | | | | 0.0 | | | | (1.4 | ) | | | — | | | | — | |
| Discontinued operation cost of revenues | | 0.0 | | | | (0.1 | ) | | | 0.2 | | | | 0.0 | | | | (3.9 | ) | | | (0.4 | ) | | | 2.8 | | | | 1.2 | |
| Stock-based compensation | | 1.4 | | | | 1.2 | | | | 1.1 | | | | 1.1 | | | | 1.2 | | | | 1.4 | | | | 2.4 | | | | 0.9 | |
| Amortization of stock-based compensation capitalized in inventories | | 0.1 | | | | 0.1 | | | | 0.1 | | | | 0.0 | | | | 0.2 | | | | 0.2 | | | | 0.3 | | | | 0.0 | |
| Amortization and depreciation of acquired assets | | 0.2 | | | | 0.2 | | | | 0.2 | | | | 0.0 | | | | 0.1 | | | | 0.3 | | | | 0.6 | | | | 0.2 | |
| Restructuring charges | | — | | | | — | | | | 0.1 | | | | 0.0 | | | | 0.0 | | | | 0.1 | | | | 1.7 | | | | 0.8 | |
| Gross margin (loss) (Non-GAAP) | | 34.7 | % | | | 28.6 | % | | | 23.5 | % | | | 23.3 | % | | | 18.8 | % | | | 16.7 | % | | | (89.6 | )% | | | 26.7 | % |
| SOLAREDGE TECHNOLOGIES, INC. |
| RECONCILIATION OF NON-GAAP FINANCIAL MEASURES (Unaudited) |
| (in thousands, except per share data and percentages) |
| |
| | Three months ended | Year ended |
| | September 30, 2026 | | June 30, 2026 | | March 31, 2026 | | December 31, 2025 | | September 30, 2025 | | December 31, 2025 | | December 31, 2024 | | December 31, 2023 |
| Operating expenses (GAAP) | $ | 110,142 | | | $ | 111,198 | | | $ | 123,324 | | | $ | 122,781 | | | $ | 107,293 | | | $ | 497,960 | | | $ | 831,084 | | | $ | 663,618 | |
| Stock-based compensation - R&D | | (9,379 | ) | | | (8,403 | ) | | | (8,061 | ) | | | (8,442 | ) | | | (10,681 | ) | | | (44,890 | ) | | | (62,546 | ) | | | (66,944 | ) |
| Stock-based compensation - S&M | | (4,814 | ) | | | (3,996 | ) | | | (4,151 | ) | | | (4,298 | ) | | | (4,348 | ) | | | (17,730 | ) | | | (27,328 | ) | | | (30,987 | ) |
| Stock-based compensation - G&A | | (5,102 | ) | | | (3,605 | ) | | | (4,033 | ) | | | (3,546 | ) | | | (2,897 | ) | | | (13,903 | ) | | | (25,425 | ) | | | (28,814 | ) |
| Amortization and depreciation of acquired assets - R&D | | — | | | | — | | | | — | | | | — | | | | — | | | | — | | | | (1,000 | ) | | | (989 | ) |
| Amortization and depreciation of acquired assets - S&M | | 50 | | | | (116 | ) | | | (116 | ) | | | (116 | ) | | | (116 | ) | | | (772 | ) | | | (1,599 | ) | | | (927 | ) |
| Amortization and depreciation of acquired assets - G&A | | — | | | | — | | | | — | | | | — | | | | — | | | | — | | | | (6 | ) | | | (15 | ) |
| Amortization of stock-based compensation capitalized in assets | | (111 | ) | | | (109 | ) | | | (110 | ) | | | — | | | | — | | | | — | | | | — | | | | — | |
| Discontinued operation | | 678 | | | | 176 | | | | 556 | | | | (6,989 | ) | | | (316 | ) | | | (35,896 | ) | | | (3,293 | ) | | | (388 | ) |
| Restructuring charges | | 26 | | | | 18 | | | | (371 | ) | | | (423 | ) | | | (426 | ) | | | (4,329 | ) | | | (5,607 | ) | | | — | |
| Assets impairment and disposal by abandonment | | — | | | | (6,646 | ) | | | (970 | ) | | | (3,135 | ) | | | (672 | ) | | | (5,998 | ) | | | (251,823 | ) | | | (30,790 | ) |
| Gain (loss) from assets sales | | (2,649 | ) | | | — | | | | (8,327 | ) | | | (7,117 | ) | | | (158 | ) | | | (23,721 | ) | | | (5,746 | ) | | | 1,262 | |
| Certain litigation and other contingencies | | — | | | | — | | | | — | | | | — | | | | — | | | | — | | | | 399 | | | | (1,786 | ) |
| Acquisition costs | | — | | | | — | | | | — | | | | — | | | | — | | | | — | | | | (9 | ) | | | (135 | ) |
| Operating expenses (Non-GAAP) | $ | 88,841 | | | $ | 88,517 | | | $ | 97,741 | | | $ | 88,715 | | | $ | 87,679 | | | $ | 350,721 | | | $ | 447,101 | | | $ | 503,105 | |
| | | | | | | | | | | | | | | | |
| Operating income (loss) (GAAP) | | (1,907 | ) | | | (16,046 | ) | | | (55,043 | ) | | | (48,310 | ) | | | (35,150 | ) | | | (301,679 | ) | | | (1,708,288 | ) | | | 40,205 | |
| Revenues from finance component | | (661 | ) | | | (572 | ) | | | (498 | ) | | | (456 | ) | | | (351 | ) | | | (1,375 | ) | | | (984 | ) | | | (834 | ) |
| Discontinued operation | | (674 | ) | | | (568 | ) | | | (47 | ) | | | 5,551 | | | | (12,870 | ) | | | 14,668 | | | | 28,214 | | | | 37,036 | |
| Stock-based compensation | | 23,671 | | | | 19,697 | | | | 19,852 | | | | 19,973 | | | | 21,885 | | | | 92,545 | | | | 137,251 | | | | 149,945 | |
| Amortization of stock-based compensation capitalized in inventories | | 314 | | | | 320 | | | | 313 | | | | 613 | | | | 825 | | | | 2,701 | | | | 3,138 | | | | 1,100 | |
| Amortization and depreciation of acquired assets | | 450 | | | | 615 | | | | 616 | | | | 611 | | | | 617 | | | | 2,742 | | | | 8,017 | | | | 7,969 | |
| Amortization of stock-based compensation capitalized in assets | | 111 | | | | 109 | | | | 110 | | | | — | | | | — | | | | — | | | | — | | | | — | |
| Restructuring charges | | (26 | ) | | | (18 | ) | | | 649 | | | | 767 | | | | 457 | | | | 5,144 | | | | 20,934 | | | | 23,154 | |
| Assets impairment and disposal by abandonment | | — | | | | 6,646 | | | | 970 | | | | 3,135 | | | | 672 | | | | 5,998 | | | | 251,823 | | | | 30,790 | |
| Loss (gain) from assets sales | | 2,649 | | | | — | | | | 8,327 | | | | 7,117 | | | | 158 | | | | 23,721 | | | | 5,746 | | | | (1,262 | ) |
| Certain litigation and other contingencies | | — | | | | — | | | | — | | | | — | | | | — | | | | — | | | | (399 | ) | | | 1,786 | |
| Acquisition costs | | — | | | | — | | | | — | | | | — | | | | — | | | | — | | | | 9 | | | | 135 | |
| Operating income (loss) (Non-GAAP) | $ | 23,927 | | | $ | 10,183 | | | $ | (24,751 | ) | | $ | (10,999 | ) | | $ | (23,757 | ) | | $ | (155,535 | ) | | $ | (1,254,539 | ) | | $ | 290,024 | |
| SOLAREDGE TECHNOLOGIES, INC. |
| RECONCILIATION OF NON-GAAP FINANCIAL MEASURES (Unaudited) |
| (in thousands, except per share data and percentages) |
| |
| | Three months ended | Year ended |
| | September 30, 2026 | | June 30, 2026 | | March 31, 2026 | | December 31, 2025 | | September 30, 2025 | | December 31, 2025 | | December 31, 2024 | | December 31, 2023 |
| Financial income (expense), net (GAAP) | $ | (1,952 | ) | | $ | (12,378 | ) | | $ | (1,037 | ) | | $ | (77,784 | ) | | $ | 3,040 | | | $ | (71,999 | ) | | $ | (14,570 | ) | | $ | 41,212 | |
| Non cash interest expense | | 5,385 | | | | 5,208 | | | | 4,793 | | | | 4,420 | | | | 4,462 | | | | 17,259 | | | | 14,877 | | | | 12,703 | |
| Currency fluctuation related to lease standard | | (1,937 | ) | | | 4,382 | | | | (317 | ) | | | 3,360 | | | | 1,552 | | | | 10,430 | | | | (744 | ) | | | (3,055 | ) |
| Discontinued operation | | 964 | | | | (1,613 | ) | | | 3 | | | | 1,402 | | | | (958 | ) | | | 2,433 | | | | — | | | | — | |
| CTA reclassification upon liquidation of a foreign subsidiary | | (459 | ) | | | 20 | | | | 225 | | | | 59,520 | | | | — | | | | 59,520 | | | | — | | | | — | |
| One‑time foreign exchange impact from VAT settlement agreement | | (145 | ) | | | — | | | | (3,900 | ) | | | 10,963 | | | | — | | | | 10,963 | | | | — | | | | — | |
| Financial income (expense), net (Non-GAAP) | $ | 1,856 | | | $ | (4,381 | ) | | $ | (233 | ) | | $ | 1,881 | | | $ | 8,096 | | | $ | 28,606 | | | $ | (437 | ) | | $ | 50,860 | |
| | | | | | | | | | | | | | | | |
| Other income (loss) (GAAP) | $ | — | | | $ | — | | | $ | — | | | $ | (6,582 | ) | | $ | (15,011 | ) | | $ | (17,428 | ) | | $ | 14,547 | | | $ | (318 | ) |
| Loss (gain) from sale of equity and debt investments | | — | | | | — | | | | — | | | | — | | | | — | | | | (2 | ) | | | (2,966 | ) | | | 193 | |
| Gain from business combination | | — | | | | — | | | | — | | | | — | | | | — | | | | — | | | | (1,125 | ) | | | — | |
| Gain from the repurchase of convertible notes | | — | | | | — | | | | — | | | | — | | | | — | | | | (146 | ) | | | (15,456 | ) | | | — | |
| Loss (gain) from sale of private held companies | | — | | | | — | | | | — | | | | 155 | | | | — | | | | (3,862 | ) | | | — | | | | — | |
| Loss from impairment of private held companies | | — | | | | — | | | | — | | | | 6,427 | | | | 15,011 | | | | 21,438 | | | | 5,000 | | | | — | |
| Other income (loss) (Non-GAAP) | $ | — | | | $ | — | | | $ | — | | | $ | — | | | $ | — | | | $ | — | | | $ | — | | | $ | (125 | ) |
| | | | | | | | | | | | | | | | |
| Income tax benefit (expense) (GAAP) | $ | (4,526 | ) | | $ | (2,329 | ) | | $ | (1,286 | ) | | $ | 564 | | | $ | (2,563 | ) | | $ | (13,382 | ) | | $ | (96,150 | ) | | $ | (46,420 | ) |
| Income tax adjustment | | (187 | ) | | | 105 | | | | (15 | ) | | | 389 | | | | (124 | ) | | | 10 | | | | 39,007 | | | | (45,896 | ) |
| Income tax benefit (expense) (Non-GAAP) | $ | (4,713 | ) | | $ | (2,224 | ) | | $ | (1,301 | ) | | $ | 953 | | | $ | (2,687 | ) | | $ | (13,372 | ) | | $ | (57,143 | ) | | $ | (92,316 | ) |
| | | | | | | | | | | | | | | | |
| Equity method investments income (loss) (GAAP) | $ | — | | | $ | — | | | $ | — | | | $ | (9 | ) | | $ | (376 | ) | | $ | (960 | ) | | $ | (1,896 | ) | | $ | (350 | ) |
| Loss from equity method investments | | — | | | | — | | | | — | | | | 9 | | | | 376 | | | | 960 | | | | 1,896 | | | | 350 | |
| Equity method investments income (loss) (Non-GAAP) | $ | — | | | $ | — | | | $ | — | | | $ | — | | | $ | — | | | $ | — | | | $ | — | | | $ | — | |
| SOLAREDGE TECHNOLOGIES, INC. |
| RECONCILIATION OF NON-GAAP FINANCIAL MEASURES (Unaudited) |
| (in thousands, except per share data and percentages) |
| |
| | Three months ended | Year ended |
| | September 30, 2026 | | June 30, 2026 | | March 31, 2026 | | December 31, 2025 | | September 30, 2025 | | December 31, 2025 | | December 31, 2024 | | December 31, 2023 |
| Net income (loss) (GAAP) | $ | (8,385 | ) | | $ | (30,753 | ) | | $ | (57,366 | ) | | $ | (132,121 | ) | | $ | (50,060 | ) | | $ | (405,448 | ) | | $ | (1,806,357 | ) | | $ | 34,329 | |
| Revenues from finance component | | (661 | ) | | | (572 | ) | | | (498 | ) | | | (456 | ) | | | (351 | ) | | | (1,375 | ) | | | (984 | ) | | | (834 | ) |
| Discontinued operation | | 290 | | | | (2,181 | ) | | | (44 | ) | | | 6,953 | | | | (13,828 | ) | | | 17,101 | | | | 28,214 | | | | 37,036 | |
| Stock-based compensation | | 23,671 | | | | 19,697 | | | | 19,852 | | | | 19,973 | | | | 21,885 | | | | 92,545 | | | | 137,251 | | | | 149,945 | |
| Amortization of stock-based compensation capitalized in inventories | | 314 | | | | 320 | | | | 313 | | | | 613 | | | | 825 | | | | 2,701 | | | | 3,138 | | | | 1,100 | |
| Amortization and depreciation of acquired assets | | 450 | | | | 615 | | | | 616 | | | | 611 | | | | 617 | | | | 2,742 | | | | 8,017 | | | | 7,969 | |
| Amortization of stock-based compensation capitalized in assets | | 111 | | | | 109 | | | | 110 | | | | — | | | | — | | | | — | | | | — | | | | — | |
| Restructuring charges | | (26 | ) | | | (18 | ) | | | 649 | | | | 767 | | | | 457 | | | | 5,144 | | | | 20,934 | | | | 23,154 | |
| Assets impairment and disposal by abandonment | | — | | | | 6,646 | | | | 970 | | | | 3,135 | | | | 672 | | | | 5,998 | | | | 251,823 | | | | 30,790 | |
| Loss (gain) from assets sales | | 2,649 | | | | — | | | | 8,327 | | | | 7,117 | | | | 158 | | | | 23,721 | | | | 5,746 | | | | (1,262 | ) |
| Certain litigation and other contingencies | | — | | | | — | | | | — | | | | — | | | | — | | | | — | | | | (399 | ) | | | 1,786 | |
| Acquisition costs | | — | | | | — | | | | — | | | | — | | | | — | | | | — | | | | 9 | | | | 135 | |
| Non cash interest expense | | 5,385 | | | | 5,208 | | | | 4,793 | | | | 4,420 | | | | 4,462 | | | | 17,259 | | | | 14,877 | | | | 12,703 | |
| CTA reclassification upon liquidation of a foreign subsidiary | | (459 | ) | | | 20 | | | | 225 | | | | 59,520 | | | | — | | | | 59,520 | | | | — | | | | — | |
| One‑time foreign exchange impact from VAT settlement agreement | | (145 | ) | | | — | | | | (3,900 | ) | | | 10,963 | | | | — | | | | 10,963 | | | | — | | | | — | |
| Currency fluctuation related to lease standard | | (1,937 | ) | | | 4,382 | | | | (317 | ) | | | 3,360 | | | | 1,552 | | | | 10,430 | | | | (744 | ) | | | (3,055 | ) |
| Loss (gain) from sale of equity and debt investments | | — | | | | — | | | | — | | | | — | | | | — | | | | (2 | ) | | | (2,966 | ) | | | 193 | |
| Gain from business combination | | — | | | | — | | | | — | | | | — | | | | — | | | | — | | | | (1,125 | ) | | | — | |
| Gain from the repurchase of convertible notes | | — | | | | — | | | | — | | | | — | | | | — | | | | (146 | ) | | | (15,456 | ) | | | — | |
| Loss (gain) from sale of private held companies | | — | | | | — | | | | — | | | | 155 | | | | — | | | | (3,862 | ) | | | — | | | | — | |
| Loss from impairment of private held companies | | — | | | | — | | | | — | | | | 6,427 | | | | 15,011 | | | | 21,438 | | | | 5,000 | | | | — | |
| Income tax adjustment | | (187 | ) | | | 105 | | | | (15 | ) | | | 389 | | | | (124 | ) | | | 10 | | | | 39,007 | | | | (45,896 | ) |
| Equity method adjustments | | — | | | | — | | | | — | | | | 9 | | | | 376 | | | | 960 | | | | 1,896 | | | | 350 | |
| Net income (loss) (Non-GAAP) | $ | 21,070 | | | $ | 3,578 | | | $ | (26,285 | ) | | $ | (8,165 | ) | | $ | (18,348 | ) | | $ | (140,301 | ) | | $ | (1,312,119 | ) | | $ | 248,443 | |
| SOLAREDGE TECHNOLOGIES, INC. |
| RECONCILIATION OF NON-GAAP FINANCIAL MEASURES (Unaudited) |
| (in thousands, except per share data and percentages) |
| |
| | Three months ended | Year ended |
| | September 30, 2026 | | June 30, 2026 | | March 31, 2026 | | December 31, 2025 | | September 30, 2025 | | December 31, 2025 | | December 31, 2024 | | December 31, 2023 |
| Net basic earnings (loss) per share (GAAP) | $ | (0.14 | ) | | $ | (0.50 | ) | | $ | (0.95 | ) | | $ | (2.21 | ) | | $ | (0.84 | ) | | $ | (6.88 | ) | | $ | (31.64 | ) | | $ | 0.61 | |
| Revenues from finance component | | (0.01 | ) | | | (0.01 | ) | | | (0.01 | ) | | | (0.01 | ) | | | (0.01 | ) | | | (0.02 | ) | | | (0.02 | ) | | | (0.02 | ) |
| Discontinued operation | | 0.00 | | | | (0.04 | ) | | | 0.00 | | | | 0.12 | | | | (0.23 | ) | | | 0.29 | | | | 0.49 | | | | 0.66 | |
| Stock-based compensation | | 0.38 | | | | 0.32 | | | | 0.33 | | | | 0.33 | | | | 0.37 | | | | 1.57 | | | | 2.41 | | | | 2.65 | |
| Amortization of stock-based compensation capitalized in inventories | | 0.01 | | | | 0.01 | | | | 0.01 | | | | 0.01 | | | | 0.01 | | | | 0.05 | | | | 0.05 | | | | 0.02 | |
| Amortization and depreciation of acquired assets | | 0.01 | | | | 0.01 | | | | 0.01 | | | | 0.01 | | | | 0.01 | | | | 0.04 | | | | 0.14 | | | | 0.14 | |
| Amortization of stock-based compensation capitalized in assets | | 0.00 | | | | 0.00 | | | | 0.00 | | | | — | | | | — | | | | — | | | | — | | | | — | |
| Restructuring charges | | 0.00 | | | | 0.00 | | | | 0.01 | | | | 0.02 | | | | 0.01 | | | | 0.09 | | | | 0.37 | | | | 0.41 | |
| Assets impairment and disposal by abandonment | | — | | | | 0.11 | | | | 0.02 | | | | 0.05 | | | | 0.01 | | | | 0.10 | | | | 4.41 | | | | 0.54 | |
| Loss (gain) from assets sales | | 0.04 | | | | — | | | | 0.14 | | | | 0.12 | | | | 0.00 | | | | 0.40 | | | | 0.10 | | | | (0.02 | ) |
| Certain litigation and other contingencies | | — | | | | — | | | | — | | | | — | | | | — | | | | — | | | | (0.01 | ) | | | 0.03 | |
| Acquisition costs | | — | | | | — | | | | — | | | | — | | | | — | | | | — | | | | 0.00 | | | | 0.00 | |
| Non cash interest expense | | 0.09 | | | | 0.09 | | | | 0.08 | | | | 0.07 | | | | 0.08 | | | | 0.30 | | | | 0.26 | | | | 0.23 | |
| CTA reclassification upon liquidation of a foreign subsidiary | | (0.01 | ) | | | 0.00 | | | | 0.00 | | | | 1.00 | | | | — | | | | 1.01 | | | | — | | | | — | |
| One‑time foreign exchange impact from VAT settlement agreement | | 0.00 | | | | — | | | | (0.06 | ) | | | 0.18 | | | | — | | | | 0.18 | | | | — | | | | — | |
| Currency fluctuation related to lease standard | | (0.03 | ) | | | 0.07 | | | | (0.01 | ) | | | 0.06 | | | | 0.02 | | | | 0.18 | | | | (0.01 | ) | | | (0.06 | ) |
| Loss (gain) from sale of equity and debt investments | | — | | | | — | | | | — | | | | — | | | | — | | | | 0.00 | | | | (0.05 | ) | | | 0.01 | |
| Gain from business combination | | — | | | | — | | | | — | | | | — | | | | — | | | | — | | | | (0.02 | ) | | | — | |
| Gain from the repurchase of convertible notes | | — | | | | — | | | | — | | | | — | | | | — | | | | 0.00 | | | | (0.27 | ) | | | — | |
| Loss (gain) from sale of private held companies | | — | | | | — | | | | — | | | | 0.00 | | | | — | | | | (0.07 | ) | | | — | | | | — | |
| Loss from impairment of private held companies | | — | | | | — | | | | — | | | | 0.11 | | | | 0.26 | | | | 0.36 | | | | 0.09 | | | | — | |
| Income tax adjustment | | 0.00 | | | | 0.00 | | | | 0.00 | | | | 0.00 | | | | (0.01 | ) | | | 0.00 | | | | 0.68 | | | | (0.81 | ) |
| Equity method adjustments | | — | | | | — | | | | — | | | | 0.00 | | | | 0.01 | | | | 0.02 | | | | 0.03 | | | | 0.00 | |
| Net basic earnings (loss) per share (Non-GAAP) | $ | 0.34 | | | $ | 0.06 | | | $ | (0.43 | ) | | $ | (0.14 | ) | | $ | (0.31 | ) | | $ | (2.38 | ) | | $ | (22.99 | ) | | $ | 4.39 | |
| SOLAREDGE TECHNOLOGIES, INC. |
| RECONCILIATION OF NON-GAAP FINANCIAL MEASURES (Unaudited) |
| (in thousands, except per share data and percentages) |
| |
| | Three months ended | | Year ended |
| | September 30, 2026 | | June 30, 2026 | | March 31, 2026 | | December 31, 2025 | | September 30, 2025 | | December 31, 2025 | | December 31, 2024 | | December 31, 2023 |
| Net diluted earnings (loss) per share (GAAP) | $ | (0.14 | ) | | $ | (0.50 | ) | | $ | (0.95 | ) | | $ | (2.21 | ) | | $ | (0.84 | ) | | $ | (6.88 | ) | | $ | (31.64 | ) | | $ | 0.60 | |
| Revenues from finance component | | 0.02 | | | | (0.01 | ) | | | (0.01 | ) | | | (0.01 | ) | | | (0.01 | ) | | | (0.02 | ) | | | (0.02 | ) | | | (0.01 | ) |
| Discontinued operation | | 0.00 | | | | (0.04 | ) | | | 0.00 | | | | 0.12 | | | | (0.23 | ) | | | 0.29 | | | | 0.49 | | | | 0.64 | |
| Stock-based compensation | | 0.37 | | | | 0.34 | | | | 0.33 | | | | 0.33 | | | | 0.37 | | | | 1.57 | | | | 2.41 | | | | 2.57 | |
| Amortization of stock-based compensation capitalized in inventories | | 0.00 | | | | 0.01 | | | | 0.01 | | | | 0.01 | | | | 0.01 | | | | 0.05 | | | | 0.05 | | | | 0.02 | |
| Amortization and depreciation of acquired assets | | 0.01 | | | | 0.00 | | | | 0.01 | | | | 0.01 | | | | 0.01 | | | | 0.04 | | | | 0.14 | | | | 0.14 | |
| Amortization of stock-based compensation capitalized in assets | | 0.00 | | | | 0.01 | | | | 0.00 | | | | — | | | | — | | | | — | | | | — | | | | — | |
| Restructuring charges | | 0.00 | | | | 0.00 | | | | 0.01 | | | | 0.02 | | | | 0.01 | | | | 0.09 | | | | 0.37 | | | | 0.40 | |
| Assets impairment and disposal by abandonment | | — | | | | 0.10 | | | | 0.02 | | | | 0.05 | | | | 0.01 | | | | 0.10 | | | | 4.41 | | | | 0.53 | |
| Loss (gain) from assets sales | | 0.04 | | | | — | | | | 0.14 | | | | 0.12 | | | | 0.00 | | | | 0.40 | | | | 0.10 | | | | (0.02 | ) |
| Certain litigation and other contingencies | | — | | | | — | | | | — | | | | — | | | | — | | | | — | | | | (0.01 | ) | | | 0.03 | |
| Acquisition costs | | — | | | | — | | | | — | | | | — | | | | — | | | | — | | | | 0.00 | | | | 0.00 | |
| Non cash interest expense | | 0.03 | | | | 0.08 | | | | 0.08 | | | | 0.07 | | | | 0.08 | | | | 0.30 | | | | 0.26 | | | | 0.03 | |
| CTA reclassification upon liquidation of a foreign subsidiary | | (0.01 | ) | | | 0.00 | | | | 0.00 | | | | 1.00 | | | | — | | | | 1.01 | | | | — | | | | — | |
| One‑time foreign exchange impact from VAT settlement agreement | | 0.00 | | | | — | | | | (0.06 | ) | | | 0.18 | | | | — | | | | 0.18 | | | | — | | | | — | |
| Currency fluctuation related to lease standard | | (0.02 | ) | | | 0.06 | | | | (0.01 | ) | | | 0.06 | | | | 0.02 | | | | 0.18 | | | | (0.01 | ) | | | (0.05 | ) |
| Loss (gain) from sale of equity and debt investments | | — | | | | — | | | | — | | | | — | | | | — | | | | 0.00 | | | | (0.05 | ) | | | 0.00 | |
| Gain from business combination | | — | | | | — | | | | — | | | | — | | | | — | | | | — | | | | (0.02 | ) | | | — | |
| Gain from the repurchase of convertible notes | | — | | | | — | | | | 0.00 | | | | — | | | | — | | | | 0.00 | | | | (0.27 | ) | | | — | |
| Loss (gain) from sale of private held companies | | — | | | | — | | | | — | | | | 0.00 | | | | — | | | | (0.07 | ) | | | — | | | | — | |
| Loss from impairment of private held companies | | — | | | | — | | | | — | | | | 0.11 | | | | 0.26 | | | | 0.36 | | | | 0.09 | | | | — | |
| Income tax adjustment | | (0.01 | ) | | | 0.00 | | | | 0.00 | | | | 0.00 | | | | (0.01 | ) | | | 0.00 | | | | 0.68 | | | | (0.76 | ) |
| Equity method adjustments | | — | | | | — | | | | — | | | | 0.00 | | | | 0.01 | | | | 0.02 | | | | 0.03 | | | | 0.00 | |
| Net diluted earnings (loss) per share (Non-GAAP) | $ | 0.29 | | | $ | 0.05 | | | $ | (0.43 | ) | | $ | (0.14 | ) | | $ | (0.31 | ) | | $ | (2.38 | ) | | $ | (22.99 | ) | | $ | 4.12 | |
| SOLAREDGE TECHNOLOGIES, INC. |
| RECONCILIATION OF NON-GAAP FINANCIAL MEASURES (Unaudited) |
| (in thousands, except per share data and percentages) |
| |
| | Three months ended | | Year ended |
| | September 30, 2026 | | June 30, 2026 | | March 31, 2026 | | December 31, 2025 | | September 30, 2025 | | December 31, 2025 | | December 31, 2024 | | December 31, 2023 |
| Number of shares used in computing net diluted earnings (loss) per share (GAAP) | | 61,652,745 | | | | 61,045,194 | | | | 60,517,248 | | | | 59,828,042 | | | | 59,278,269 | | | | 58,954,380 | | | | 57,082,182 | | | | 57,237,518 | |
| Stock-based compensation | | 5,017,672 | | | | 4,772,503 | | | | — | | | | — | | | | — | | | | — | | | | — | | | | 725,859 | |
| Notes due 2025 | | — | | | | — | | | | — | | | | — | | | | — | | | | — | | | | — | | | | 2,276,818 | |
| Notes due 2029 | | 9,819,347 | | | | — | | | | — | | | | — | | | | — | | | | — | | | | — | | | | — | |
| Number of shares used in computing net diluted earnings (loss) per share (Non-GAAP) | | 76,489,764 | | | | 65,817,697 | | | | 60,517,248 | | | | 59,828,042 | | | | 59,278,269 | | | | 58,954,380 | | | | 57,082,182 | | | | 60,240,195 | |
| | | | | | | | | | | | | | | | |
| Net cash provided by (used in) operating activities (GAAP) | $ | 20,387 | | | $ | 11,416 | | | $ | 24,428 | | | $ | 52,629 | | | $ | 25,608 | | | $ | 104,261 | | | $ | (313,319 | ) | | $ | (180,113 | ) |
| Purchases of property and equipment | | (12,567 | ) | | | (8,282 | ) | | | (3,701 | ) | | | (9,293 | ) | | | (2,809 | ) | | | (23,467 | ) | | | (108,163 | ) | | | (170,523 | ) |
| Discontinued operation | | — | | | | — | | | | — | | | | — | | | | — | | | | (3,867 | ) | | | — | | | | — | |
| Free cash flow (deficit) (Non-GAAP) | $ | 7,820 | | | $ | 3,134 | | | $ | 20,727 | | | $ | 43,336 | | | $ | 22,799 | | | $ | 76,927 | | | $ | (421,482 | ) | | $ | (350,636 | ) |
| | | | | | | | | | | | | | | | |
| Operating income (loss) (Non-GAAP) | $ | 23,927 | | | $ | 10,183 | | | $ | (24,751 | ) | | $ | (10,999 | ) | | $ | (23,757 | ) | | $ | (155,535 | ) | | $ | (1,254,539 | ) | | $ | 290,024 | |
| Excluding: Depreciation | | 7,825 | | | | 8,068 | | | | 7,488 | | | | 8,840 | | | | 9,671 | | | | 36,911 | | | | 51,966 | | | | 49,544 | |
| Adjusted EBITDA (Non-GAAP) | $ | 31,752 | | | $ | 18,251 | | | $ | (17,263 | ) | | $ | (2,159 | ) | | $ | (14,086 | ) | | $ | (118,624 | ) | | $ | (1,202,573 | ) | | $ | 339,568 | |
View source version on businesswire.com: https://www.businesswire.com/news/home/20261104002934/en/
Investor Contacts SolarEdge Technologies, Inc. Jeff Osborne, Head of Investor Relations [email protected]
Sapphire Investor Relations, LLC Erica Mannion and Michael Funari [email protected]
Source: SolarEdge Technologies, Inc.
Stay Informed
Don't want to miss any events or news? Subscribe today!