13 Sep 2026](https://www.sabre.com/resources/research/the-fog/) ### Trending [All resources](https://www.sabre.com/resources/ "All resources") [\ \ ####…
13 Sep 2026](https://www.sabre.com/resources/research/the-fog/)
### Trending
[All resources](https://www.sabre.com/resources/ "All resources")
[\
\
#### Secure AI isn't a feature. It's a foundation\
\
28 Jan 2026](https://www.sabre.com/resources/research/the-secure-ai-advantage/)
[\
\
#### Agentic AI in travel, from theory to reality\
\
02 Dec 2025](https://www.sabre.com/resources/research/the-agentic-blueprint/)
[\
\
#### Why agentic AI will reshape travel\
\
16 Oct 2025](https://www.sabre.com/resources/research/chat-as-the-new-influencer/)
[\
\
#### Do direct connects deliver what they promise?\
\
18 Sep 2025](https://www.sabre.com/resources/research/direct-connects-vs-marketplaces/)
### Featured
[\
\
#### The fog is real. So is the path through it\
\
13 Sep 2026](https://www.sabre.com/resources/research/the-fog/)
### Trending
[All research and whitepapers](https://www.sabre.com/resources/research "All research and whitepapers")
[\
\
#### Secure AI isn't a feature. It's a foundation.\
\
28 Jan 2026](https://www.sabre.com/resources/research/the-secure-ai-advantage/)
[\
\
#### Agentic AI in travel, from theory to reality\
\
02 Dec 2025](https://www.sabre.com/resources/research/the-agentic-blueprint/)
[\
\
#### More content. Less control.\
\
21 Jul 2025](https://www.sabre.com/resources/research/content-fragmentation-what-i-see-vs-what-i-take/)
[\
\
#### Do direct connects deliver what they promise?\
\
18 Sep 2025](https://www.sabre.com/resources/research/direct-connects-vs-marketplaces/)
### Featured
[\
\
#### Airlines voted. Sabre won\
\
08 Apr 2026](https://www.sabre.com/resources/viewpoints/sabre-iata-consortium-modularity/)
### Trending
[All viewpoints](https://www.sabre.com/resources/viewpoints "All viewpoints")
[\
\
#### He's called every tech shift right. Here's his AI warning.\
\
25 Aug 2026](https://www.sabre.com/resources/viewpoints/what-the-industry-is-missing-today/)
[\
\
#### The lodging revenue hiding in plain sight\
\
18 Feb 2026](https://www.sabre.com/resources/viewpoints/hotel-attachment-rate/)
[\
\
#### Offer. Order. Now deliver\
\
18 Feb 2026](https://www.sabre.com/resources/viewpoints/delivery-management-article/)
[\
\
#### Offer and order: From strategy to scale\
\
24 Feb 2026](https://www.sabre.com/resources/viewpoints/offer-and-order-from-strategy-to-scale/)
### Visit newsroom
[Newsroom](https://www.sabre.com/resources/newsroom "Newsroom")
### Featured
[\
\
#### Virgin Australia: From legacy system to modern airline\
\
16 Feb 2025](https://www.sabre.com/resources/airline-case-studies/virgin-australia/)
### Trending
[All airline case studies](https://www.sabre.com/resources/airline-case-studies "All airline case studies")
[\
\
#### Riyadh Air: Building the world’s first digital-native airline\
\
16 Feb 2025](https://www.sabre.com/resources/airline-case-studies/riyadh-air/)
[\
\
#### Air India Express: Smarter scheduling for a fast-growing fleet\
\
02 Oct 2025](https://www.sabre.com/resources/airline-case-studies/air-india-express/)
[\
\
#### LATAM shapes every fare around the traveler\
\
02 Oct 2025](https://www.sabre.com/resources/airline-case-studies/latam/)
### Featured
[\
\
#### ISON Travel: Fivefold growth. One intelligent platform\
\
16 Feb 2026](https://www.sabre.com/resources/agency-case-studies/ison-travel/)
### Trending
[All agency case studies](https://www.sabre.com/resources/agency-case-studies "All agency case studies")
[\
\
#### Direct Travel: AI that turns complexity into experience\
\
16 Feb 2026](https://www.sabre.com/resources/agency-case-studies/direct-travel/)
[\
\
#### Duluth Travel: High-stakes migration. Zero disruption\
\
16 Feb 2026](https://www.sabre.com/resources/agency-case-studies/duluth-travel/)
[\
\
#### JTP Business Travel: The partner behind JTB’s global growth\
\
20 Jan 2026](https://www.sabre.com/resources/agency-case-studies/jtb-business-travel/)
### The latest content available to book

Access everything, offer anything in the Sabre Mosaic Marketplace

[Content roundup](https://www.sabre.com/content-roundup/ "Content roundup")
-
Company
Company
About us
Technology that takes you where you want to go.
About us
Why Sabre
One intelligent platform. Open, modular, AI-powered and built around your success
Why Sabre
Executive leadership
The executives focused on your success
Meet the team
News & press
Company announcements, press releases, and industry updates
Explore latest
Locations
Global office locations and partner contacts across every region
Locations
Investors
Financial reports, SEC filings, governance details, and investor resources.
Investors
Sustainability
Sustainability reports, key metrics, and our commitment to responsible travel.
Sustainability
Get In touch
Search by keyword
Get In touch
Products
Sabre Mosaic for airlines
Open, modular, AI-powered. Deploy what you need, scale at your pace.
Explore Mosaic
Explore more
[
\
Experience Suite\
Build loyalty at every touchpoint](https://www.sabre.com/airline-mosaic/experience-suite/)
[
\
Retail Suite\
Sell more. Retail without restrictions](https://www.sabre.com/airline-mosaic/retail-suite/)
[
\
Payment Suite\
Protect margins and capture more revenue](https://www.sabre.com/airline-mosaic/payment-suite/)
Products
[
\
Service Suite\
One record. Every team and channel aligned](https://www.sabre.com/airline-mosaic/service-suite/)
[
\
Insight Suite\
Turn travel data into revenue decisions](https://www.sabre.com/airline-mosaic/insight-suite/)
Airline Developers
Agentic APIs, modular components, and enterprise infrastructure. Build without lock-in
Build with Sabre
Developer resources
Sabre Mosaic for agencies
A unified, intelligent platform that drives profitable growth across every booking.
Explore Mosaic
Explore more
[
\
Experience Suite\
One consistent experience, every channel](https://www.sabre.com/agency-mosaic/experience-suite/)
[
\
Retail Suite\
The fastest path from search to sold](https://www.sabre.com/agency-mosaic/retail-suite/)
[
\
Payment Suite\
Turn payments into a revenue stream](https://www.sabre.com/agency-mosaic/payment-suite/)
Products
[
\
Service Suite\
Post-booking you can count on](https://www.sabre.com/agency-mosaic/service-suite/)
[
\
Insight Suite\
Intelligence for smarter decisions](https://www.sabre.com/agency-mosaic/insight-suite/)
Agency Developers
Modern APIs, intelligent cache, and unified workflows. Build smarter agency apps faster.
Build with Sabre
Developer resources
Travel suppliers
Connect to high-value demand through a unified, global marketplace.
Explore Sabre Mosaic
Explore more
Our single platform
Open, modular, AI-native. Five suites that work together or stand alone.
Explore Sabre Mosaic

Industries
Airlines
Build the retailing future you want, without vendor lock-in.
Airlines
Explore more
Corporate travel buyers
The best rates and content, with full visibility and none of the complexity.
Corporate travel buyers
Explore more
Hoteliers
Reach the travelers who spend the most, across 190+ countries.
Hoteliers
Explore more
Leisure agencies
AI-powered software and content tools that help your agency grow
Leisure agencies
Explore more
Online travel agencies
Convert high-volume searches into high-margin bookings
Online travel agencies
Explore more
Travel management companies
The world's #1 AI-powered platform for Travel management companies.
Travel management companies
Explore more
Travel suppliers
Sell more to every traveler you reach.
Travel suppliers
Explore more
AI
Sabre IQ
AI trained on 50PB+ of travel demand signals to optimize revenue, automate operations, and enable agentic workflows.
Sabre IQ
Explore more
Building the complete trip
Sabre opened up its platform to Silicon Valley, challenging 400 developers to unify trip booking
Learn more
Explore more
Resources
Featured
[
\
The fog is real. So is the path through it\
13 Sep 2026](https://www.sabre.com/resources/research/the-fog/)
Trending
All resources
[
\
Secure AI isn't a feature. It's a foundation\
28 Jan 2026](https://www.sabre.com/resources/research/the-secure-ai-advantage/)
[
\
Agentic AI in travel, from theory to reality\
02 Dec 2025](https://www.sabre.com/resources/research/the-agentic-blueprint/)
[
\
Why agentic AI will reshape travel\
16 Oct 2025](https://www.sabre.com/resources/research/chat-as-the-new-influencer/)
[
\
Do direct connects deliver what they promise?\
18 Sep 2025](https://www.sabre.com/resources/research/direct-connects-vs-marketplaces/)
Featured
[
\
The fog is real. So is the path through it\
13 Sep 2026](https://www.sabre.com/resources/research/the-fog/)
Trending
All research and whitepapers
[
\
Secure AI isn't a feature. It's a foundation.\
28 Jan 2026](https://www.sabre.com/resources/research/the-secure-ai-advantage/)
[
\
Agentic AI in travel, from theory to reality\
02 Dec 2025](https://www.sabre.com/resources/research/the-agentic-blueprint/)
[
\
More content. Less control.\
21 Jul 2025](https://www.sabre.com/resources/research/content-fragmentation-what-i-see-vs-what-i-take/)
[
\
Do direct connects deliver what they promise?\
18 Sep 2025](https://www.sabre.com/resources/research/direct-connects-vs-marketplaces/)
Featured
[
\
Airlines voted. Sabre won\
08 Apr 2026](https://www.sabre.com/resources/viewpoints/sabre-iata-consortium-modularity/)
Trending
All viewpoints
[
\
He's called every tech shift right. Here's his AI warning.\
25 Aug 2026](https://www.sabre.com/resources/viewpoints/what-the-industry-is-missing-today/)
[
\
The lodging revenue hiding in plain sight\
18 Feb 2026](https://www.sabre.com/resources/viewpoints/hotel-attachment-rate/)
[
\
Offer. Order. Now deliver\
18 Feb 2026](https://www.sabre.com/resources/viewpoints/delivery-management-article/)
[
\
Offer and order: From strategy to scale\
24 Feb 2026](https://www.sabre.com/resources/viewpoints/offer-and-order-from-strategy-to-scale/)
Visit newsroom
Newsroom
Featured
[
\
Virgin Australia: From legacy system to modern airline\
16 Feb 2025](https://www.sabre.com/resources/airline-case-studies/virgin-australia/)
Trending
All airline case studies
[
\
Riyadh Air: Building the world’s first digital-native airline\
16 Feb 2025](https://www.sabre.com/resources/airline-case-studies/riyadh-air/)
[
\
Air India Express: Smarter scheduling for a fast-growing fleet\
02 Oct 2025](https://www.sabre.com/resources/airline-case-studies/air-india-express/)
[
\
LATAM shapes every fare around the traveler\
02 Oct 2025](https://www.sabre.com/resources/airline-case-studies/latam/)
Featured
[
\
ISON Travel: Fivefold growth. One intelligent platform\
16 Feb 2026](https://www.sabre.com/resources/agency-case-studies/ison-travel/)
Trending
All agency case studies
[
\
Direct Travel: AI that turns complexity into experience\
16 Feb 2026](https://www.sabre.com/resources/agency-case-studies/direct-travel/)
[
\
Duluth Travel: High-stakes migration. Zero disruption\
16 Feb 2026](https://www.sabre.com/resources/agency-case-studies/duluth-travel/)
[
\
JTP Business Travel: The partner behind JTB’s global growth\
20 Jan 2026](https://www.sabre.com/resources/agency-case-studies/jtb-business-travel/)
The latest content available to book
Access everything, offer anything in the Sabre Mosaic Marketplace
Content roundup
Company
About us
Technology that takes you where you want to go.
About us
Why Sabre
One intelligent platform. Open, modular, AI-powered and built around your success
Why Sabre
Executive leadership
The executives focused on your success
Meet the team
News & press
Company announcements, press releases, and industry updates
Explore latest
Locations
Global office locations and partner contacts across every region
Locations
Investors
Financial reports, SEC filings, governance details, and investor resources.
Investors
Sustainability
Sustainability reports, key metrics, and our commitment to responsible travel.
Sustainability
Navigating
The
Fog
How the travel industry is holding the line, finding its footing, and making its next moves in an uncertain, fast-moving macroenvironment.
Foreword
A note on the impetus of this Compass report

The travel industry has learned to operate in uncertainty. Trade disruptions, demand swings, cost inflation that rarely compresses as quickly as it spikes, a consumer whose confidence is measured week to week rather than quarter to quarter. None of this is entirely new.
What is new is the simultaneity of it: the same period that demands financial caution also demands bold investment in AI and modern retailing architecture. Most executives Sabre surveyed for this report are operating, planning, and moving. But they are doing so with narrower margins for error and technology modernization programs that cannot slow down simply because the macro environment has become more complicated.
A compass does not tell you the weather will improve. It tells you where you are and which direction is north. What follows is not Sabre’s economic prediction. We invited Cantor Fitzgerald to synthesize macro research for our partners, grounded it in a third-party industry study we commissioned for this report, and connected those sources honestly to the operational reality of running an airline, an agency, or a hotel right now. We have also included a short set of practical recommendations: low-effort moves that generate incremental revenue without waiting for the macro environment to improve.
Whether it’s the current geopolitical and macroeconomic fog or the next headwind, we’ve learned how to build resilience. The intent throughout is to help navigate while seizing current opportunities.
“Thecompaniesthatcomeoutaheadwon’tbetheonesthatwaitedforthefogtolift.They’llbetheonesthatlearnedtomoveconfidentlyinsideit.”

Shawn Williams, Sabre COO
This Compass report brings
together three perspectives:
1. The macroeconomic view
2. Industry sentiment
3. Five moves to make now
I The macroeconomic view
A Cantor Fitzgerald analysis of the current geopolitical impact on the macro-environment
Read on
Learn more about the link
II Industry sentiment
Sabre proprietary voice of customer research into how travel executives are responding to current conditions
Explore research
Learn more about the link
III Five moves to make now
A set of specific, near-term revenue moves available to airlines and agencies right now
Boost Revenues
Learn more about the link
PART I
The macroeconomic view
Introduction: Assessing the current weather
The aggregate numbers tell one story. Global passenger volumes recovering, hotel occupancy holding, corporate travel spend returning toward pre-pandemic levels. The conditions beneath those aggregates tell a more complicated one, and it is the conditions beneath the aggregates that determine how the next twelve months actually perform for the industry at large.
Consumer confidence sits near historic lows even as equity markets trade at historic highs (Bloomberg, via Cantor Fitzgerald, July 2026). That divergence is not uniform across travel. The asset-holding traveler continues to spend. The confidence-constrained traveler books later, cancels more readily, and compresses the lead times that yield management depends on.
The commercial relationships that underpin managed corporate travel are under separate but related pressure. Trade tensions do not primarily affect travel through logistics. They affect it through demand: when commercial activity across borders is disrupted, the programs that exist to support it compress. And history suggests that compression happens quickly.
Two forces are running simultaneously through all of this. The first is macroeconomic and geopolitical. The second is the transition to agentic AI, which is not waiting for the macro environment to stabilize before demanding a response. The interaction between the two is what this report addresses with the goal of helping to guide Sabre partners with insights and perspectives to make informed decisions.
A note on the macroeconomic analysis in this report
The sections that follow on geopolitical disruption, inflation, and monetary policy uncertainty do not represent Sabre’s economic forecast. We are a travel technology company; macroeconomic strategy is not our lane, and we would not ask you to take our word on conditions that require a different kind of expertise.
For that analysis, we turned to Eric Johnston, Senior Managing Director and Chief Equity and Macro Strategist at Cantor Fitzgerald. Johnston’s equity and macro research is among the most cited independent voices in institutional strategy, and we are grateful he agreed to share his perspective with Sabre’s partners. What follows draws directly on his July 2026 analysis, prepared by Cantor Fitzgerald and Co.
His view, in summary, is this. Three forces are currently driving economic activity: the AI data center buildout, the fiscal stimulus effect of recent US legislative activity, and a wealth effect that has pushed household net worth well above its long-run trend. Retail sales remain strong. At the same time, prices are far above their long-run trend line, and while Johnston believes inflation has now peaked, monetary policy is tightening in response: U.S. Fed fund futures are pricing a 100 percent probability of a rate hike, a position that sat at zero just three months ago.
The travel implications of those conditions may be significant and uneven. They are explored in full below.
The Cantor Fitzgerald analysis referenced throughout this report is sales and trading commentary prepared for institutional investors. It is not a research report and should not be treated as investment advice. Full attribution and source details appear throughout.
The macroeconomic view: analysis by Eric Johnston, Cantor Fitzgerald
Eric Johnston is Senior Managing Director and Chief Equity and Macro Strategist at Cantor Fitzgerald, one of the leading independent voices in institutional equity and macro research. The analysis below draws on his July 2026 report. All findings and conclusions are Johnston’s own. The travel implications that follow each section represent Sabre’s reading of that analysis, not Cantor’s.
What is driving the economy right now?
AI capital expenditure
Johnston identified three forces currently sustaining US economic activity. The first is AI capital expenditure: S&P 500 capex has doubled over the past four years, driven by the data-center buildout, and GAAP forward earnings estimates for the index are now up 17 percent year-to-date, an annualized rate of 37 percent, with the vast majority coming from the semiconductor sector and the infrastructure supporting AI (Bloomberg, via Cantor Fitzgerald, July 2026).
Fiscal stimulus
The second is fiscal stimulus: recent US legislative activity is adding approximately 90 basis points to GDP growth this year.
The wealth effect
The third is a wealth effect that has reached historically unusual levels: household net worth has surged well above its long-run trend since Covid, driven by both public and private equity markets and rising housing prices. The public equity market now represents 200 percent of US GDP, a historic high that exceeds the peak of the late 1990s internet bubble (Cantor Fitzgerald, July 2026).
NWORVALU as of 03/31/26
FOF Federal Reserve US Households & NPO… Federal Reserve
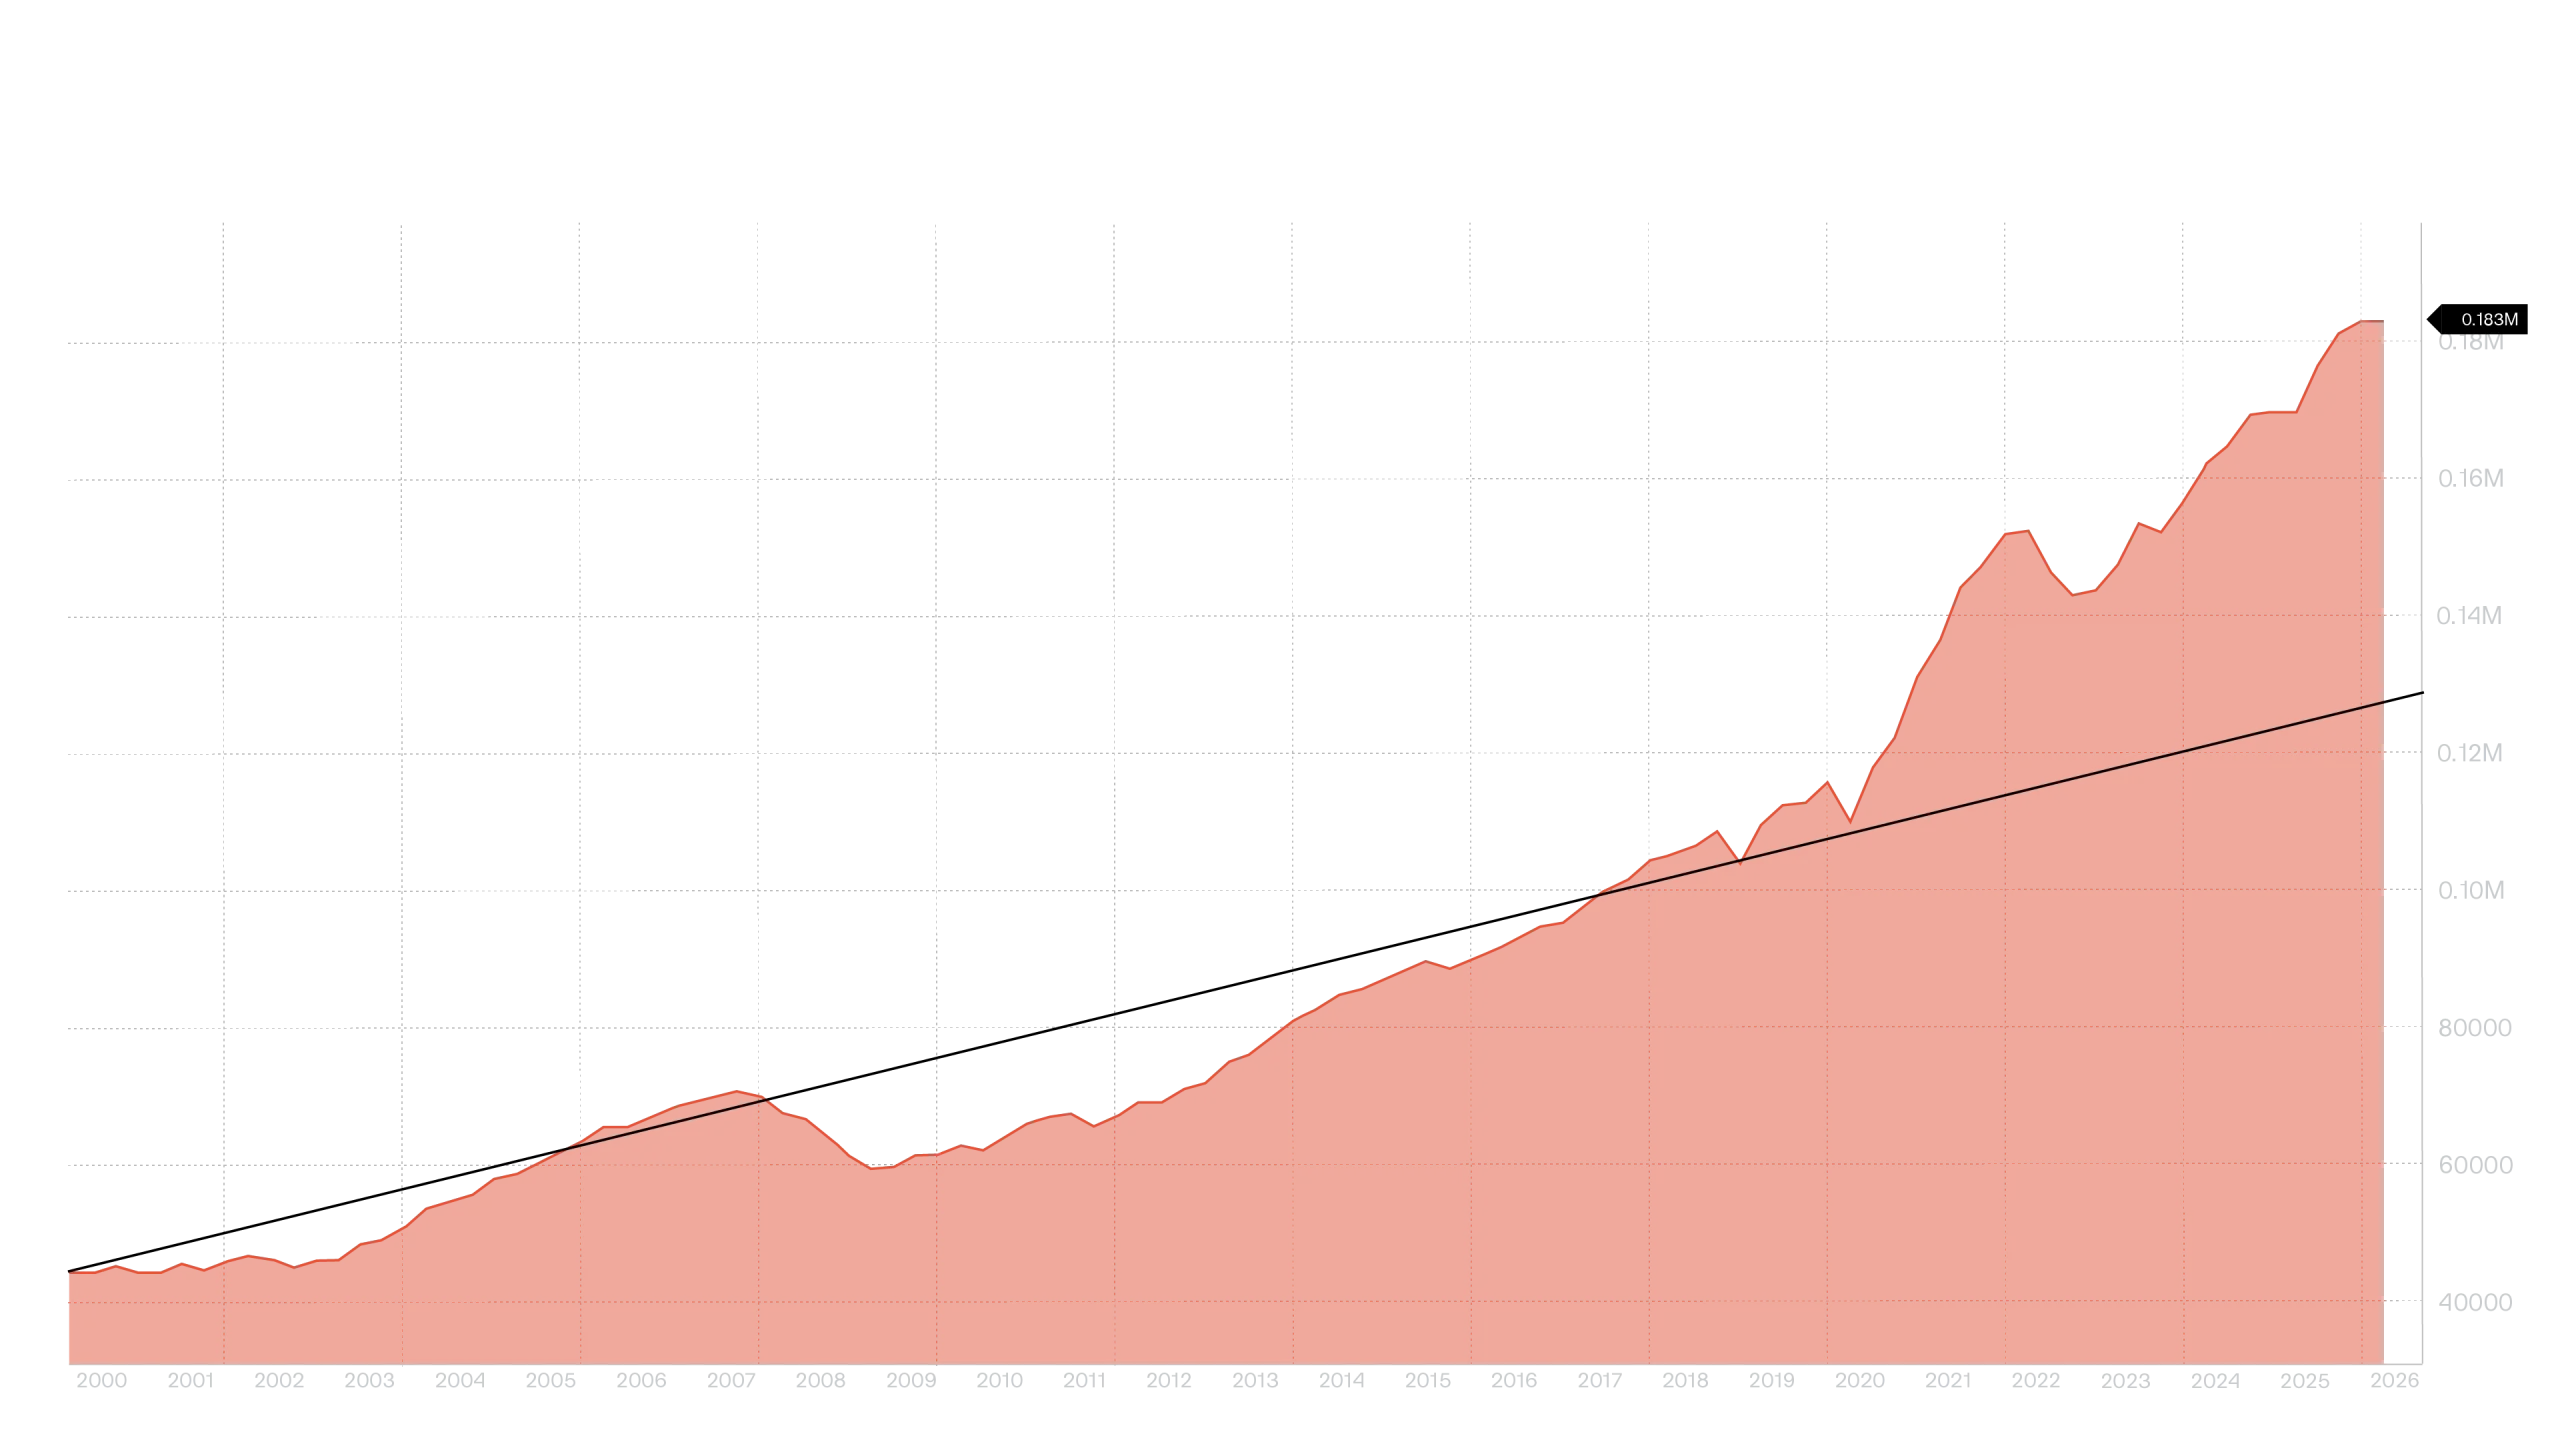
The behavioral consequence of that wealth accumulation is visible in the spending data. The US personal savings rate has fallen to 2.6 percent, close to a multi-decade low, as consumers spend rather than save against rising asset values. Johnson Redbook same-store retail sales are running at 9.6 percent year-on-year as of July 2026 (Bloomberg, via Cantor Fitzgerald, July 2026).
For travel, the distribution of that spending matters more than the aggregate. Wealth-effect-driven consumption is concentrated among asset holders.
SPX Mkt Cap / Nominal GDP (Bloomberg)
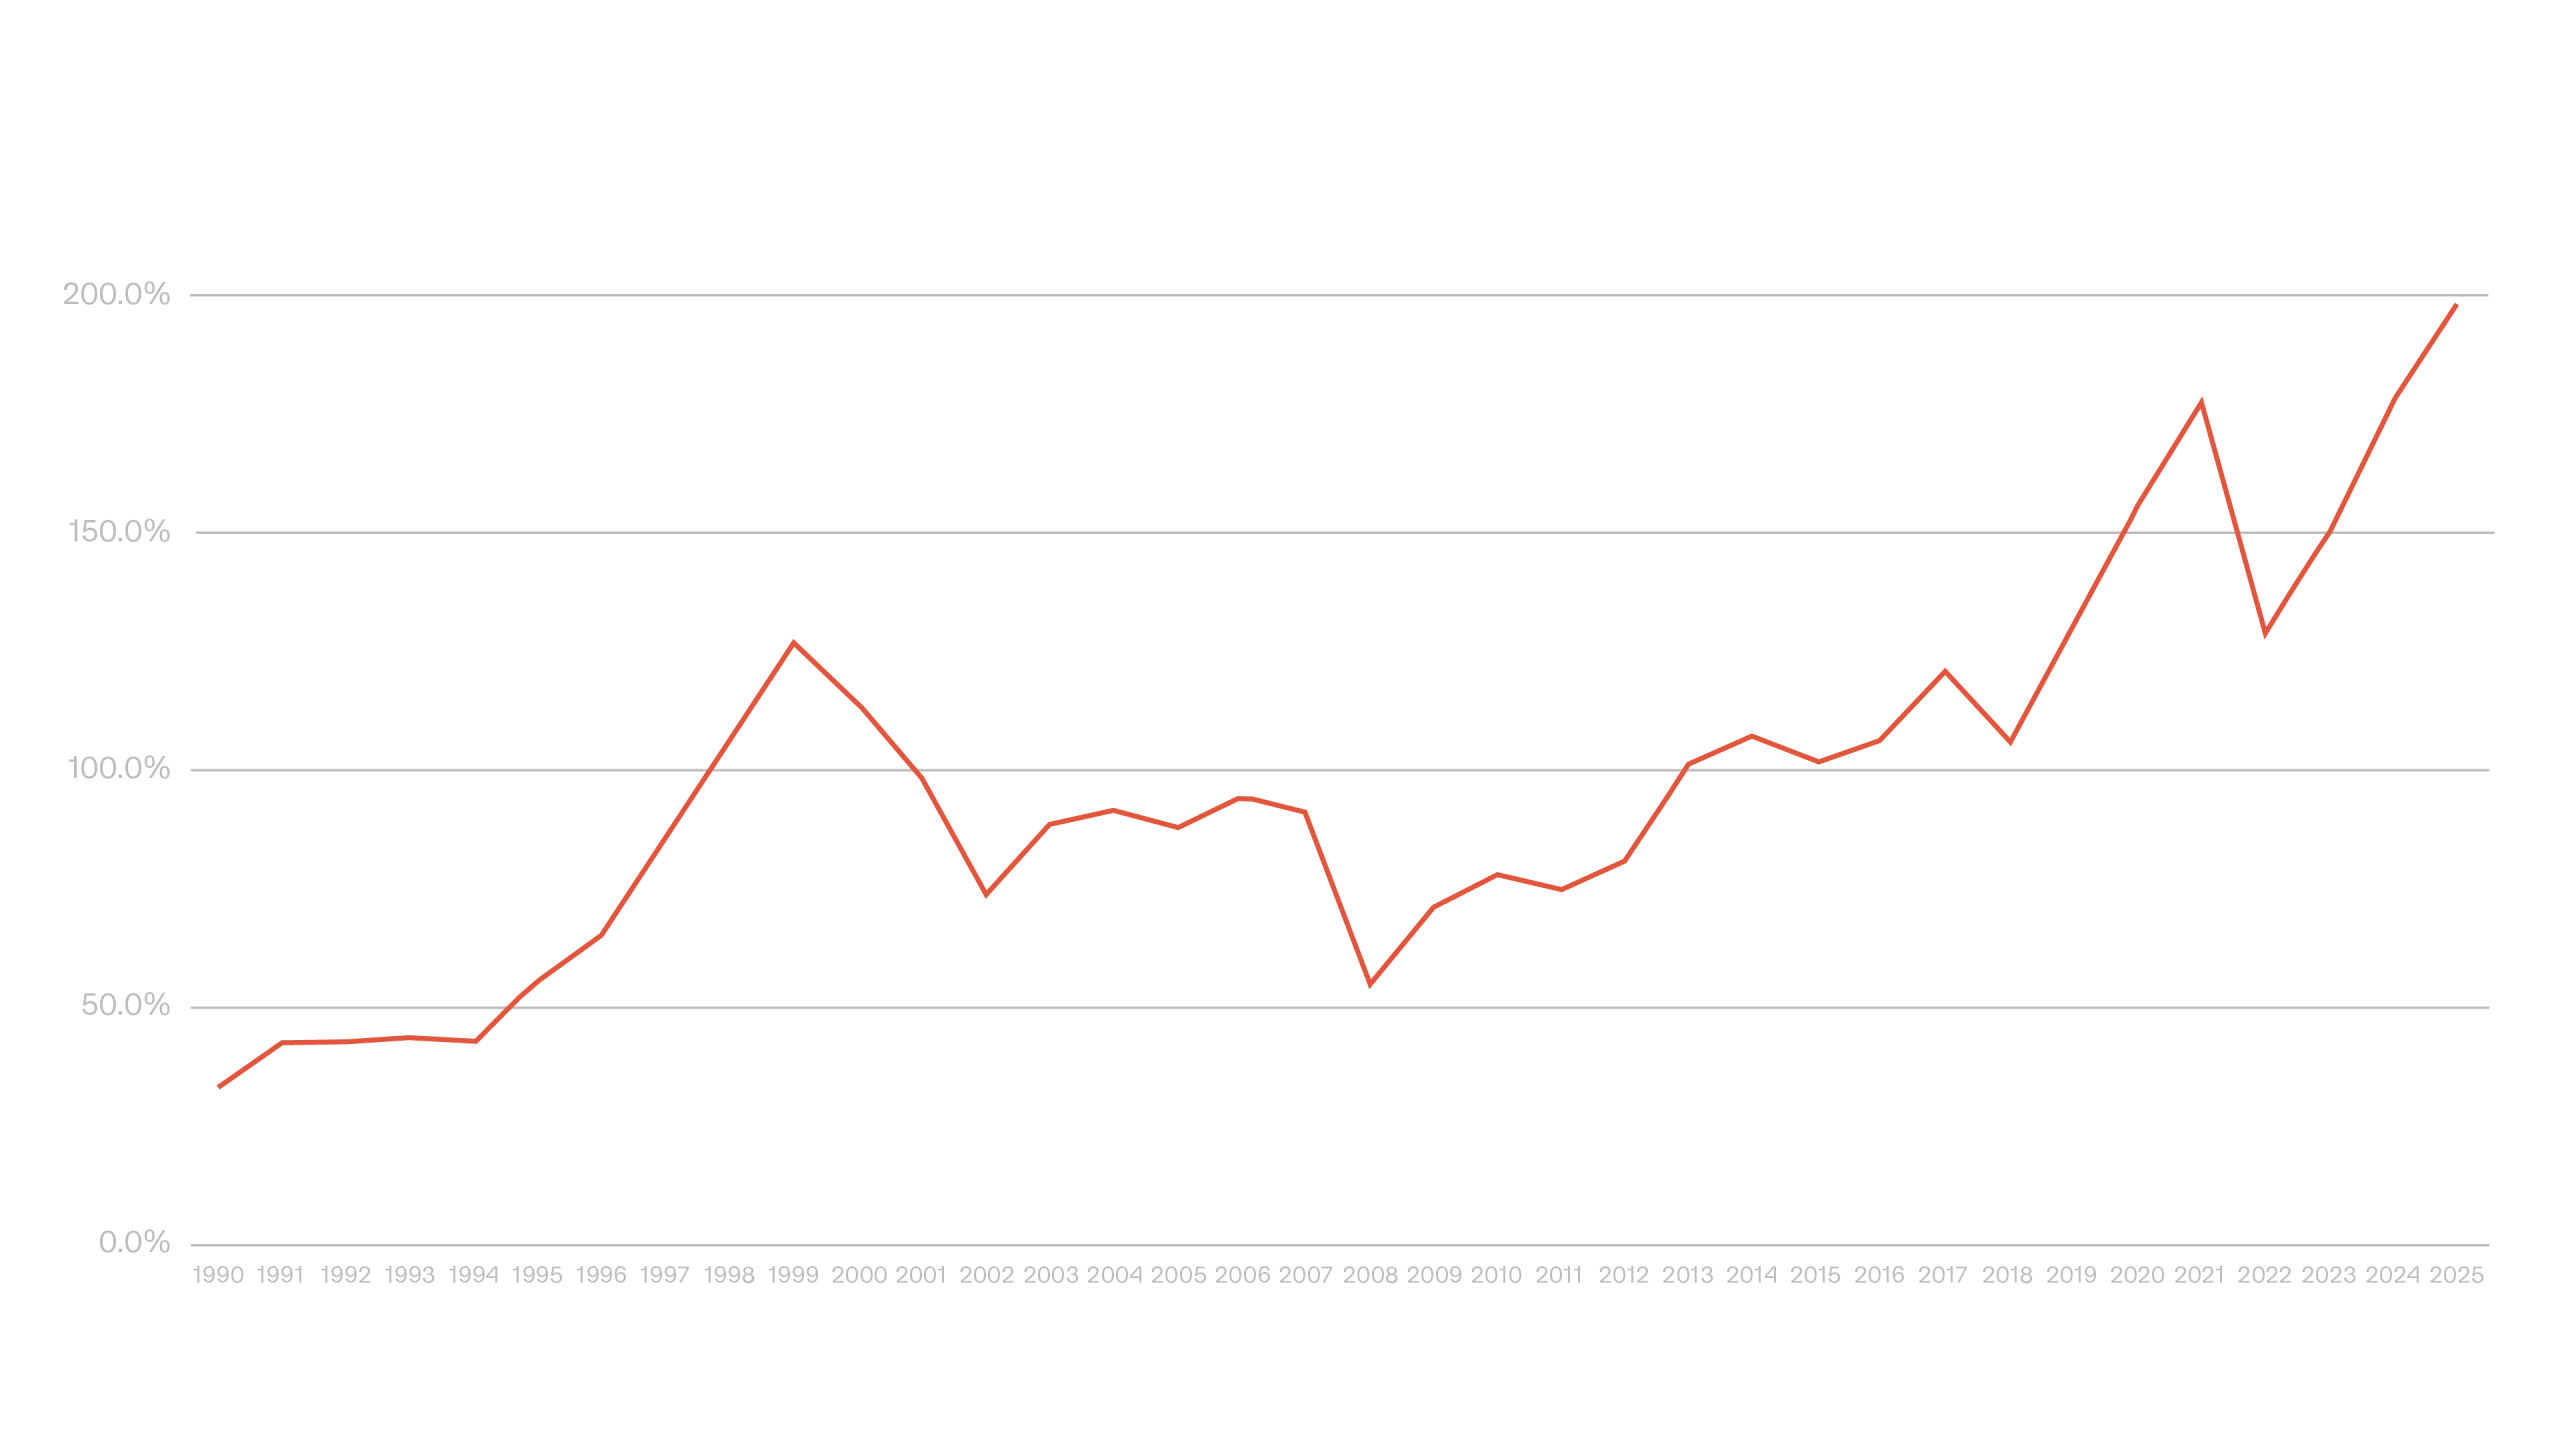
*SPX market cap pulled via Bloomberg
**Nominal GDP pulled via Bloomberg GDP Cur$ Index
The traveler booking premium international itineraries and luxury hotel stays is behaving differently from the traveler whose confidence is being eroded by prices that remain far above their long-run trend. That bifurcation is visible in booking data even when headline demand figures look robust.
Inflation: peaked but prices remain far above trend
Johnston’s July 2026 view represents a material shift from his May analysis. He now believes inflation has peaked and expects declining rates in the months ahead, driven by falling oil prices, declining agricultural commodity prices, the lapping of year-on-year tariff comparisons, and moderation in owners’ equivalent rent (Bloomberg, via Cantor Fitzgerald, July 2026).
USGGBE05 Index
Inflation expectations have pulled back from their 2026 high, though prices remain far from normalized.
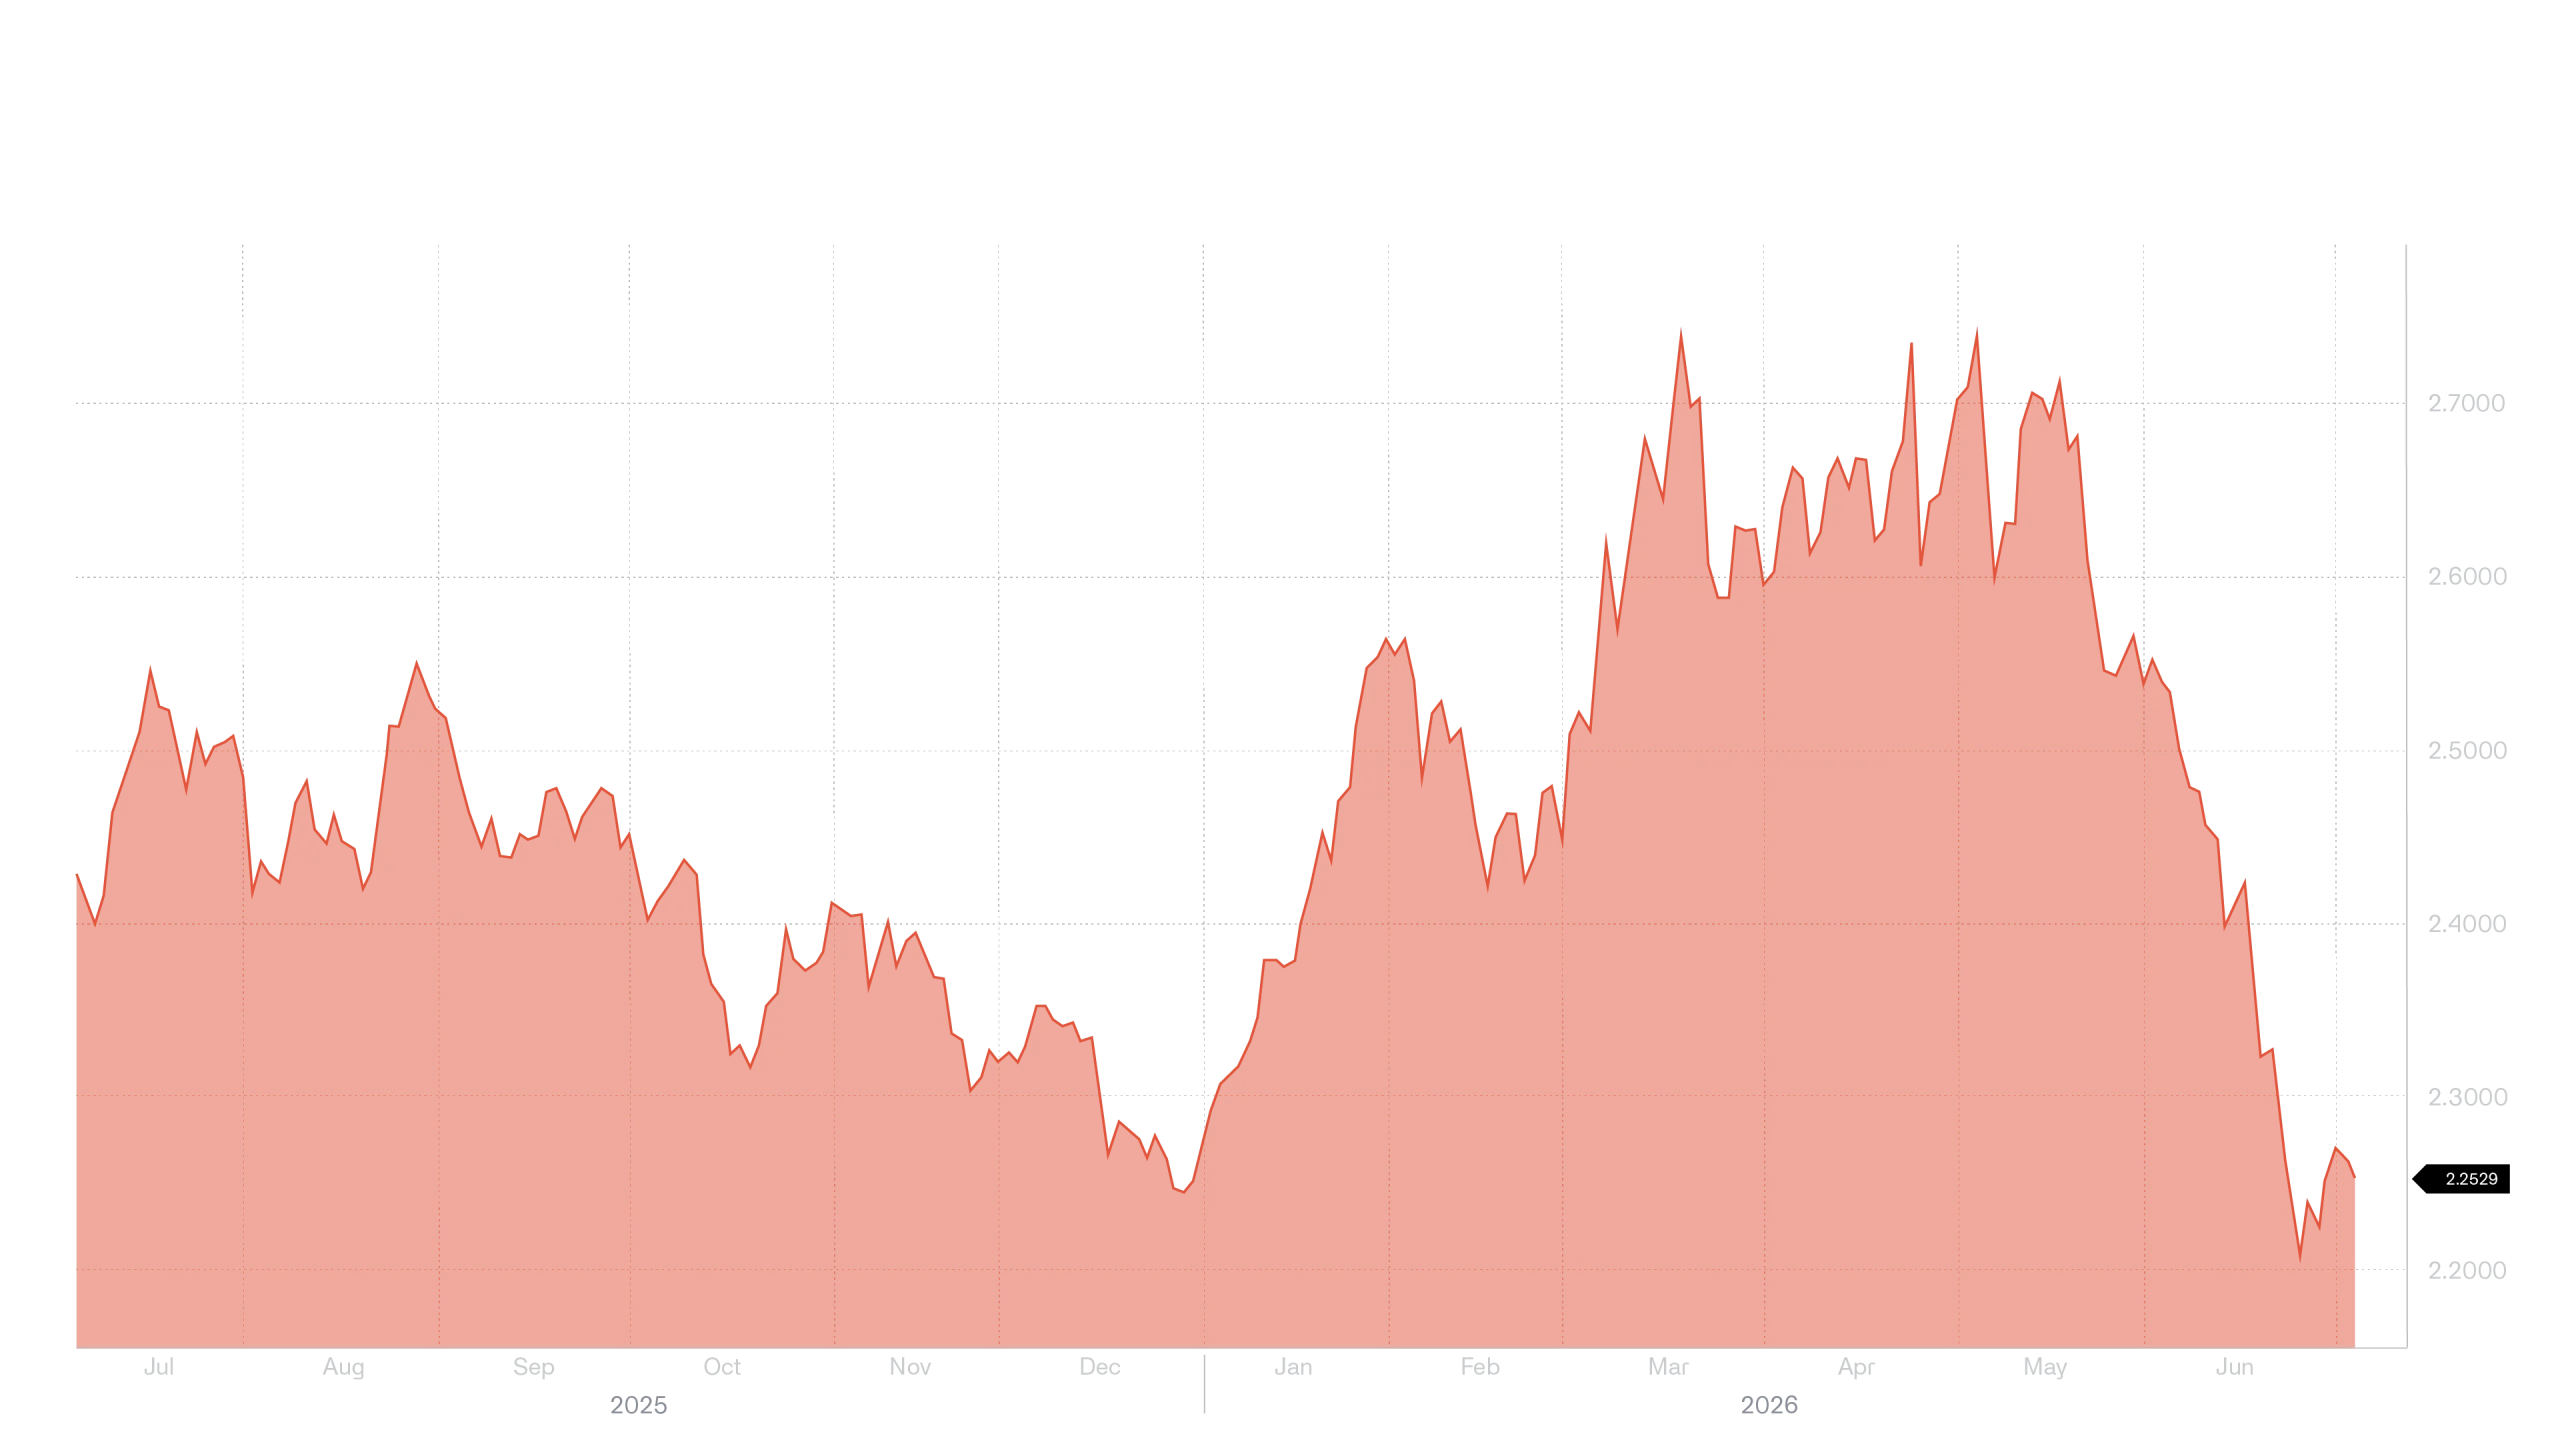
That is the directional picture. The structural picture is more difficult. The CPI index sits far above its 35-year trend line. Prices have not come down. They have simply stopped rising as fast. For travel operators managing input costs against consumer price sensitivity, the distinction is significant: the pressure on margin does not ease when inflation peaks. It eases when prices normalize, which is a different and longer timeline.
Johnston’s historical analysis reinforces one dimension of this. In years when inflation runs above 2.7 percent and the Fed does not fight it and there is no recession, S&P 500 returns have been positive 94 percent of the time, with a median return of 17.3 percent (Cantor Fitzgerald, July 2026). The environment that produces those equity returns also sustains the wealth effect driving premium travel demand. It does not reduce the cost pressure on the segments of the travel-buying population whose wealth is not tied to equity markets. The gap between rising input costs and achievable pricing is already visible across the travel ecosystem.
Monetary policy: the rate environment has changed
The monetary policy picture has moved sharply since the start of the year. Fed fund futures are now pricing a 100 percent probability of a rate hike, a position that sat at zero just three months ago (Bloomberg, via Cantor Fitzgerald, July 2026). Kevin Warsh’s appointment as Fed chair adds a structural layer of uncertainty to that shift: Johnston’s analysis of all Fed chair transitions since 1930 shows a median S&P 500 drawdown of 4.2 percent in the six months following a new appointment, with an average drawdown of 9.8 percent (Cantor Fitzgerald, July 2026).
The travel implication is not the rate move itself, nor the equity drawdown in isolation. It is the speed of the shift and what that speed signals about forward planning confidence. Finance teams at major corporations respond to monetary policy reversals and equity market volatility faster than they respond to economic data releases. A rate environment that moved from two expected cuts to a hike in three months creates exactly the kind of forward uncertainty that produces corporate travel policy reviews. When procurement teams open those reviews, travel budgets are among the first items examined.
The AI buildout: a source of economic strength and a source of uncertainty
Johnston identifies the AI data-center buildout as the primary engine of current earnings growth, but also as a source of forward uncertainty that the market has not yet fully priced. He lists several open questions: whether open-source models gaining share against frontier models triggers a price war; whether the move from token maximization to token minimization alters the infrastructure investment thesis; and whether regulatory involvement in data-center development increases as political attention grows (Cantor Fitzgerald, July 2026).
For travel, the relevance is indirect but material.
The same wave of AI investment that is funding data centers is also helping move agentic AI from theory into real use across travel distribution and servicing. If that investment slows or becomes less certain, travel’s adoption of agentic AI could slow too. More immediately, the uncertainty Johnston points to in the broader AI market is the same uncertainty travel leaders face as they decide where, when, and how much to invest in new technology.
PART II
Industry sentiment
What travel executives told us
Understanding how a macroeconomic environment lands on an industry is one thing. Understanding how the people running that industry are actually responding to it is another perspective. Sabre fielded a proprietary executive survey across airlines, agencies, and hotels to find out. The results sit somewhere between cautious and constructive, which is about the most honest place the travel industry could be right now.
The headwinds executives feel most
Geopolitical instability ranked as the top concern across the survey sample. That finding holds across sectors, though the specific shape of anxiety varies. For airlines, geopolitical disruption maps directly onto route uncertainty and corporate travel policy tightening.
For agencies, it surfaces as unpredictability in booking lead times and volatile consumer willingness to commit. For hotels, the concern concentrates on group, MICE, and international inbound.
Consumer inflation, sustained cost pressure and weakening consumer confidence also rank high on the list of concerns, but there’s an important distinction here: travelers aren’t stopping. They are searching for deals before they commit. Call it the shopping window: the time between first search and final booking. It’s stretching, and the cost of holding inventory through that extended window falls on suppliers and sellers alike.
Disruption
Uncertainty
Unpredictability
Geopolitical instability
Theindustry’stopconcernisgeopoliticalinstability,withairlinesfeelingitmostdirectlythroughrouteuncertaintyandtightertravelpolicies.
Sabre proprietary voice of customer research: Navigating the Fog survey, June 2026
Protective but not inactive: how travel companies are responding
The majority of surveyed companies report that they are currently in what might fairly be described as protection mode. That term deserves unpacking, because it does not mean inaction. Protection mode in the context of this survey means maintaining current roadmaps rather than accelerating them, delaying high-risk or speculative projects in favor of initiatives with near-term, demonstrable return, and focusing operational investment on internal efficiency gains rather than external growth bets.
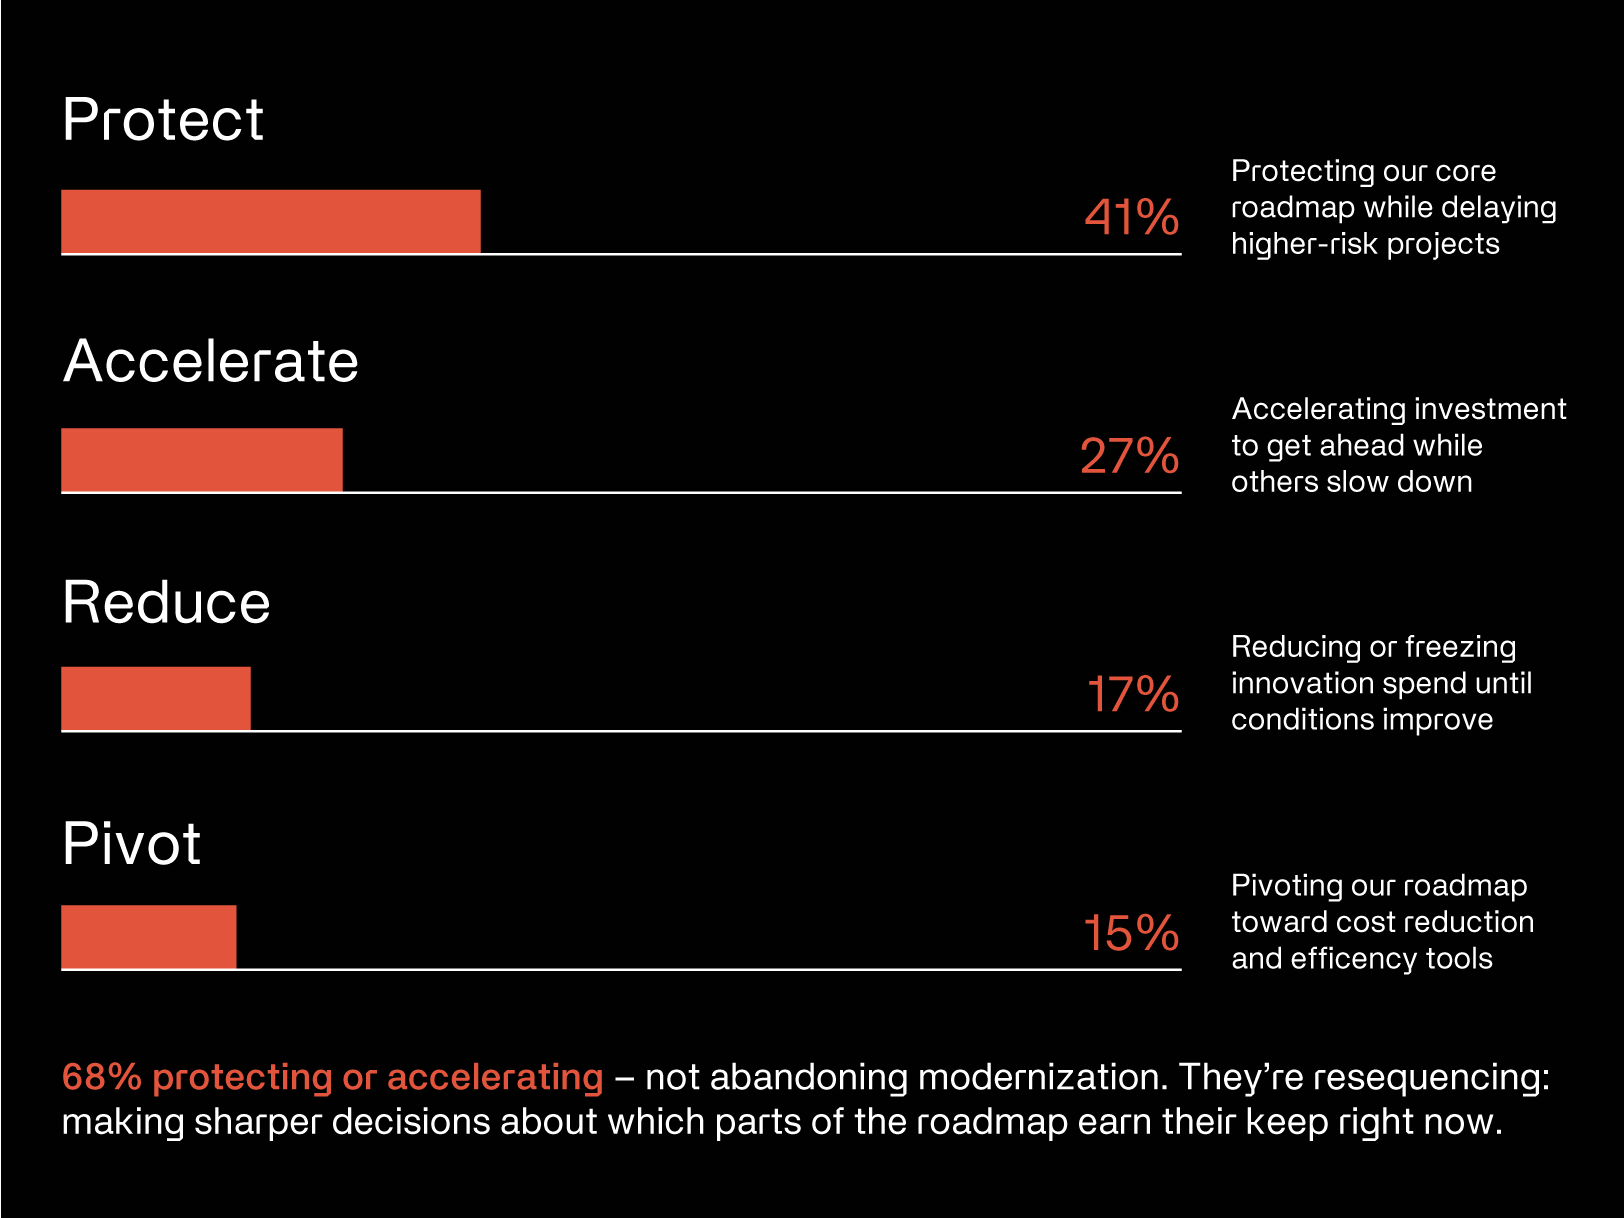
That is a rational response. When the cost of capital is higher and the forward visibility is lower, the bar for speculative investment rises. What is notable in the data is how clearly that logic is playing out across the sample: companies are not abandoning modernization programs, but they are making sequencing decisions that prioritize payback period over transformation ambition.
Companiesaren’tabandoningtheirroadmaps.They’remakingsharperdecisionsaboutwhichinvestmentscandelivervaluerightnow,sequencingthelarger,enterprise-wideinitiativestofollow.
AI investment: the gap between aspiration and application
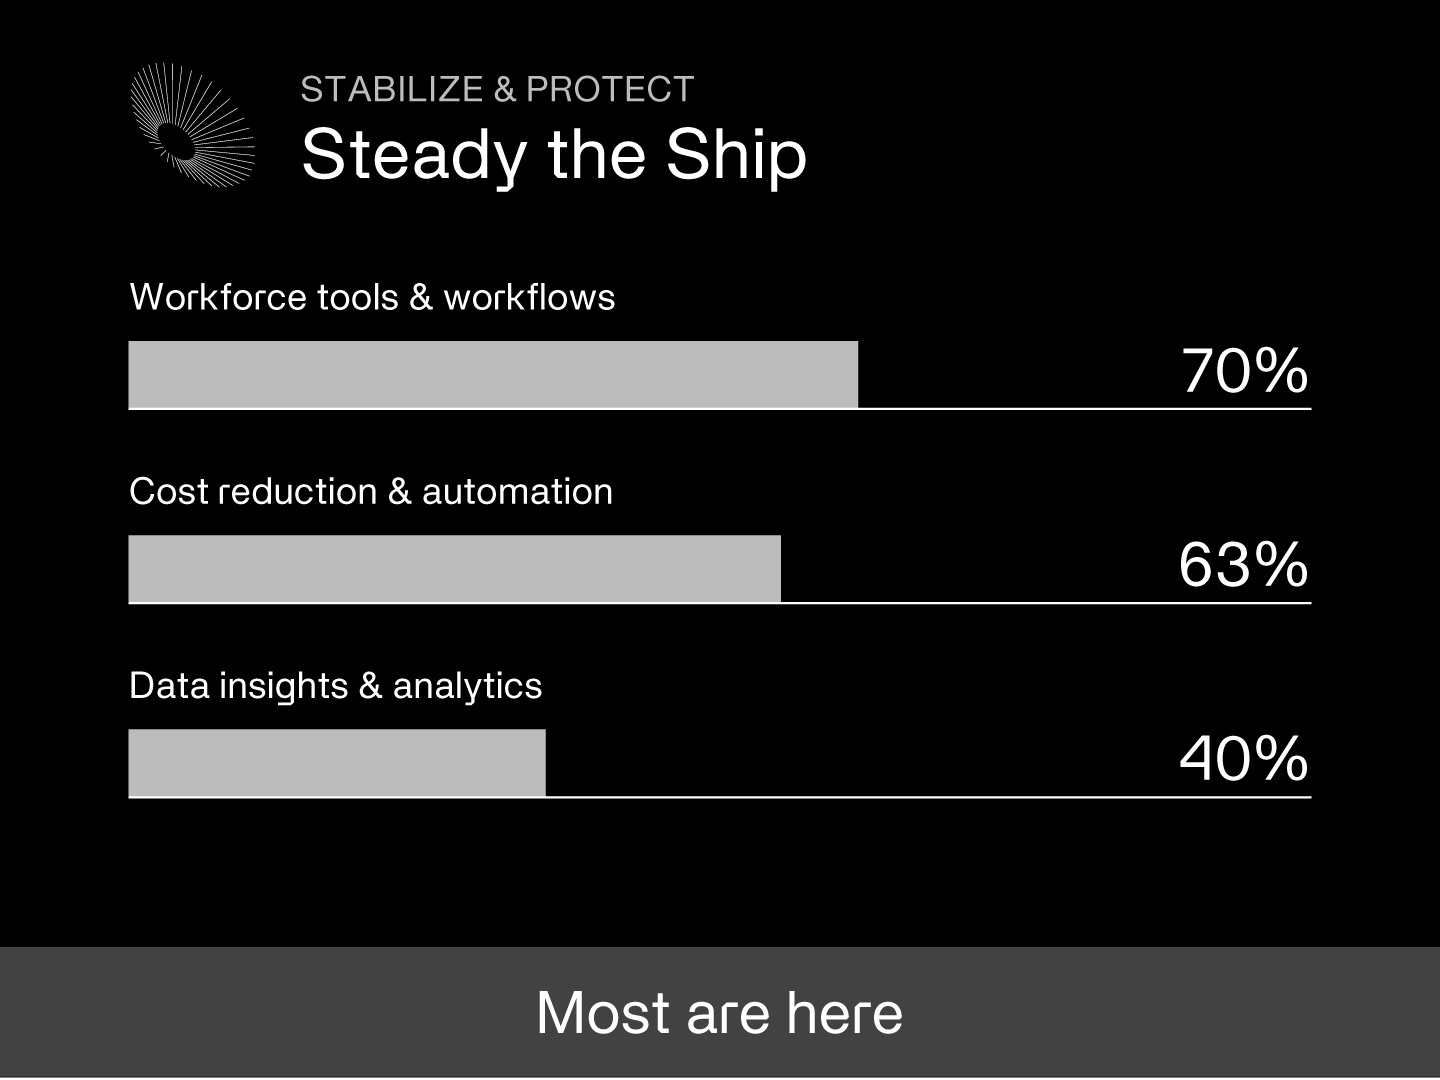
One of the more instructive findings in the survey concerns how travel executives are applying AI investment at this moment. The data shows a clear lean toward internal efficiency applications over external revenue growth plays. Cost containment, agent productivity, automated servicing, and queue reduction are all attracting more near-term AI budget than customer-facing retailing optimization or demand forecasting.
vs.
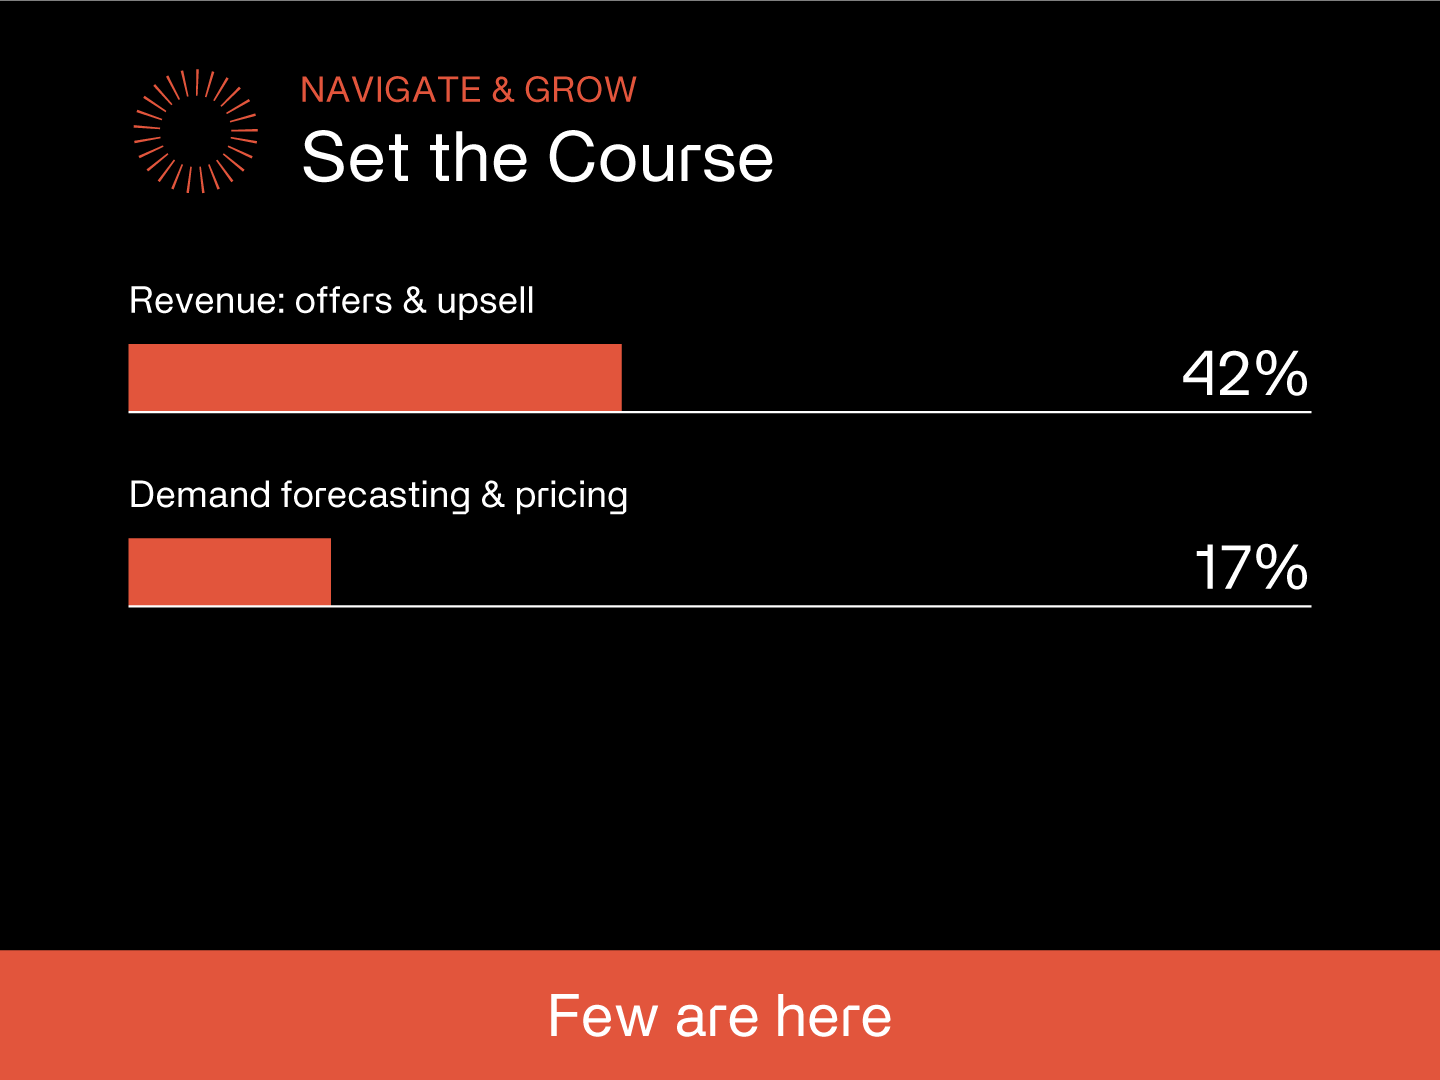
This is not a sign that the industry has given up on AI as a growth lever. It reflects something more practical: in a constrained environment, the ROI on internal AI applications is faster and easier to defend to a board. The efficiency case for AI closes in quarters; the revenue case often requires longer runway. Companies are prioritizing accordingly.
The implication for technology vendors, Sabre included, is straightforward: the most compelling near-term product conversation is not about transformation. It is about demonstrable, near-term value that fits the current risk tolerance of buyers. The longer-term modernization story remains important, but it earns its hearing by proving itself in the short term first.
Majorityposition:TravelexecutivesprioritizingAIforinternalefficiencyoverexternalrevenuegrowthrightnow
Commercial goals are being redrawn, not abandoned
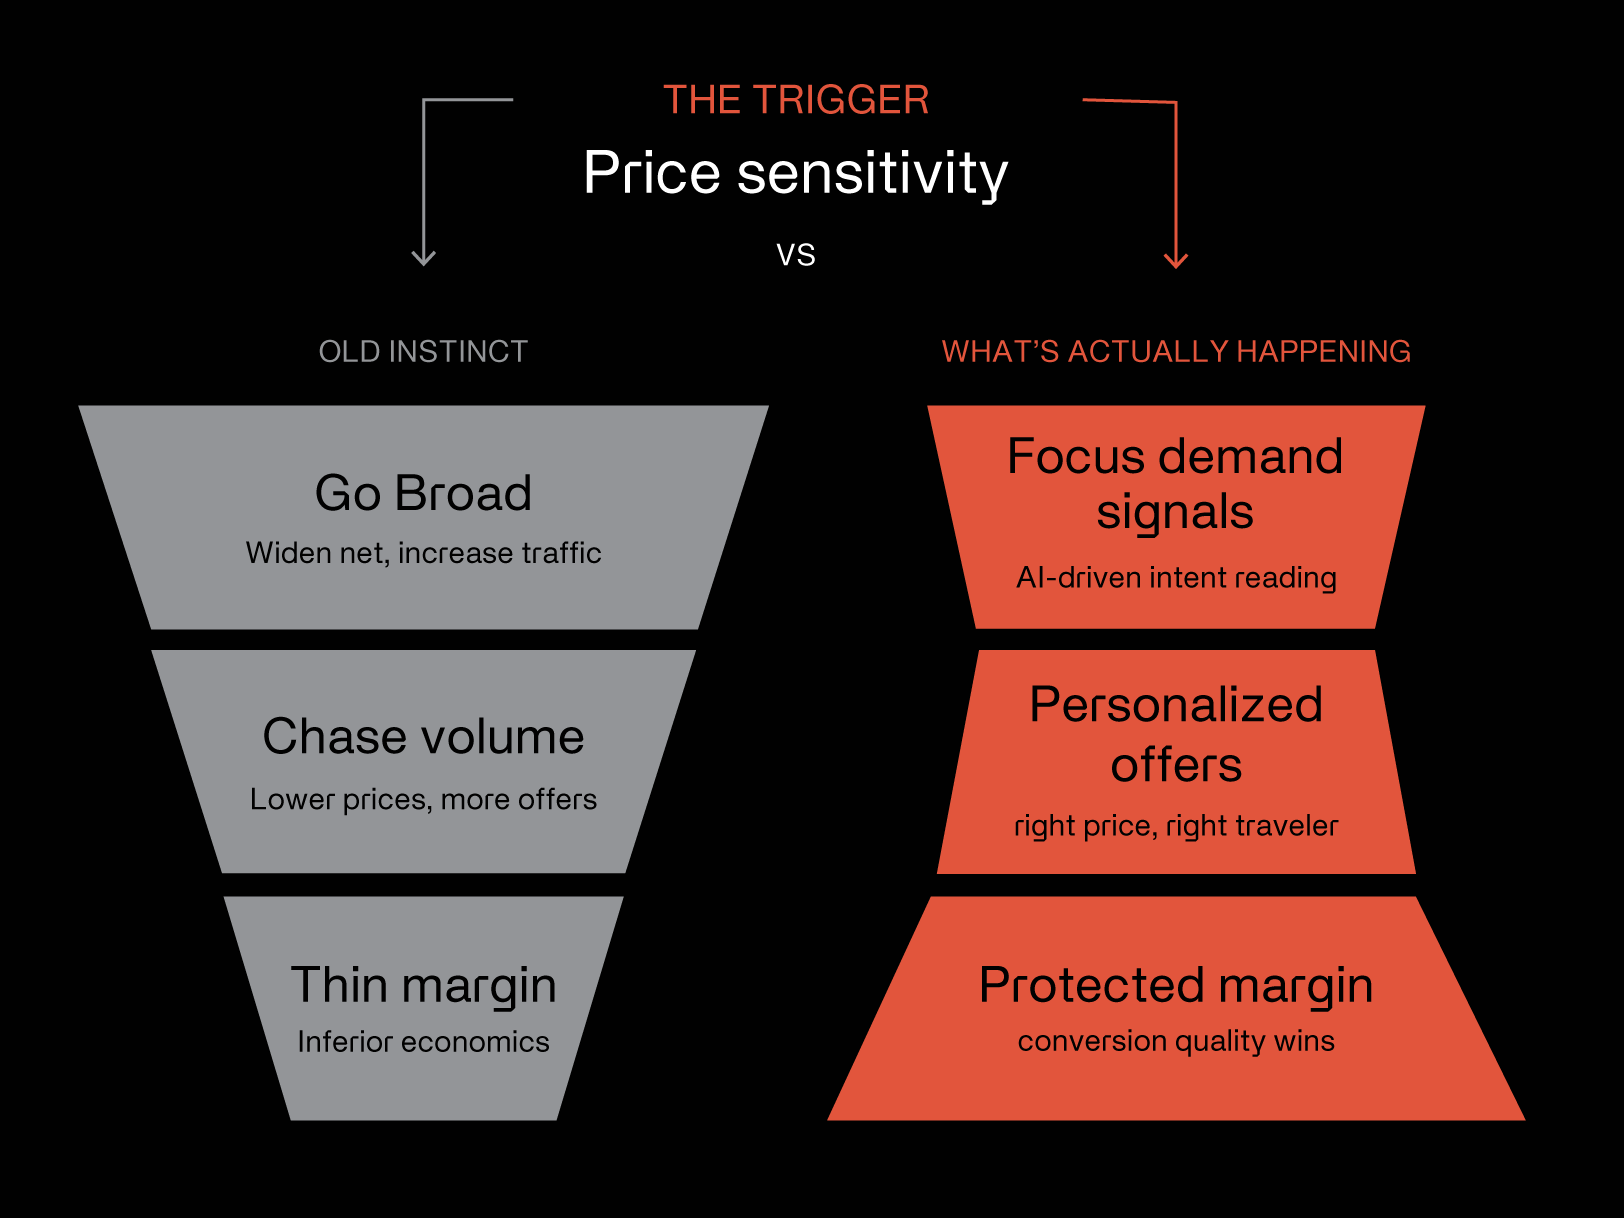
Cost-conscious travelers are forcing a recalibration of commercial goals across the industry. The survey captures this clearly: companies are not chasing higher volumes through lower prices, which would be the blunt instrument approach. They are using AI and retailing controls to optimize and defend the revenue they already hold. The focus is on conversion quality rather than traffic quantity, on protecting margin on existing bookings rather than acquiring new ones at inferior economics.
That shift in strategic framing has real product implications. Retailing controls, intelligent pricing, and automation tools that reduce servicing cost all speak directly to the current priority set. They are not aspirational investments in a future capability. They are solutions to problems that are active on desks right now.
Confidence, despite everything
One finding in the survey deserves particular attention because it runs against the prevailing narrative: overall confidence in business performance remains solid, particularly among agencies. Demand for agency services has held steadier than many anticipated. The businesses expressing the highest uncertainty are airlines, where fuel cost volatility and supply-side unpredictability add a layer of complexity that demand stability alone cannot fully offset.
For airlines, investment in tools that help them match capacity to demand with higher precision, and recover revenue through every part of the transaction, becomes more valuable in exactly these conditions. The case for offer optimization, smarter network planning, and payment efficiency is not a fair-weather case. It is more compelling when margins are thin.
The data, in short, supports cautious optimism. The fog is real. Visibility is reduced. But the industry is still moving, and the companies that have made the right short-term moves are entering the recovery window from a stronger position.
Part III
Five moves to make now
The survey data points to a clear commercial logic for this moment: protect what you have, improve what you already run, and activate the revenue lines you have not fully turned on yet. The five moves below are organized around that logic. They are not transformational bets. They are high-confidence near-term plays with documented return and manageable implementation scope.
In practical terms, the five moves are about helping travel companies make more money from the demand they already have, reduce avoidable costs, and make better decisions in a cloudy market. They cover retailing and offer optimization, more reliable shopping, smarter payments, automation for servicing and disruptions, and better market intelligence. Together, they give airlines, agencies, and lodging suppliers concrete ways to respond to the pressures identified in the survey.
01
Guard your margin before someone else takes it
Retailing controls, for agencies, airlines and lodging suppliers
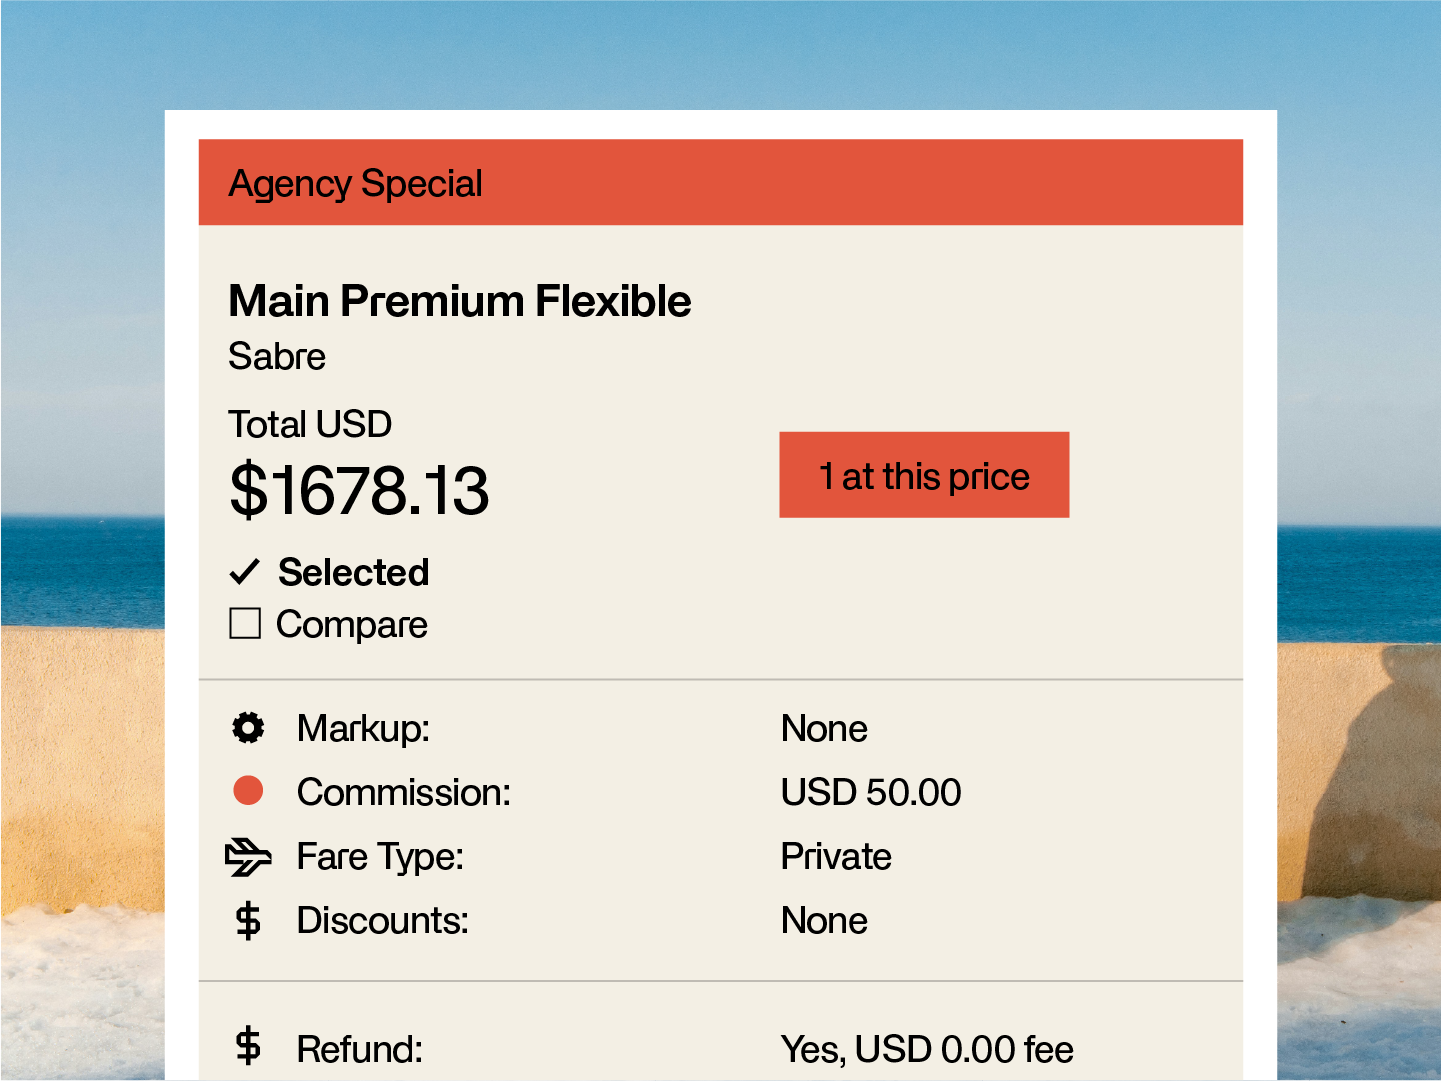
When consumer confidence is soft and shopping windows are stretching, competing on price is tempting. A stronger move is to compete on offer quality: surfacing the options that support commercial priorities and protect margin.
For agencies, Sabre Mosaic® Agency Retailer
and Lodging Retailer put retailing controls directly into the shopping flow. Rules surface preferred suppliers, suppress low-value offers, and adjust margin dynamically, with changes live within minutes.
The return is tangible: a 3–7% margin lift, up to 20% more preferred carrier bookings, and a 3% increase in lodging commission revenue at a mid-size TMC.
3 – 7%
boost in margin
up to
20%
increase in preferred carrier bookings
3%
increase in commission revenue for lodging
For airlines, Offer Optimization
applies the same logic on the supply side, using AI to adjust prices, bundles, and ancillaries in real time based on capacity, market conditions, and traveler behavior.
Documented uplift includes up to 3% higher airfare revenue and up to 10% higher ancillary revenue.
up to
3%
increase in airfare revenue
up to
10%
increase in ancillary revenue
Network Planning products
help airlines coordinate schedules and fleet deployment against real demand signals, so they can simulate decisions before committing when route economics shift quickly.
For both flight and lodging suppliers, modern distribution APIs make their full content bookable across high-value agency and AI-mediated workflows. One integration reaches 50,000+ agencies, TMCs, and OTAs in 190+ countries.
The impact is measurable: hotels using modernized distribution see $11.70 higher ADR than the global average and 39.6% loyalty bookings versus 36.2% direct.
$11.70
higher ADR than the global average
39.6%
loyalty bookings versus 39.2% direct
02
Don’t let a booking you already won fall apart at checkout
Cache-powered intelligent shopping for agencies
Here’s a frustrating one. A traveler finds an offer, likes it, and clicks to book it. Then it fails, because somewhere between the search and the click, the fare changed or the offer stopped being available. From the traveler’s side it just looks broken. From the agency’s side, that’s a sale that was already made, gone for a reason that had nothing to do with price or service.
Most agencies treat this as background noise, a cost of doing business that’s too small to chase and too baked into the systems to fix. But at scale it adds up, and it’s become more visible now that fewer bookings are coming through the door to begin with.
Sabre Mosaic Cache
solves this by keeping a live, constantly validated view of availability across EDIFACT, NDC, and LCC content, so what shows up on screen is genuinely bookable, not a snapshot that’s already gone stale. That keeps bookability above 95 percent.
It’s not a new revenue stream, it’s revenue you were already generating, just making it all the way to the finish line instead of failing at the last step.
95%+
Bookability
03
You could make up to $3.40 per booking if you make this one payment change
Payment suite, for agencies and airlines
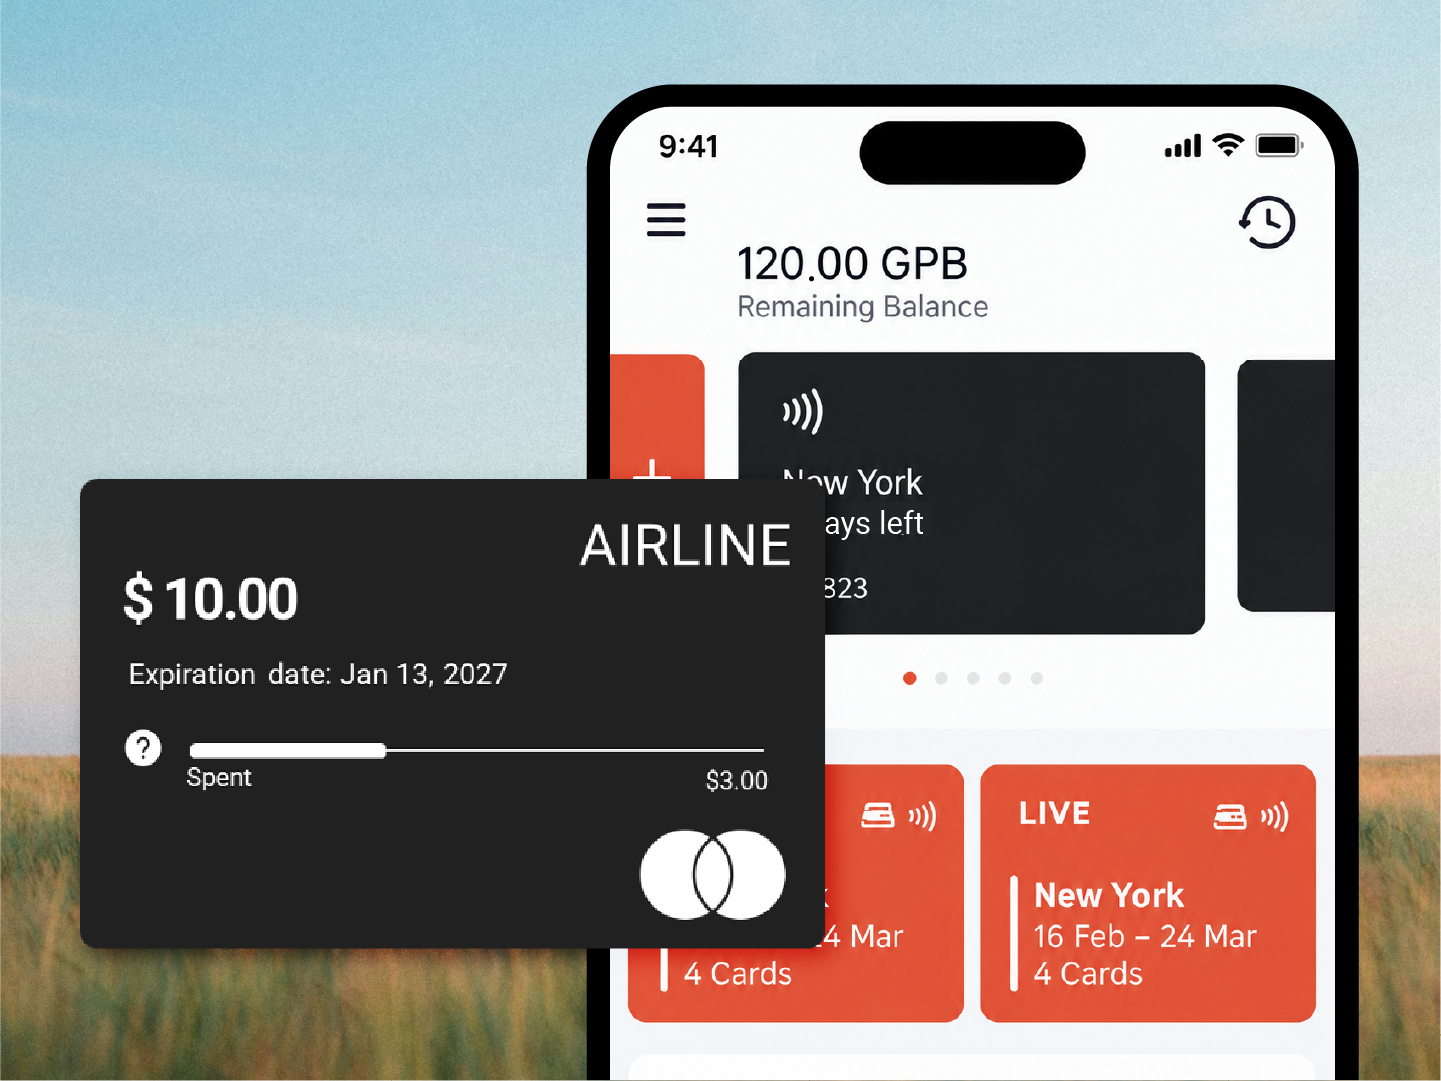
Payments are one of those parts of the business nobody spends much time on, mostly because they’re genuinely complicated. But complicated doesn’t mean the money involved is small.
Take virtual cards
. A mid-size agency processing around 100,000 bookings a year can typically generate about $3.40 per booking just by tightening up how it pays suppliers, money that’s sitting inside a process that’s already running, not a new line of business.
Chargebacks
are similar. Most agencies recover a fraction of what they could, and better handling of disputes can more than double that recovery rate. Put the two together for that same 100,000-booking agency, and you’re looking at somewhere around $200,000 a year. Go bigger than that, and the number goes up with it.
None of this needs a transformation project or a new system. Payment Acceptance
, Virtual Cards, and Chargeback Management work with what’s already there.
Payments are complex. We handle that complexity so you get the simple version: more of the money that was always yours, actually landing in your account.
04
Handle more volume without adding headcount
Automation for servicing, for agencies and airlines
When travel plans change, schedules shift, or corporate policy tightens, exchange and refund requests pile up fast. The usual response is to throw more people at the queue, working overtime or pulling staff off other tasks to keep up. That’s manageable for a week. Over a quarter, it’s a real cost, and in a year where every dollar of margin is being watched closely, it’s a cost that starts showing up in the numbers.
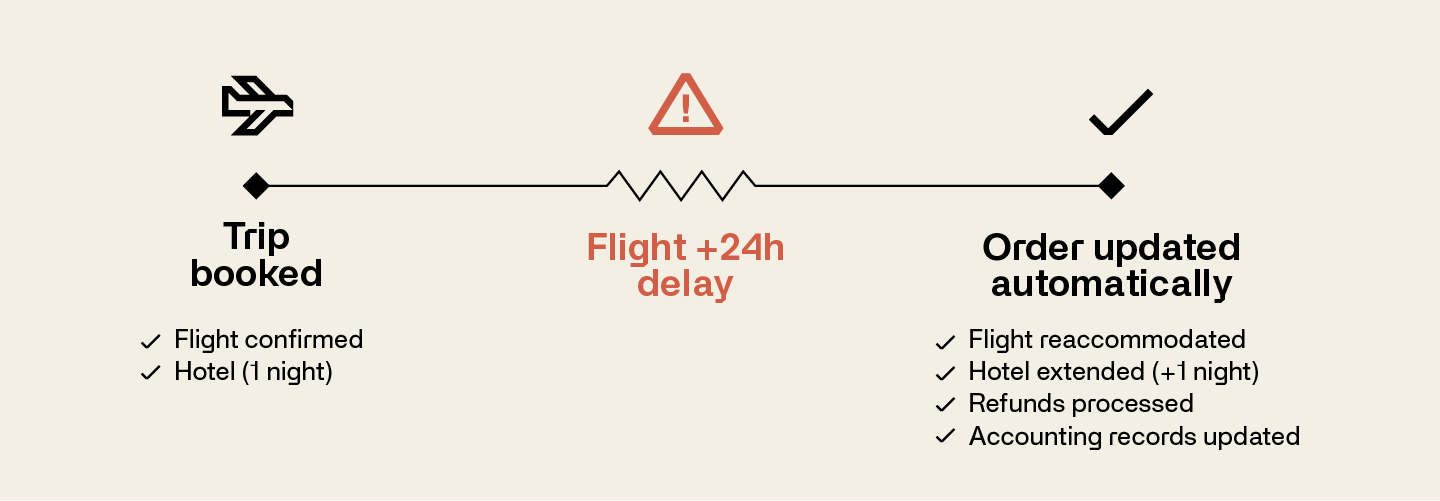
That’s when Disruption Management
solutions come in. For airlines, they automate routine disruption handling by syncing order, inventory, and seat-map data in real time across the whole journey, so airlines recover faster and protect loyalty. IROPS Reaccommodation processes 50,000 PNRs and finds over 30 million options in one solve, cuts agent interaction up to 90%, and enables 95% contactless travel.
up to
90%
cuts in agent interaction
enables
95%
contactless travel enablement
For agencies, having the right exchange and refund
tools can take the repetitive parts of that work, searching, repricing, reissuing, standard disruption handling, and let the system do it automatically, so agents are only stepping in for the cases that genuinely need judgment. Agencies running this are automating up to 80 percent of ticket exchanges. That’s capacity an agency gets to use without adding a single person to payroll.
up to
80%
automation on ticket exchanges
05
See the market before you have to guess about it
Decision intelligence, for airlines and agencies
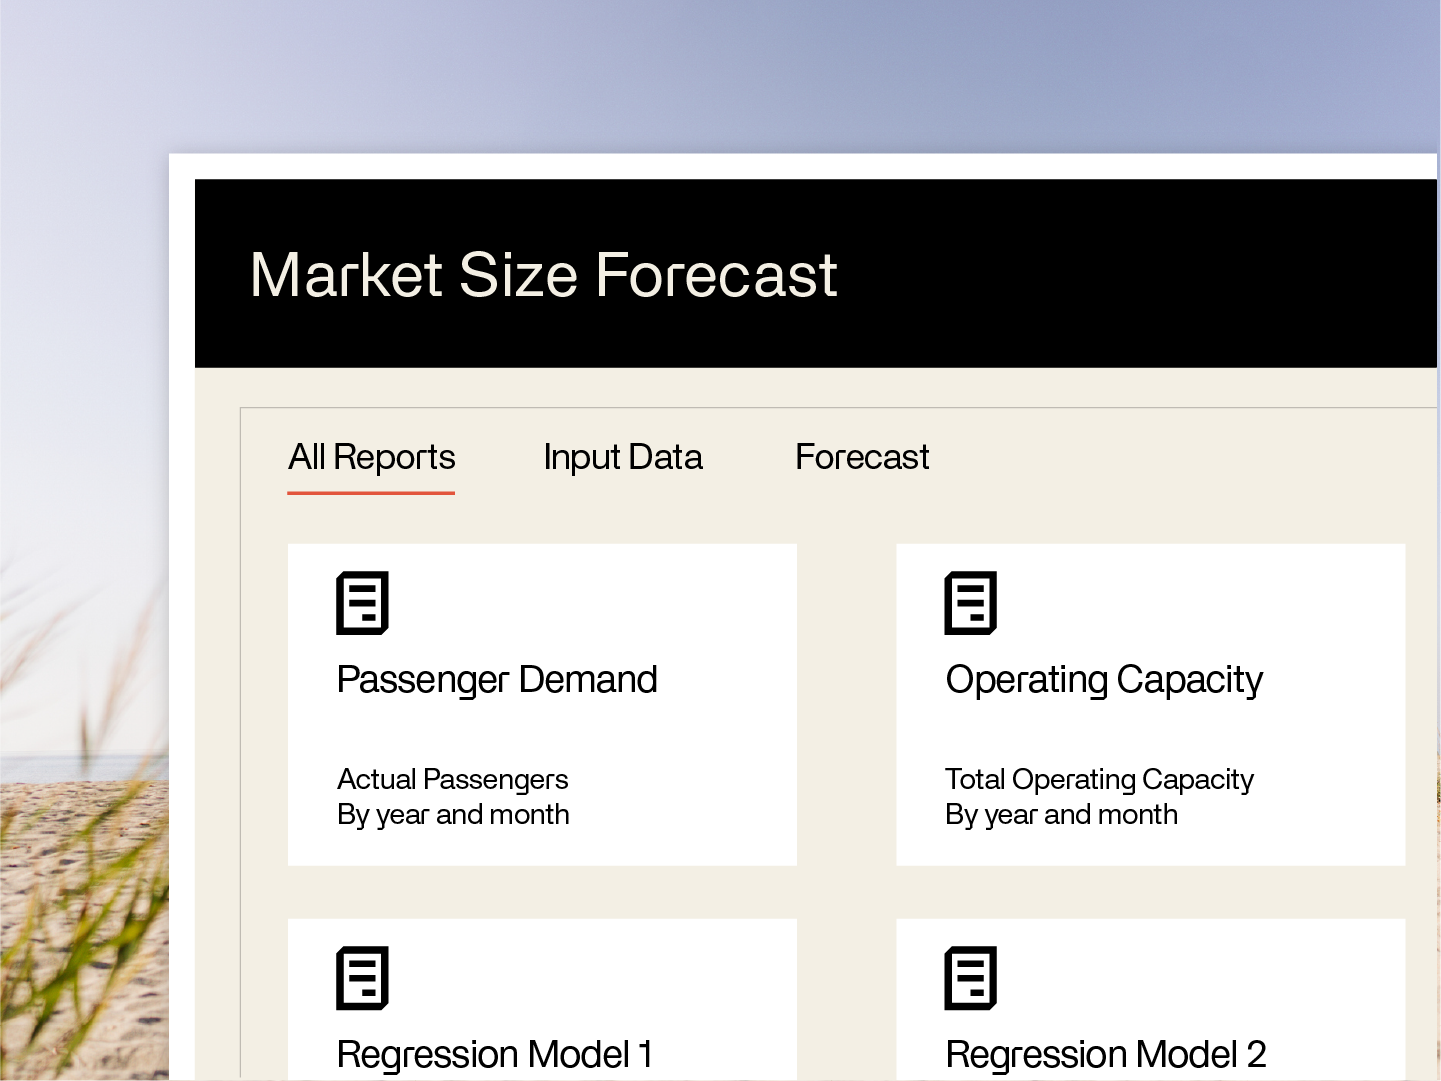
When it’s hard to see what’s coming, waiting feels like the responsible choice. Get more certainty, then decide. The catch is that waiting has a cost of its own. By the time the picture is clear enough for everyone to see it, the advantage of having moved early is already gone, and someone else has usually taken it.
That guesswork often comes from averages and aggregated benchmarks that mask what’s actually happening at the booking level. Agencies need real, PNR-level data they can act on
. Comparing performance by geography, channel, and supplier can catch revenue leaks like cart abandonment and uneven lodging attachment before they compound.
Market Intelligence
for airlines pulls from more than 55 global data sources to surface demand signals while they’re still emerging, and it’s built with a query tool simple enough that teams without a data background can explore it themselves and test their own questions. Data lands by the 20th or 21st of the following month, which is weeks ahead of the traditional benchmarks most of the industry is still waiting on. In a market like this one, that head start is most of the advantage.
Closing
What the fog asks of us
Every period of disruption creates a separation between companies that treat caution as a strategy and companies that treat it as a constraint. The survey data in this report suggests that most travel executives understand the difference. They are being selective, not passive. They are prioritizing initiatives with demonstrable near-term return while keeping their longer-term modernization program alive.
The five moves in Part III are not a complete answer to the conditions described in Parts I and II. They are a starting point, selected because they address headwinds the survey identifies as most pressing, involve manageable implementation scope, and carry documented return rather than projected return.
Sabre’s role in this moment is to be the partner that helps customers move with confidence, not just the vendor that sells into uncertainty. That means being honest about what is available now, what requires longer runway, and what the trade-offs look like between the two. This report is an attempt to do that clearly.
For airlines and agencies that want to understand which of these moves fits their specific commercial situation, Sabre’s teams are ready to work through the analysis. The conversation does not start with a product demonstration. It starts with the numbers that matter most to your business.
Thefivemovesherearenottheory.Theyareworkinginairlineandagencyoperationsrightnow,inconditionssimilartotheonesthisreportdescribes.
Sources:
[1] GBTA Business Travel Index
[2] Pace Dimensions / STR CoStar Global Hospitality Analysis, 2026
[3] McKinsey & Company, “Airline premium cabins: Profitability at the front of the plane” analysis
[4] AirAdvisor / IATA Profitability & Yield Insights
[5] CoStar / Tourism Economics, “U.S. Hotel Industry Forecast Revisions,” June 2026
[6] GBTA Business Travel Industry Sentiment Poll, April 2026
More research & whitepapers
All research & whitepapers
[
Resource
\
Secure AI isn’t a feature. It’s a foundation\
Sabre’s security experts on the controls that make agentic AI safe to scale.
Learn more
Learn more about Secure AI isn’t a feature. It’s a foundation](https://www.sabre.com/resources/research/the-secure-ai-advantage/)
[
Resource
\
Agentic AI in travel, from theory to reality\
The practical blueprint behind Sabre’s approach to autonomous AI in travel.
Learn more
Learn more about Agentic AI in travel, from theory to reality](https://www.sabre.com/resources/research/the-agentic-blueprint/)
[
Resource
\
Why agentic AI will reshape travel\
The conversational commerce shift that travel brands can’t afford to miss.
Learn more
Learn more about Why agentic AI will reshape travel](https://www.sabre.com/resources/research/chat-as-the-new-influencer/)
[
Resource
\
Do direct connects deliver what they promise?\
Data from 117 million bookings on the gap between the promise and the reality.
Learn more
Learn more about Do direct connects deliver what they promise?](https://www.sabre.com/resources/research/direct-connects-vs-marketplaces/)
[
Resource
\
Too many systems. Not enough clarity.\
Global research reveals the hidden cost of managing too many systems and sources.
Learn more
Learn more about Too many systems. Not enough clarity.](https://www.sabre.com/resources/research/content-fragmentation-what-i-see-vs-what-i-take/)
Let’s get going