LAS VEGAS, Nov. 3, 2026 /PRNewswire / -- Red Rock Resorts, Inc. ("Red Rock Resorts," "we" or the "Company") (NASDAQ: RRR) today reported financial results for the third quarter ended September 30, 2026.
Third Quarter Results
Consolidated Operations
- Net revenues were $488.7 million for the third quarter of 2026, an increase of 2.8%, or $13.1 million, from $475.6 million in the same period of 2025.
- Net loss was $17.7 million for the third quarter of 2026, a decrease of 123.0%, or $94.6 million, from net income of $76.9 million in the same period of 2025, primarily as a result of $79.1 million in share-based compensation expense related to the Company's 50th anniversary stock awards issued in Q3 2026 and $6.9 million of one-time expenses related to the 50th anniversary.
- Adjusted EBITDA(1) was $182.6 million for the third quarter of 2026, a decrease of 4.3%, or $8.3 million, including $5.8 million of one-time expenses related to the 50th anniversary, from $190.9 million in the same period of 2025.
Las Vegas Operations
- Net revenues from Las Vegas operations were $479.1 million for the third quarter of 2026, an increase of 2.2%, or $10.5 million, from $468.6 million in the same period of 2025.
- Adjusted EBITDA from Las Vegas operations was $204.6 million for the third quarter of 2026, a decrease of 2.3%, or $4.8 million, from $209.4 million in the same period of 2025.
Native American
- Net revenues from Native American activities were $6.2 million for the third quarter of 2026, an increase of 59.0%, or $2.3 million, from $3.9 million in the same period of 2025.
- Adjusted EBITDA from Native American activities was $5.1 million for the third quarter of 2026, an increase of 30.8%, or $1.2 million, from $3.9 million in the same period of 2025.
50th Anniversary Expenses(2)
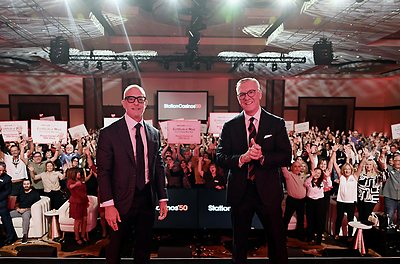
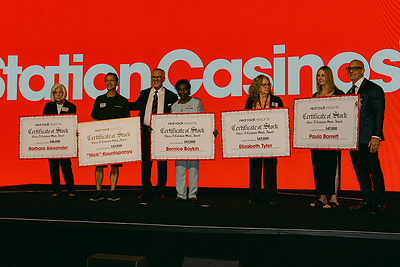
To commemorate the Company's 50th anniversary, stock awards were granted to substantially all full-time and part-time employees. As a result, the Company recognized $79.1 million of share-based compensation expense related to this grant during the quarter. In addition, the Company recognized $6.9 million of one-time expenses related to the 50th anniversary.
Balance Sheet Highlights
The Company's cash and cash equivalents at September 30, 2026 were $128.3 million and total principal amount of debt outstanding at the end of the third quarter was $3.7 billion.
Quarterly Dividend
The Company's Board of Directors has declared a cash dividend of $0.26 per Class A common share for the fourth quarter of 2026. The dividend will be payable on December 31, 2026 to all stockholders of record as of the close of business on December 15, 2026.
Prior to the payment of such dividend, Station Holdco LLC ("Station Holdco") will make a cash distribution to all unit holders of record, including the Company, of $0.26 per unit for a total distribution of approximately $29.2 million, approximately $17.3 million of which is expected to be distributed to the Company and approximately $11.9 million of which is expected to be distributed to the other unit holders of record of Station Holdco.
Conference Call Information
The Company will host a conference call today at 4:30 p.m. Eastern Time to discuss its financial results. The conference call will consist of prepared remarks from the Company and include a question and answer session. Those interested in participating in the call should dial (888) 317-6003, or (412) 317-6061 for international callers, approximately 15 minutes before the call start time. Please use the passcode: 6050941. A replay of the call will be available from today through November 10, 2026 at www.redrockresorts.com . A live audio webcast of the call will also be available at www.redrockresorts.com .
Presentation of Financial Information
| (1) | Adjusted EBITDA is a non-GAAP measure that is presented solely as a supplemental disclosure. We believe that Adjusted EBITDA is a widely used measure of operating performance in our industry and is a principal basis for valuation of gaming companies. We believe that in addition to net income, Adjusted EBITDA is a useful financial performance measurement for assessing our operating performance because it provides information about the performance of our ongoing core operations. Adjusted EBITDA for the three and nine months ended September 30, 2026 and 2025 includes net (loss) income plus depreciation and amortization, share-based compensation, write-downs and other, net (including gains and losses on asset disposals, preopening and development, business innovation and technology enhancements and non-routine items), interest expense, net, change in fair value of derivative instruments, gain on Native American development and (benefit) provision for income tax. | |
| (2) | Selected Operating Costs and Expenses Excluding 50th Anniversary is presented solely as a supplemental disclosure to provide comparability to prior periods by excluding one-time expenses associated with the 50th anniversary. |
Company Information and Forward Looking Statements
Red Rock Resorts is a holding company that owns an indirect equity interest in and manages Station Casinos LLC ("Station Casinos"). Station Casinos is the leading provider of gaming, hospitality and entertainment to the residents of Las Vegas, Nevada. Station Casinos' properties, which are located throughout the Las Vegas valley, are regional entertainment destinations and include hotels as well as various amenities, including numerous restaurants, entertainment venues, movie theaters, bowling and convention/banquet space, as well as traditional casino gaming offerings such as video poker, slot machines, table games, bingo and race and sports wagering. Station Casinos owns and operates Red Rock Casino Resort Spa, Green Valley Ranch Resort Spa Casino, Durango Resort & Casino, Palace Station Hotel & Casino, Boulder Station Hotel & Casino, Sunset Station Hotel & Casino, Santa Fe Station Hotel & Casino, Wildfire Rancho, Wildfire Boulder, Wildfire Sunset, Wildfire Valley View, Wildfire Anthem, Wildfire Lake Mead, Wildfire on Fremont and Seventy Six by Station Casinos (North Lamb, Aliante, Union Village, Tropicana, Fort Apache, Park Highlands, and Silverado Ranch). Station Casinos also owns a 50% interest in Barley's Casino & Brewing Company, Wildfire Casino & Lanes and The Greens.
This press release contains forward-looking statements within the meaning of Section 27A of the Securities Act of 1933, as amended, and Section 21E of the Securities Exchange Act of 1934, as amended. Such statements include, without limitation, statements regarding our expectations, hopes or intentions regarding the future. These forward-looking statements can often be identified by their use of words such as "will", "might", "predict", "continue", "forecast", "expect", "believe", "anticipate", "outlook", "could", "would", "target", "project", "intend", "plan", "seek", "estimate", "pursue", "should", "may" and "assume", or the negative thereof, as well as variations of such words and similar expressions referring to the future. Forward-looking statements involve certain risks and uncertainties, and actual results may differ materially from those discussed in any such statement. Certain important factors, including but not limited to, financial market risks, could cause our actual results to differ materially from those expressed in our forward-looking statements. Further information on potential factors which could affect our financial condition, results of operations and business includes, without limitation, the impact of rising inflation, higher interest rates and increased energy costs on consumer demand and the Company's business, financial results and liquidity; the impact of unemployment and changes in general economic conditions on discretionary spending and consumer demand; the impact of our substantial indebtedness; the effects of local and national economic, credit and capital market conditions on consumer spending and the economy in general, and on the gaming and hotel industries in particular; the effects of competition, including locations of competitors and operating and market competition; changes in laws, including increased tax rates, regulations or accounting standards, third-party relations and approvals, and decisions of courts, regulators and governmental bodies; risks associated with construction projects, including disruption of our operations, shortages of materials or labor, unexpected costs, unforeseen permitting or regulatory issues and weather; litigation outcomes and judicial actions, including gaming legislative action, referenda and taxation; acts of war or terrorist incidents, pandemics, natural disasters or civil unrest; risks associated with the collection and retention of data about our customers, employees, suppliers and business partners; and other risks discussed under the heading "Risk Factors" in the Company's Annual Report on Form 10-K for the fiscal year ended December 31, 2025, and in the Company's other current and periodic reports filed from time to time with the Securities and Exchange Commission. All forward-looking statements in this document are made based on information available to the Company as of the date hereof, and the Company assumes no obligation to update any forward-looking statement.
View source version on http://redrockresorts.investorroom.com/ :
Investors:
Stephen L. Cootey
[email protected]
(702) 495-4214
Media:
Michael J. Britt
[email protected]
(702) 495-3693
| Red Rock Resorts, Inc. | |||||||
| Condensed Consolidated Statements of Operations | |||||||
| (amounts in thousands, except per share data) | |||||||
| (unaudited) | |||||||
| Three Months Ended September 30, | Nine Months Ended September 30, | ||||||
| 2026 | 2025 | 2026 | 2025 | ||||
| Operating revenues: | |||||||
| Casino | $ 323,854 | $ 319,490 | $ 1,002,681 | $ 997,531 | |||
| Food and beverage | 88,248 | 85,523 | 271,604 | 269,169 | |||
| Room | 42,816 | 41,568 | 134,988 | 142,925 | |||
| Native American management and development fees | 6,191 | 3,894 | 14,734 | 13,902 | |||
| Other | 27,592 | 25,097 | 82,275 | 76,179 | |||
| Net revenues | 488,701 | 475,572 | 1,506,282 | 1,499,706 | |||
| Operating costs and expenses: | |||||||
| Casino | 115,550 | 83,263 | 297,019 | 266,538 | |||
| Food and beverage | 102,753 | 72,989 | 255,639 | 222,644 | |||
| Room | 21,777 | 15,557 | 53,226 | 47,487 | |||
| Other | 10,354 | 8,014 | 28,037 | 23,776 | |||
| Selling, general and administrative | 146,228 | 112,853 | 378,521 | 329,595 | |||
| Depreciation and amortization | 62,673 | 48,976 | 177,513 | 145,295 | |||
| Write-downs and other, net | 2,698 | 2,436 | 9,987 | 10,506 | |||
| 462,033 | 344,088 | 1,199,942 | 1,045,841 | ||||
| Operating income | 26,668 | 131,484 | 306,340 | 453,865 | |||
| Earnings from joint ventures | 737 | 655 | 2,081 | 1,977 | |||
| Operating income and earnings from joint ventures | 27,405 | 132,139 | 308,421 | 455,842 | |||
| Other (expense) income: | |||||||
| Interest expense, net | (50,894) | (50,486) | (150,043) | (152,228) | |||
| Change in fair value of derivative instruments | 4,505 | 1,846 | 8,558 | (5,653) | |||
| Gain on Native American development | — | — | — | 8,476 | |||
| (Loss) income before income tax | (18,984) | 83,499 | 166,936 | 306,437 | |||
| Benefit (provision) for income tax | 1,246 | (6,619) | (25,362) | (35,354) | |||
| Net (loss) income | (17,738) | 76,880 | 141,574 | 271,083 | |||
| Less: net (loss) income attributable to noncontrolling interests | (7,820) | 34,626 | 69,485 | 127,676 | |||
| Net (loss) income attributable to Red Rock Resorts, Inc. | $ (9,918) | $ 42,254 | $ 72,089 | $ 143,407 | |||
| (Loss) earnings per common share: | |||||||
| (Loss) earnings per share of Class A common stock, basic | $ (0.17) | $ 0.72 | $ 1.24 | $ 2.43 | |||
| (Loss) earnings per share of Class A common stock, diluted | $ (0.17) | $ 0.68 | $ 1.23 | $ 2.37 | |||
| Weighted-average common shares outstanding: | |||||||
| Basic | 58,065 | 59,019 | 58,052 | 59,060 | |||
| Diluted | 58,065 | 102,663 | 59,081 | 102,925 | |||
| Dividends declared per common share | $0.26 | $0.25 | $1.78 | $1.75 |
| Red Rock Resorts, Inc. | |||||||
| Segment Information and Reconciliation of Net (Loss) Income to Adjusted EBITDA | |||||||
| (amounts in thousands) | |||||||
| (unaudited) | |||||||
| Three Months Ended September 30, | Nine Months Ended September 30, | ||||||
| 2026 | 2025 | 2026 | 2025 | ||||
| Net revenues | |||||||
| Las Vegas operations | $ 479,131 | $ 468,576 | $ 1,481,811 | $ 1,476,791 | |||
| Native American | 6,191 | 3,894 | 14,734 | 13,902 | |||
| Corporate and other | 3,379 | 3,102 | 9,737 | 9,013 | |||
| Net revenues | $ 488,701 | $ 475,572 | $ 1,506,282 | $ 1,499,706 | |||
| Net (loss) income | $ (17,738) | $ 76,880 | $ 141,574 | $ 271,083 | |||
| Adjustments | |||||||
| Depreciation and amortization | 62,673 | 48,976 | 177,513 | 145,295 | |||
| Share-based compensation | 89,846 | 7,317 | 107,373 | 23,664 | |||
| Write-downs and other, net | 2,698 | 2,436 | 9,987 | 10,506 | |||
| Interest expense, net | 50,894 | 50,486 | 150,043 | 152,228 | |||
| Change in fair value of derivative instruments | (4,505) | (1,846) | (8,558) | 5,653 | |||
| Gain on Native American development | — | — | — | (8,476) | |||
| (Benefit) provision for income tax | (1,246) | 6,619 | 25,362 | 35,354 | |||
| Adjusted EBITDA | $ 182,622 | $ 190,868 | $ 603,294 | $ 635,307 | |||
| Adjusted EBITDA | |||||||
| Las Vegas operations | $ 204,598 | $ 209,407 | $ 664,549 | $ 684,751 | |||
| Native American | 5,069 | 3,894 | 10,803 | 13,902 | |||
| Corporate and other | (27,045) | (22,433) | (72,058) | (63,346) | |||
| Adjusted EBITDA | $ 182,622 | $ 190,868 | $ 603,294 | $ 635,307 |
| Red Rock Resorts, Inc. | |||||||
| Selected Operating Costs and Expenses Excluding 50th Anniversary | |||||||
| (amounts in thousands) | |||||||
| (unaudited) | |||||||
| Three Months Ended September 30, | Nine Months Ended September 30, | ||||||
| 2026 | 2025 | 2026 | 2025 | ||||
| Casino | $ 115,550 | $ 83,263 | $ 297,019 | $ 266,538 | |||
| Less one-time share-based compensation | 26,018 | — | 26,018 | — | |||
| Casino less one-time share-based compensation | $ 89,532 | $ 83,263 | $ 271,001 | $ 266,538 | |||
| Food and beverage | $ 102,753 | $ 72,989 | $ 255,639 | $ 222,644 | |||
| Less one-time share-based compensation | 26,250 | — | 26,250 | — | |||
| Food and beverage less one-time share-based compensation | $ 76,503 | $ 72,989 | $ 229,389 | $ 222,644 | |||
| Room | $ 21,777 | $ 15,557 | $ 53,226 | $ 47,487 | |||
| Less one-time share-based compensation | 5,919 | — | 5,919 | — | |||
| Room less one-time share-based compensation | $ 15,858 | $ 15,557 | $ 47,307 | $ 47,487 | |||
| Other | $ 10,354 | $ 8,014 | $ 28,037 | $ 23,776 | |||
| Less one-time share-based compensation | 1,313 | — | 1,313 | — | |||
| Other less one-time share-based compensation | $ 9,041 | $ 8,014 | $ 26,724 | $ 23,776 | |||
| Selling, general and administrative | $ 146,228 | $ 112,853 | $ 378,521 | $ 329,595 | |||
| Less one-time share-based compensation | 19,609 | — | 19,609 | — | |||
| Less other 50th anniversary expenses | 5,801 | — | 5,801 | — | |||
| Selling, general and administrative less one-time share-based compensation and other 50th anniversary expenses | $ 120,818 | $ 112,853 | $ 353,111 | $ 329,595 |
SOURCE Red Rock Resorts, Inc.
Information Request
INVESTOR HOTLINE
Red Rock Resorts
1505 S Pavilion Center Dr.
Las Vegas, NV 89135
E-mail Us or Call 702.495.3550
SIGN UP FOR RRR NEWS
Sign up to receive the latest information from Red Rock Resorts.
FOLLOW AND SHARE
© 2016 Red Rock Resorts
(opens in a new window)