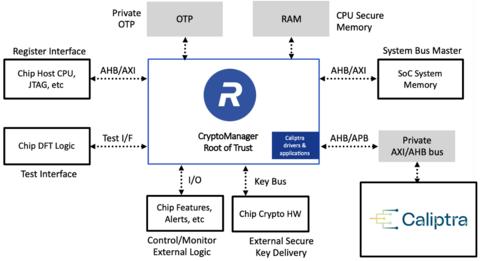
Rambus, Inc. is a fabless semiconductor company providing memory interface chips, silicon IP, and patent licensing services for data-intensive computing systems, with a focus on data center and artificial intelligence infrastructure. The company’s memory interface chip portfolio includes Registering Clock Drivers, Multiplexed Registering Clock Drivers, Multiplexed Data Buffers, Client Clock Drivers, Power Management Integrated Circuits, Serial Presence Detect Hubs, and Temperature Sensors for DDR5 and LPDDR5 modules in server and client systems. Its silicon IP offerings comprise high-speed memory and chip-to-chip digital controller IP, including HBM, GDDR, PCIe, and CXL controllers, as well as security IP solutions such as Hardware Roots of Trust, High-speed Protocol Engines, Crypto Cores, and Chip Provisioning Technologies. Rambus sells its products to memory module manufacturers, OEMs, hyperscalers, and chip makers worldwide for integration into custom silicon, Application Specific Standard Products, and Field Programmable Gate Array designs. The company also licenses its patent portfolio covering memory architecture, high-speed serial links, and security to semiconductor and system companies, including AMD, Broadcom, IBM, Micron, NVIDIA, Qualcomm, Samsung, and SK hynix. Rambus utilizes third-party foundries for fabrication, assembly, and testing while maintaining U.S.-based facilities for inspection and testing.

Summarised from the company's own disclosures, fiscal year ended Feb 2026

Industry Semiconductors Homepage rambus.com
Sector Technology IR page investor.rambus.com/investor-home/default.aspx
Tags
memory interface chips, silicon ip, patent licensing, data center infrastructure, ai infrastructure, ddr5, lpddr5, hbm, gddr, pcie, cxl, security ip, Registering Clock Drivers, Multiplexed Registering Clock Driver, Multiplexed Data Buffer, Client Clock Driver, Power Management Integrated Circuits, Serial Presence Detect Hubs, Temperature Sensors, HBM Memory Controller IP, GDDR Memory Controller IP, PCIe Controllers, Retimer and Switch IP, CXL Controller IP, Hardware Roots of Trust, High-speed Protocol Engines, Crypto Cores, Chip Provisioning Technologies
Press page rambus.com/newsroom

Metrics

Valuation  
Market cap $ 11.888B
Market cap (USD) $ 11.888B
P/E 45.68
PEG —
P/BV 8.38
P/S 14.93
P/OCF 34.28
P/FCF 37.99
Dividend yield —
Turnover / mcap —
Returns  
ROE 18.5%
ROI 19.2%
ROIC 17.7%
Profit margin 32.6%
Growth  
Revenue growing Yes
Profits growing No
Revenue up 3y Yes
Revenue up 5y Yes
Earnings growth 3y (net profit CAGR) —
Quality  
Profitable Yes
Margin expanding Yes
Buying back stock No
Diluting (TTM) No
Debt/Equity —
Podcast bulls (TTM) Sign up
Podcast bears (TTM) Sign up
Podcast sentiment (TTM) Sign up
Podcast sentiment % (TTM) Sign up
News sentiment (TTM) 38
Quality score 27.8%
Insiders  
Buys, 1w Sign up
Buys, 1m Sign up
Buys, 1y Sign up
Sells, 1w Sign up
Sells, 1m Sign up
Sells, 1y Sign up

Sign up to see this company's insider trades

Figure FY 2025 FY 2024 FY 2023 FY 2022 FY 2021 FY 2020 FY 2019 FY 2018 FY 2017 FY 2016 FY 2015 FY 2014 FY 2013 FY 2012 FY 2011 FY 2010 FY 2009 FY 2008 FY 2007 FY 2006 FY 2005 FY 2004 FY 2003 FY 2002 FY 2001 FY 2000
Revenue 707.63M 556.624M 461.117M 454.793M 328.304M 242.747M 224.027M 231.201M 393.096M 336.597M 296.278M 296.558M 271.501M 234.051M 312.363M 323.39M 113.007M 142.494M 179.94M 195.324M 157.198M — — 96.565M 117.16M —
Net profit 230.455M 179.821M 333.904M -14.31M 18.334M -43.609M -90.419M -157.957M -22.862M 6.82M 211.388M 26.201M -33.748M -134.336M -43.053M 150.917M -92.186M -195.923M -27.664M -13.816M 33.677M — — 24.704M 31.271M —
Free cash flow 333.177M 199.902M 172.546M 212.915M 195.425M 155.731M 122.063M 76.355M 108.052M 83.982M 70.31M 69.744M 44.404M -39.31M 33.561M 208.518M -43.257M -48.345M -458K 48.521M 25.226M — — 30.824M 16.984M 29.451M

Figure FY 2025 FY 2024 FY 2023 FY 2022 FY 2021 FY 2020 FY 2019 FY 2018 FY 2017 FY 2016 FY 2015 FY 2014 FY 2013 FY 2012 FY 2011 FY 2010 FY 2009 FY 2008 FY 2007 FY 2006 FY 2005 FY 2004 FY 2003 FY 2002 FY 2001 FY 2000
Share price 91.89 52.86 68.25 35.82 29.39 17.46 13.78 7.67 14.22 13.77 11.59 11.09 9.47 4.87 7.67 20.44 23.52 13.54 18.95 31.71 22.43 17.11 — — — —
Price performance 12m 0.74 -0.23 0.91 0.22 0.68 0.27 0.8 -0.46 0.03 0.19 0.05 0.17 0.95 -0.37 -0.62 -0.13 0.74 -0.29 -0.4 0.41 0.31 — — — — —

Filed figures

Figure Dec 2016 Dec 2017 Dec 2018 Dec 2019 Dec 2020 Dec 2021 Dec 2022 Dec 2023 Dec 2024 Dec 2025
Balance sheet detail
Trade receivables (USD) 21.1M 25.9M 50.9M 44M 27.9M 44.1M 55.4M 82.9M 123M 137M
↳ YoY growth +28.6% +22.7% +96.4% -13.4% -36.6% +57.9% +25.7% +49.8% +48.1% +11.9%
↳ 5y CAGR +83.1% +117.7% +86.6% +49.0% +11.2% +15.9% +16.4% +10.3% +22.8% +37.6%
Lease liabilities (USD) — — 0.00 46.2M 39M 35.1M 34.1M 30.7M 30.2M 25M
Cash and deposits (USD) 135M 226M 116M 102M 136M 108M 125M 94.8M 99.8M 183M
Intangible assets (USD) 132M 91.7M 59.9M 54.9M 36.5M 58.4M 50.9M 28.8M 17.1M 10.2M
Right-of-use assets (USD) — — 0.00 37M 28.7M 23.7M 24.1M 21.5M 21.5M 17.1M
Cash flow detail
Operating cash flow (USD) 92.5M 117M 87.1M 129M 185M 209M 230M 196M 231M 360M
Purchases of property, plant and equipment (USD) -8.56M -9.39M -10.8M -6.47M -29.7M -13.8M -17.5M -23.2M -30.7M -26.8M
Purchases of intangible assets (USD) 0.00 -120,000 -350,000 0.00 0.00 0.00 -3M 0.00 0.00 —
Change in receivables (cash effect) (USD) 5.8M -1.11M -24.9M 4.99M 16.1M -13.5M -9.27M -28.9M -39.8M -14.7M
Change in inventories (cash effect) (USD) 1.75M 473,000 -1.86M -3.35M -4.38M 6.11M -12.7M -15.3M -8.48M 536,000
Change in payables (cash effect) (USD) 2.37M -651,000 -2.27M 2.93M -2.18M 2.2M 12M -5.77M 580,000 11.4M
Share buybacks (cash effect) (USD) 0.00 -50M -50M 0.00 -50.1M -100M -100M -101M -113M -7.11M
Interest paid (cash effect) (USD) -1.55M -1.55M -3.04M -2.37M -2.37M -2.37M -1.53M -73,000 0.00 0.00
Income taxes paid (cash effect) (USD) -26.8M -22.7M -23.6M -17.8M -21.3M -22.8M -25.3M -25.9M -27.1M -25M
Share-based compensation (USD) 21M 27.4M 21.7M 26.5M 25.8M 27.5M 35.6M 45M 44.9M 54.3M
Operating cash flow before change in receivables (USD) 86.7M 119M 112M 124M 169M 223M 240M 225M 270M 375M
Free cash flow (OCF - PPE - intangibles) (USD) 84M 108M 76M 122M 156M 195M 210M 173M 200M 333M
Income detail
Research and development expense (USD) 130M 149M 158M 157M 140M 136M 159M 157M 163M 188M
↳ 5y CAGR +2.3% +1.2% +6.1% +7.3% +4.7% +0.9% +1.3% -0.2% +0.8% +6.1%
Total comprehensive income (USD) -7.06M -14.5M -163M -80.2M -43.6M 17M -17.8M 338M 180M 232M
Comprehensive income to owners (USD) -7.06M -14.5M -163M -80.2M -43.6M 17M -17.8M 338M 180M 232M
Reported Feb 23, 2018 Feb 23, 2018 May 3, 2019 Feb 26, 2020 Feb 26, 2021 Feb 24, 2023 Feb 24, 2023 Feb 23, 2024 Feb 24, 2025 Feb 18, 2026

Sign up to see institutional holdings

Sign Up

Podcast Mentions

Sign up to see podcast mentions and sentiment

Sign Up

Rambus Reports Third Quarter 2026 Financial Results Bull 5 Bear 0 Results

October 26, 2026

  • Record quarterly revenue of $218.3 million, up 22% year over year, exceeding guidance range
  • GAAP diluted earnings per share of $0.69 and non-GAAP diluted earnings per share of $0.84, exceeding guidance range
  • Record product revenue of $114.3 million, up 15% quarter over quarter and 22% year over year
  • Expanded product and IP offerings for next-generation AI systems, including industry-leading PMIC for LPDDR6 SOCAMM2 and data center-class Root of Trust security IP

SAN JOSE, Calif.--(BUSINESS WIRE)-- Rambus Inc. (NASDAQ:RMBS), a provider of industry-leading chips and IP making data faster and safer, today reported financial results for the third quarter ended September 30, 2026. Total revenue for the third quarter was $218.3 million, product revenue was $114.3 million, royalties revenue was $77.0 million and contract and other revenue was $27.0 million. GAAP diluted earnings per share was $0.69 and non-GAAP diluted earnings per share was $0.84. The Company also generated a record $102.5 million of cash from operating activities in the third quarter.

Management Commentary

“Rambus delivered record quarterly revenue and earnings that exceeded our guidance, with strong customer demand driving record product revenue and record cash from operations,” said Luc Seraphin, president and chief executive officer of Rambus. “We continue to expand our product and IP offerings to address the growing performance requirements of next-generation AI and data center infrastructure. Through ongoing execution on our roadmap and accelerating demand for our differentiated solutions, we expect an even stronger performance in Q4 and are well positioned to deliver long-term profitable growth and value for our stockholders.”

GAAP Non-GAAP(1)
Quarterly Financial Review Three Months EndedSeptember 30, Three Months EndedSeptember 30,
(In millions, except percentages and per share amounts) 2026 2025 2026 2025
Revenue
Product revenue $ 114.3 $ 93.3 $ 114.3 $ 93.3
Royalties revenue 77.0 65.1 77.0 65.1
Contract and other revenue 27.0 20.1 27.0 20.1
Total revenue 218.3 178.5 218.3 178.5
Cost of product revenue 45.5 34.3 45.3 34.2
Cost of contract and other revenue 0.8 0.5 0.8 0.5
Amortization of acquired intangible assets (included in total cost of revenue) 1.1 1.7 — —
Total operating expenses 87.3 78.7 70.0 64.6
Operating income $ 83.6 $ 63.3 $ 102.2 $ 79.2
Operating margin 38 % 35 % 47 % 44 %
Net income $ 74.6 $ 48.4 $ 91.7 $ 68.2
Diluted earnings per share $ 0.69 $ 0.44 $ 0.84 $ 0.62
_______________
(1) See “Supplemental Reconciliation of GAAP to Non-GAAP Results” table included below. Note that the applicable non-GAAP measures are presented and that revenue is solely presented on a GAAP basis.

GAAP revenue for the quarter was $218.3 million, which exceeded the Company's guidance range of $210 million to $216 million. The Company had product revenue of $114.3 million, royalties revenue of $77.0 million and contract and other revenue of $27.0 million.

The Company had total GAAP cost of revenue of $47.4 million and operating expenses of $87.3 million. The Company also had total non-GAAP operating expenses of $116.1 million (including non-GAAP cost of revenue of $46.1 million). The Company had GAAP diluted earnings per share of $0.69 and non-GAAP diluted earnings per share of $0.84. The Company’s basic share count was 108 million shares and its diluted share count was 109 million shares.

Cash, cash equivalents, and marketable securities as of September 30, 2026 were $776.9 million, a decrease of $48.0 million as compared to June 30, 2026, mainly due to $135.4 million paid for repurchases of common stock and $11.2 million paid for capital expenditures, partially offset by $102.5 million cash provided by operating activities.

2026 Fourth Quarter Outlook

(In millions, except per share amounts) GAAP Non-GAAP(1)
Revenue $227 - $233 $227 - $233
Product revenue $127 - $133 $127 - $133
Royalties revenue $68 - $74 $68 - $74
Contract and other revenue $26 - $32 $26 - $32
Total operating costs and expenses (2) $143 - $139 $124 - $120
Diluted earnings per share $0.68 - $0.76 $0.84 - $0.92
_______________
(1) See “Reconciliation of GAAP Forward-Looking Estimates to Non-GAAP Forward-Looking Estimates” table included below. Note that the applicable non-GAAP measures are presented and that revenue is solely presented on a GAAP basis.
(2) Total operating costs and expenses include cost of sales and operating expenses.

For the fourth quarter of 2026, the Company expects revenue to be between $227 million and $233 million. The Company also expects product revenue to be between $127 million and $133 million, royalties revenue to be between $68 million and $74 million, and contract and other revenue to be between $26 million and $32 million. Revenue is not without risk and achieving revenue in this range will require that the Company sign customer agreements for various product sales and solutions licensing, among other matters.

The Company also expects GAAP operating costs and expenses to be between $143 million and $139 million and non-GAAP operating costs and expenses to be between $124 million and $120 million. The Company expects interest and other income to be $6.5 million. These expectations also assume a GAAP tax rate of 17.5%, a non-GAAP tax rate of 16% and a diluted share count of 109 million shares, and exclude stock-based compensation expense of $18.2 million, amortization of acquired intangible assets of $1.0 million and other one-time adjustments of ($0.2) million.

Additionally, the Company expects GAAP diluted earnings per share to be between $0.68 and $0.76 and non-GAAP diluted earnings per share to be between $0.84 and $0.92.

Conference Call

The Company’s management will discuss the results of the quarter during a conference call scheduled for 2:00 p.m. PT today. The call will be audio, slides will be available online at investor.rambus.com, and a replay will be available for the next week at the following numbers: (833) 309-1852 (domestic) or +44 800-007-4044 (international) with ID# 254362271.

Non-GAAP Financial Information

In the commentary set forth above and in the financial statements included in this earnings release, the Company presents the following non-GAAP financial measures: cost of product revenue, operating expenses, operating income, gross margin, operating margin, net income and diluted net income per share (diluted earnings per share). In computing each of these non-GAAP financial measures, the following items were considered as discussed below: stock-based compensation expense, restructuring charges, amortization of acquired intangible assets, facility closure costs, income tax adjustment, and certain other one-time adjustments. The non-GAAP financial measures disclosed by the Company should not be considered a substitute for, or superior to, financial measures calculated in accordance with GAAP, and the financial results calculated in accordance with GAAP and reconciliations from these results should be carefully evaluated. Management believes the non-GAAP financial measures are appropriate for both its own assessment of, and to show investors, how the Company’s performance compares to other periods. The non-GAAP financial measures used by the Company may be calculated differently from, and therefore may not be comparable to, similarly titled measures used by other companies. A reconciliation from GAAP to non-GAAP results is included in the financial statements contained in this release.

The Company’s non-GAAP financial measures reflect adjustments based on the following items:

Stock-based compensation expense. These expenses primarily relate to employee stock purchase plans, and employee non-vested equity stock and non-vested stock units. The Company excludes stock-based compensation expense from its non-GAAP measures primarily because such expenses are non-cash expenses that the Company does not believe are reflective of ongoing operating results. Additionally, given the fact that other companies may grant different amounts and types of equity awards and may use different valuation assumptions, excluding stock-based compensation expense permits more accurate comparisons of the Company’s results with peer companies.

Restructuring charges. These charges include severance, exit costs and other related costs. The Company excludes these charges because such charges are not directly related to ongoing business results and do not reflect expected future operating expenses.

Amortization of acquired intangible assets. The Company incurs expenses for the amortization of intangible assets acquired in acquisitions. The Company excludes these items because these expenses are not reflective of ongoing operating results in the period incurred. These amounts arise from the Company’s prior acquisitions and have no direct correlation to the operation of the Company’s core business.

Facility closure costs. These charges consist of exit costs associated with building leases that were abandoned. The Company excludes these charges because such charges are not directly related to ongoing business results and do not reflect expected future operating expenses.

Income tax adjustment. For purposes of internal forecasting, planning and analyzing future periods that assume net income from operations, the Company estimates a fixed, long-term projected tax rate of approximately 16 percent and 20 percent for 2026 and 2025, respectively, which consists of estimated U.S. federal and state tax rates, and excludes tax rates associated with certain items such as withholding tax, tax credits, deferred tax asset valuation allowance and the release of any deferred tax asset valuation allowance. Accordingly, the Company has applied these tax rates to its non-GAAP financial results for all periods in the relevant years to assist the Company’s planning.

On occasion in the future, there may be other items, such as significant gains or losses from contingencies, that the Company may exclude in deriving its non-GAAP financial measures if it believes that doing so is consistent with the goal of providing useful information to investors and management.

About Rambus Inc.

Rambus delivers industry-leading chips and silicon IP for data-intensive computing systems, focusing on data center and AI infrastructure. With over three decades of advanced semiconductor experience, our products and technologies address the critical bottlenecks between memory and processing to accelerate data-intensive workloads. By enabling greater bandwidth, efficiency and security across next-generation computing platforms, we make data faster and safer. For more information, visit rambus.com .

Forward-Looking Statements

This release contains forward-looking statements under the Private Securities Litigation Reform Act of 1995, including those relating to Rambus’ expectations regarding business opportunities, the Company’s ability to deliver long-term, profitable growth, product and investment strategies, and the Company’s outlook and financial guidance for the fourth quarter of 2026 and related drivers, and the Company’s ability to effectively manage market challenges. Such forward-looking statements are based on current expectations, estimates and projections, management’s beliefs and certain assumptions made by the Company’s management. Actual results may differ materially. The Company’s business generally is subject to a number of risks which are described more fully in Rambus’ periodic reports filed with the Securities and Exchange Commission. The Company undertakes no obligation to update forward-looking statements to reflect events or circumstances after the date hereof.

Rambus Inc.Condensed Consolidated Balance Sheets(Unaudited)
(In thousands) September 30,2026 December 31,2025
ASSETS
Current assets:
Cash and cash equivalents $ 110,531 $ 182,826
Marketable securities 666,376 579,005
Accounts receivable 142,149 137,476
Unbilled receivables 26,818 25,209
Inventories 87,235 44,098
Prepaids and other current assets 18,323 20,202
Total current assets 1,051,432 988,816
Intangible assets, net 5,711 10,171
Goodwill 286,812 286,812
Property and equipment, net 107,918 113,051
Operating lease right-of-use assets 13,702 17,112
Deferred tax assets 86,500 105,542
Other assets 6,157 8,041
Total assets $ 1,558,232 $ 1,529,545
LIABILITIES & STOCKHOLDERS’ EQUITY
Current liabilities:
Accounts payable $ 23,349 $ 35,915
Accrued salaries and benefits 20,372 22,044
Deferred revenue 32,391 29,980
EDA tools software licenses liability 14,795 14,884
Operating lease liabilities 5,645 6,310
Other current liabilities 15,543 11,441
Total current liabilities 112,095 120,574
Long-term operating lease liabilities 14,572 18,671
Long-term EDA tools software licenses liability 9,053 20,908
Other long-term liabilities 4,781 4,967
Total long-term liabilities 28,406 44,546
Total stockholders’ equity 1,417,731 1,364,425
Total liabilities and stockholders’ equity $ 1,558,232 $ 1,529,545
Rambus Inc.Condensed Consolidated Statements of Income(Unaudited)
Three Months EndedSeptember 30, Nine Months EndedSeptember 30,
(In thousands, except per share amounts) 2026 2025 2026 2025
Revenue:
Product revenue $ 114,315 $ 93,342 $ 301,471 $ 250,976
Royalties 76,958 65,120 230,861 207,702
Contract and other revenue 27,016 20,051 73,531 58,708
Total revenue 218,289 178,513 605,863 517,386
Cost of revenue:
Cost of product revenue 45,458 34,337 118,762 97,338
Cost of contract and other revenue 753 531 2,659 1,708
Amortization of acquired intangible assets 1,164 1,724 4,459 5,158
Total cost of revenue 47,375 36,592 125,880 104,204
Gross profit 170,914 141,921 479,983 413,182
Operating expenses:
Research and development 49,355 49,511 150,683 138,462
Sales, general and administrative 37,684 29,155 107,616 85,328
Restructuring charges 223 — 3,543 —
Total operating expenses 87,262 78,666 261,842 223,790
Operating income 83,652 63,255 218,141 189,392
Interest income and other income (expense), net 7,162 6,327 21,373 16,411
Interest expense (279 ) (294 ) (860 ) (1,053 )
Interest and other income (expense), net 6,883 6,033 20,513 15,358
Income before income taxes 90,535 69,288 238,654 204,750
Provision for income taxes 15,970 20,911 36,626 38,135
Net income $ 74,565 $ 48,377 $ 202,028 $ 166,615
Net income per share:
Basic $ 0.69 $ 0.45 $ 1.87 $ 1.55
Diluted $ 0.69 $ 0.44 $ 1.84 $ 1.53
Weighted-average shares used in per share calculations:
Basic 107,644 107,622 108,032 107,483
Diluted 108,788 109,304 109,552 108,962
Rambus Inc.Supplemental Reconciliation of GAAP to Non-GAAP Results(Unaudited)
Three Months EndedSeptember 30,
(In thousands, except per share amounts) 2026 2025
Cost of product revenue $ 45,458 $ 34,337
Adjustment:
Stock-based compensation expense (185 ) (180 )
Non-GAAP cost of product revenue $ 45,273 $ 34,157
Total operating expenses $ 87,262 $ 78,666
Adjustments:
Stock-based compensation expense (16,936 ) (14,026 )
Restructuring charges (223 ) —
Facility closure costs (78 ) —
Non-GAAP total operating expenses $ 70,025 $ 64,640
Operating income $ 83,652 $ 63,255
Adjustments:
Stock-based compensation expense 17,121 14,206
Amortization of acquired intangible assets 1,164 1,724
Restructuring charges 223 —
Facility closure costs 78 —
Non-GAAP total operating income $ 102,238 $ 79,185
Net income $ 74,565 $ 48,377
Stock-based compensation expense 17,121 14,206
Amortization of acquired intangible assets 1,164 1,724
Restructuring charges 223 —
Facility closure costs 78 —
Income tax adjustment (1,489 ) 3,867
Non-GAAP net income $ 91,662 $ 68,174
Non-GAAP diluted earnings per share $ 0.84 $ 0.62
Weighted-average shares used in non-GAAP diluted per share calculation 108,788 109,304
Rambus Inc.Reconciliation of GAAP Forward-Looking Estimates to Non-GAAP Forward-Looking Estimates(Unaudited)
2026 Fourth Quarter Outlook Three Months EndedDecember 31, 2026
(In millions, except per share amounts) Low High
Forward-looking operating costs and expenses $ 143.0 $ 139.0
Adjustments:
Stock-based compensation expense (18.2 ) (18.2 )
Amortization of acquired intangible assets (1.0 ) (1.0 )
Other 0.2 0.2
Forward-looking Non-GAAP operating costs and expenses $ 124.0 $ 120.0
Forward-looking net income $ 74.7 $ 82.9
Adjustments:
Stock-based compensation expense 18.2 18.2
Amortization of acquired intangible assets 1.0 1.0
Other (0.2 ) (0.2 )
Income tax adjustment (1.7 ) (1.5 )
Forward-looking Non-GAAP net income $ 92.0 $ 100.4

Sumeet Gagneja
Senior Vice President and Chief Financial Officer
(408) 462-8000
[email protected]

Source: Rambus Inc.

View All News

Email Alert Sign Up Confirmation

Company

Investor Contact

Subscribe to Email Alerts

To receive notifications via email, enter your email address and select at least one subscription below. After submitting your information, you will receive an email. You must click the link in the email to activate your subscription. You can sign up for additional subscriptions at any time.

* Required

Email Address * Mailing Lists *

Press Release
SEC Filing
Presentation
Event
End of Day Stock Quote
Captcha
Enter the code shown above.
*

Copyright © 2026 Rambus.com. All Rights Reserved. Privacy Policy |Trademark & Guidelines

  • Facebook icon

  • Twitter icon

  • YouTuve icon

  • LinkedIn icon

  • Blog icon

Powered By Q4 Inc. 5.92.0.9 (opens in new window)

Rambus and ChipAgents Collaborate to Accelerate Chip Design with Agentic AI

Strategic partnership combines Rambus deep semiconductor and silicon IP expertise with ChipAgents tool-agnostic, AI-native chip design platform to improve chip design speed and productivity

  • Rambus adopts ChipAgents agentic AI platform to accelerate its own chip and IP design and verification workflows
  • The partnership brings together tailored Rambus silicon IP and ChipAgents’ agentic AI capabilities to speed up chip design and IP integration across customer-preferred design environments
  • Rambus becomes a strategic investor in ChipAgents, reflecting shared commitment to advancing AI-driven chip design

SAN JOSE and SANTA CLARA, Calif. — Oct. 22, 2026 — Rambus Inc. (NASDAQ: RMBS), a provider of industry-leading chips and silicon IP making data faster and safer, and ChipAgents, a leader in agentic AI platforms for chip design, today announced a multi-faceted strategic agreement to accelerate chip design with agentic AI. As part of the agreement, Rambus is adopting the ChipAgents platform companywide, including deployment across its chip and silicon IP design and verification workflows to accelerate the pace of development. The companies will also collaborate to leverage Rambus’ deep semiconductor expertise and ChipAgents’ agentic AI platform and agentic workflows to enable greater speed and Quality of Results (QoR) in our customers’ chip design process across their preferred design environments. In addition, Rambus has become a strategic investor in ChipAgents, reflecting its confidence in the growing role of AI-native engineering in the future of chip design.

“AI is creating a virtuous cycle of innovation, driving demand for more advanced chips and increasingly complex systems while transforming the way those chips are designed,” said Luc Seraphin, president and chief executive officer of Rambus. “ChipAgents is a fellow industry pioneer and a leader in agentic AI for chip design, making the company a strong strategic investment for Rambus. By adopting the ChipAgents platform, we see opportunities to accelerate the pace of chip and IP development, enhance engineering productivity, and strengthen our long-term position in AI and data-center infrastructure.”

“Rambus has decades of semiconductor chip expertise and a broad portfolio of mission-critical silicon IP for state-of-the-art SoC designs,” said William Wang, founder and chief executive officer of ChipAgents. “Together, we see an opportunity to move beyond automating individual tasks to a more holistic, AI-native approach to chip design. By combining Rambus’ design and IP expertise with our agentic AI platform, we aim to help engineering teams move more efficiently from design intent through silicon implementation while preserving their choice of tools and technologies.”

“Agentic AI can revolutionize complex chip and IP design delivering dramatic benefits in engineering productivity and reduced time to market,” said Simon Blake-Wilson, senior vice president and general manager of Silicon IP at Rambus. “We are excited to adopt the ChipAgents platform across Rambus and apply agentic AI to our chip and silicon IP development workflows. We look forward to working together to drive greater value for our mutual customers by advancing the chip design and IP integration process.”

About Rambus Inc.
Rambus delivers industry-leading chips and silicon IP for the data center and AI infrastructure. With over three decades of advanced semiconductor experience, our products and technologies address the critical bottlenecks between memory and processing to accelerate data-intensive workloads. By enabling greater bandwidth, efficiency and security across next generation computing platforms, we make data faster and safer. For more information, visit rambus.com .

**About ChipAgents
**ChipAgents is an Agentic AI platform that transforms specifications and code into production-ready RTL, verification assets, and automated root-cause analysis, dramatically shortening design and verification cycles. Founded in 2024, the company brings autonomous AI Agents into production semiconductor workflows, serving both design and verification engineers and embedded systems teams at leading semiconductor companies worldwide. The company is headquartered in Santa Clara, California. For more information, visit chipagents.ai .

Forward-looking statements
Information set forth in this press release, including statements as to Rambus’ outlook and financial estimates and statements as to the expected timing and effects of Rambus products, constitute forward-looking statements within the meaning of the safe harbor provisions of the Private Securities Litigation Reform Act of 1995.

These statements are based on various assumptions and the current expectations of the management of Rambus and may not be accurate because of risks and uncertainties surrounding these assumptions and expectations. Factors listed below, as well as other factors, may cause actual results to differ significantly from these forward-looking statements. There is no guarantee that any of the events anticipated by these forward-looking statements will occur, or what effect they will have on the operations or financial condition of Rambus. Forward-looking statements included herein are made as of the date hereof, and Rambus undertakes no obligation to publicly update or revise any forward-looking statement unless required to do so by federal securities laws.

Major risks, uncertainties and assumptions include, but are not limited to: any statements regarding anticipated operational and financial results; any statements of expectation or belief; other factors described under “Risk Factors” in Rambus’ Annual Report on Form 10-K and Quarterly Reports on Form 10-Q; and any statements of assumptions underlying any of the foregoing. It is not possible to predict or identify all such factors. Consequently, while the list of factors presented here is considered representative, no such list should be considered to be a complete statement of all potential risks and uncertainties.

Press Contacts:
Cori Pasinetti
Rambus Corporate Communications
T: (650) 309-6226
[email protected]

Matt Stubbs
Voxus PR for ChipAgents
T: (801) 703-6626
[email protected]

Footer

Company

Products

Markets

Resources

Copyright © 2026 Rambus.com. All Rights Reserved. Privacy Policy | Trademark & Guidelines

  • YouTube icon

  • LinkedIn icon

  • Blog icon

Rambus logo

× Close Panel

October 13, 2026

New PMIC expands the Rambus family of LPDDR-based server module solutions and builds on the company’s leadership in advanced server-memory power management

  • Designed to enable upcoming low-power, high-performance LPDDR6 SOCAMM2 
  • Delivers enhanced power efficiency to scale tokens per watt for AI workloads
  • Architected in technical cooperation with customers and ecosystem partners to advance future-generation accelerated AI infrastructure

SAN JOSE, Calif.--(BUSINESS WIRE)-- Rambus Inc. (NASDAQ: RMBS), a premier chip and silicon IP provider making data faster and safer, today announced an industry-leading Power Management IC (PMIC) designed to enable low-power, high-performance LPDDR6 Small Outline Compression Attached Memory Modules (SOCAMM2). Developed in technical cooperation with customers and ecosystem partners to support future-generation accelerated AI infrastructure, the PMIC expands the Rambus family of LPDDR-based server module chips and extends Rambus leadership in advanced server memory products.

As AI training and inference workloads scale, the need for higher throughput within a given power envelope, measured in tokens per watt, is a critical consideration for AI infrastructure. This is driving demand for purpose-built memory solutions optimized for power efficiency, form factor and scalability. SOCAMM2 brings the power and performance benefits of LPDDR technology to a compact, modular and serviceable server-memory architecture designed for demanding AI systems. LPDDR6 SOCAMM2, in development now, represents the next important evolution in LPDDR-based server memory technology.

“Inference and agentic AI are driving exciting new opportunities for memory innovation across the data center,” said Rami Sethi, senior vice president and general manager of Memory Interface Chips at Rambus. “Our new PMIC designed for LPDDR6 SOCAMM2 builds on our leadership in server-memory power management. Working closely with industry leaders in alignment with the broader AI ecosystem, we are helping enable the high-performance, power-efficient memory architectures that maximize tokens per watt for AI workloads.”

“As AI systems place growing demands on memory capacity, bandwidth and power efficiency, LPDRAM is becoming an increasingly important technology for next-generation AI infrastructure,” said Praveen Vaidyanathan, vice president and general manager of Cloud Memory Products at Micron Technology. “Micron has helped pioneer low-power memory for the data center and continues to work closely with ecosystem partners to advance industry standards such as SOCAMM2. We welcome Rambus' continued investment in LPDDR6 power management solutions, which help strengthen the broader low-power memory ecosystem.”

Building on Rambus Server Memory Power Management Leadership

Rambus provides complete memory interface chipsets for DDR- and LPDDR-based memory modules, including registering clock drivers (RCDs), PMICs, voltage regulators, SPD Hubs and temperature sensors. The company continues to advance its memory module chipset roadmaps for high-volume CPU-based servers while expanding its portfolio to address emerging memory architectures for accelerated AI infrastructure.

Rambus offers a complete LPDDR5X SOCAMM2 chipset, which provides the power delivery, configuration and telemetry functions required by the current-generation SOCAMM2. Building on this chipset strategy, the new PMIC, along with the Rambus SPD Hub, extend the LPDDR-based module roadmap to support the evolving requirements of the upcoming LPDDR6 SOCAMM2.

Optimized for the dynamic workload conditions of future AI systems, the PMIC and SPD Hub designed for LPDDR6 SOCAMM2 provide efficient and precise module-level power management, including advanced power conversion, sequencing, telemetry and fault protection. The PMIC efficiently steps down the system voltage supply to the voltage levels needed to power the LPDDR6 DRAM and all other active chips on the module. These capabilities help support the performance, reliability and power efficiency required for next-generation accelerated computing platforms.

Availability

The Rambus PMIC designed for LPDDR6 SOCAMM2 is currently sampling to lead customers.

More Information:

Learn more about the Rambus SOCAMM2 server module chipset at https://www.rambus.com/memory-interface-chips/socamm2-server-chipset/ .

Follow Rambus:
Company website: rambus.com

Rambus blog: rambus.com/blog

LinkedIn: www.linkedin.com/company/rambus

About Rambus Inc.

Rambus delivers industry-leading chips and silicon IP for the data center and AI infrastructure. With over three decades of advanced semiconductor experience, our products and technologies address the critical bottlenecks between memory and processing to accelerate data-intensive workloads. By enabling greater bandwidth, efficiency and security across next generation computing platforms, we make data faster and safer. For more information, visit rambus.com .

Source: Rambus Inc.

Forward-looking statements

Information set forth in this press release, including statements as to Rambus’ outlook and financial estimates and statements as to the expected timing and effects of Rambus products, constitute forward-looking statements within the meaning of the safe harbor provisions of the Private Securities Litigation Reform Act of 1995.

These statements are based on various assumptions and the current expectations of the management of Rambus and may not be accurate because of risks and uncertainties surrounding these assumptions and expectations. Factors listed below, as well as other factors, may cause actual results to differ significantly from these forward-looking statements. There is no guarantee that any of the events anticipated by these forward-looking statements will occur, or what effect they will have on the operations or financial condition of Rambus. Forward-looking statements included herein are made as of the date hereof, and Rambus undertakes no obligation to publicly update or revise any forward-looking statement unless required to do so by federal securities laws.

Major risks, uncertainties and assumptions include, but are not limited to: any statements regarding anticipated operational and financial results; any statements of expectation or belief; other factors described under “Risk Factors” in Rambus’ Annual Report on Form 10-K and Quarterly Reports on Form 10-Q; and any statements of assumptions underlying any of the foregoing. It is not possible to predict or identify all such factors. Consequently, while the list of factors presented here is considered representative, no such list should be considered to be a complete statement of all potential risks and uncertainties.

Press Contact:
Cori Pasinetti
Rambus Corporate Communications
t: (650) 309-6226
[email protected]

Source: Rambus Inc.

View All News

Email Alert Sign Up Confirmation

Company

Investor Contact

Subscribe to Email Alerts

To receive notifications via email, enter your email address and select at least one subscription below. After submitting your information, you will receive an email. You must click the link in the email to activate your subscription. You can sign up for additional subscriptions at any time.

* Required

Email Address * Mailing Lists *

Press Release
SEC Filing
Presentation
Event
End of Day Stock Quote
Captcha
Enter the code shown above.
*

Copyright © 2026 Rambus.com. All Rights Reserved. Privacy Policy |Trademark & Guidelines

  • Facebook icon

  • Twitter icon

  • YouTuve icon

  • LinkedIn icon

  • Blog icon

Powered By Q4 Inc. 5.92.0.9 (opens in new window)

Prompts

Rambus, Inc. (ticker RMBS), listed in United States.

ETFs Holding Rambus, Inc.

ETF Weight in ETF Shares Market value As of
CSMD 2.72% 135,487 $ 12.333M Jul 31, 2026
CEPI 1.43% 17,330 $ 1.578M Jul 31, 2026
RSMC 1.37% 129,058 $ 10.059M Nov 17, 2026
TMSL 0.88% 178,234 $ 23.659M Jun 30, 2026
CLSE short -0.83% -86,002 $ -7.456M Aug 31, 2026
PSC 0.79% 139,311 $ 18.492M Jun 30, 2026
JSMD 0.77% 88,763 $ 8.08M Jul 31, 2026
FSEG 0.71% 306 $ 40.618K Jun 30, 2026
IVSS 0.63% 1,283 $ 170.305K Jun 30, 2026
ILDR 0.61% 25,000 $ 1.949M Nov 16, 2026
MSSM 0.42% 34,380 $ 2.98M Aug 31, 2026
MMSC 0.37% 2,390 $ 186.277K Nov 16, 2026
BTAL short -0.36% -7,590 $ -1.007M Jun 30, 2026
SCDS 0.31% 359 $ 28.26K Nov 17, 2026
FTQI 0.24% 28,959 $ 2.257M Nov 16, 2026
SEIS 0.24% 10,469 $ 1.39M Jun 30, 2026
SMDX 0.20% 3,276 $ 255.331K Nov 17, 2026
MCDS 0.19% 188 $ 14.799K Nov 17, 2026
DFAS 0.19% 731,695 $ 62.172M Nov 12, 2026
BALQ 0.18% 995 $ 77.55K Nov 16, 2026
VFQY 0.16% 9,402 $ 815.059K Aug 31, 2026
RUSC 0.16% 930 $ 123.448K Jun 30, 2026
JSTC 0.14% 5,444 $ 424.305K Nov 17, 2026
JMEE 0.13% 47,865 $ 3.768M Nov 17, 2026
SYZ 0.12% 611 $ 81.104K Jun 30, 2026
INFO 0.10% 8,023 $ 659.731K Nov 13, 2026
AVMC 0.09% 6,325 $ 492.971K Nov 16, 2026
TACU 0.06% 145 $ 11.301K Nov 17, 2026
INRO 0.05% 4,137 $ 322.438K Nov 16, 2026
FESM 0.04% 15,856 $ 2.105M Jun 30, 2026
DFSU 0.03% 8,242 $ 700.323K Nov 12, 2026
DCOR 0.03% 135,331 $ 11.499M Nov 12, 2026
DFAC 0.03% 259,947 $ 22.088M Nov 12, 2026
JMID 0.02% 52 $ 4,733.56 Jul 31, 2026
AVSU 0.02% 1,368 $ 106.622K Nov 16, 2026
AVLC 0.02% 3,241 $ 252.604K Nov 16, 2026
DFAU 0.01% 22,004 $ 1.87M Nov 12, 2026
DFUS 0.01% 35,818 $ 3.043M Nov 12, 2026
EBI 0.01% 1,021 $ 88.51K Aug 31, 2026
AVUS 0.01% 18,775 $ 1.463M Nov 16, 2026
IETC 0.01% 515 $ 40.139K Nov 16, 2026
DXUV 0.01% 4,640 $ 394.261K Nov 12, 2026
DFUV 0.00% 4,628 $ 393.241K Nov 12, 2026
IALT 0.00% 179 $ 13.951K Nov 16, 2026
THRO 0.00% 22 $ 1,714.68 Nov 16, 2026