POSTED April 30, 2026 POSTED April 30, 2026 Started production of saleable R2 vehicles and made first deliveries to employees with external customer deliveries expected in the coming weeks Consolidated revenue growth of 11 percent year-over-year…
POSTED
April 30, 2026
POSTED
April 30, 2026
-
Started production of saleable R2 vehicles and made first deliveries to employees with external customer deliveries expected in the coming weeks
-
Consolidated revenue growth of 11 percent year-over-year and generated $119 million of consolidated gross profit for the quarter
-
Increased Georgia plant initial production capacity to 300,000 vehicles annually; expects first advance on $4.5 billion DOE loan in early 2027
-
Robotaxi partnership with Uber to deploy up to 50,000 fully autonomous robotaxis
-
$1 billion of funding from Volkswagen Group through successful completion of winter testing
Irvine, California, April 30, 2026: Rivian Automotive, Inc. (NASDAQ: RIVN), an American automotive technology company that develops and manufactures category-defining electric vehicles as well as vertically integrated software and services for the entire lifecycle of the vehicle, today announced its first quarter 2026 financial results.
RJ Scaringe, Rivian Founder and CEO, said:
“With the launch of R2, we are excited to dramatically expand our market opportunity and have more people driving Rivians. The support of the Department of Energy for the $4.5 billion loan to build our Georgia facility enables Rivian to grow American jobs and establish stronger U.S. technology and manufacturing leadership while further scaling our customer base.”
Business Highlights
Last week Rivian announced the start of production of saleable R2 vehicles in Normal, Illinois. This key step is an exciting milestone in Rivian’s history and is the culmination of the hard work from many teams across the company. With R2, Rivian has taken its design, performance and technology and brought it to a significantly broader audience without losing what makes a Rivian unmistakably Rivian.
The company made the strategic decision to increase the initial production capacity of its Georgia plant by 50 percent, bringing the first phase to 300,000 units of annual production capacity for the company’s mid-sized vehicle platform. This change is expected to boost cost efficiency while still providing significant room for future expansion in later phases. The company remains on track for vehicle production in Georgia to begin in late 2028.
As part of this new vision for the Georgia facility, Rivian worked with the Department of Energy to make strategic changes to the company’s DOE loan. The up to $4.5 billion loan ($4,006 million principal and $494 million capitalized interest) is aligned with the updated facility design. Rivian now expects to draw on the loan by early 2027, subject to meeting certain conditions.
In March, Rivian announced a partnership with Uber to help accelerate both companies’ autonomous vehicle plans. The deal is expected to enable Uber, or its fleet partners, to purchase 10,000 fully autonomous R2 robotaxis with the option to purchase up to 40,000 more in 2030. Uber will invest up to $1.25 billion in Rivian through 2031, subject to the achievement of certain milestones and conditions, building towards a scaled, fully-autonomous fleet of Rivian R2 robotaxis, which will be available through the Uber platform. An initial $300 million equity investment is expected to close in the second quarter of 2026, subject to certain conditions, and an additional $250 million equity investment is expected later this year, subject to certain conditions.
Last month, Rivian’s joint venture with Volkswagen Group, Rivian and Volkswagen Group Technologies (RV Tech), successfully completed winter weather testing of its production-intent zonal architecture for first generation software-defined vehicles. Achieving this milestone unlocked a $1 billion equity investment in Rivian by Volkswagen Group, which we received today.
First Quarter 2026 Results Summary
Production and Deliveries
-
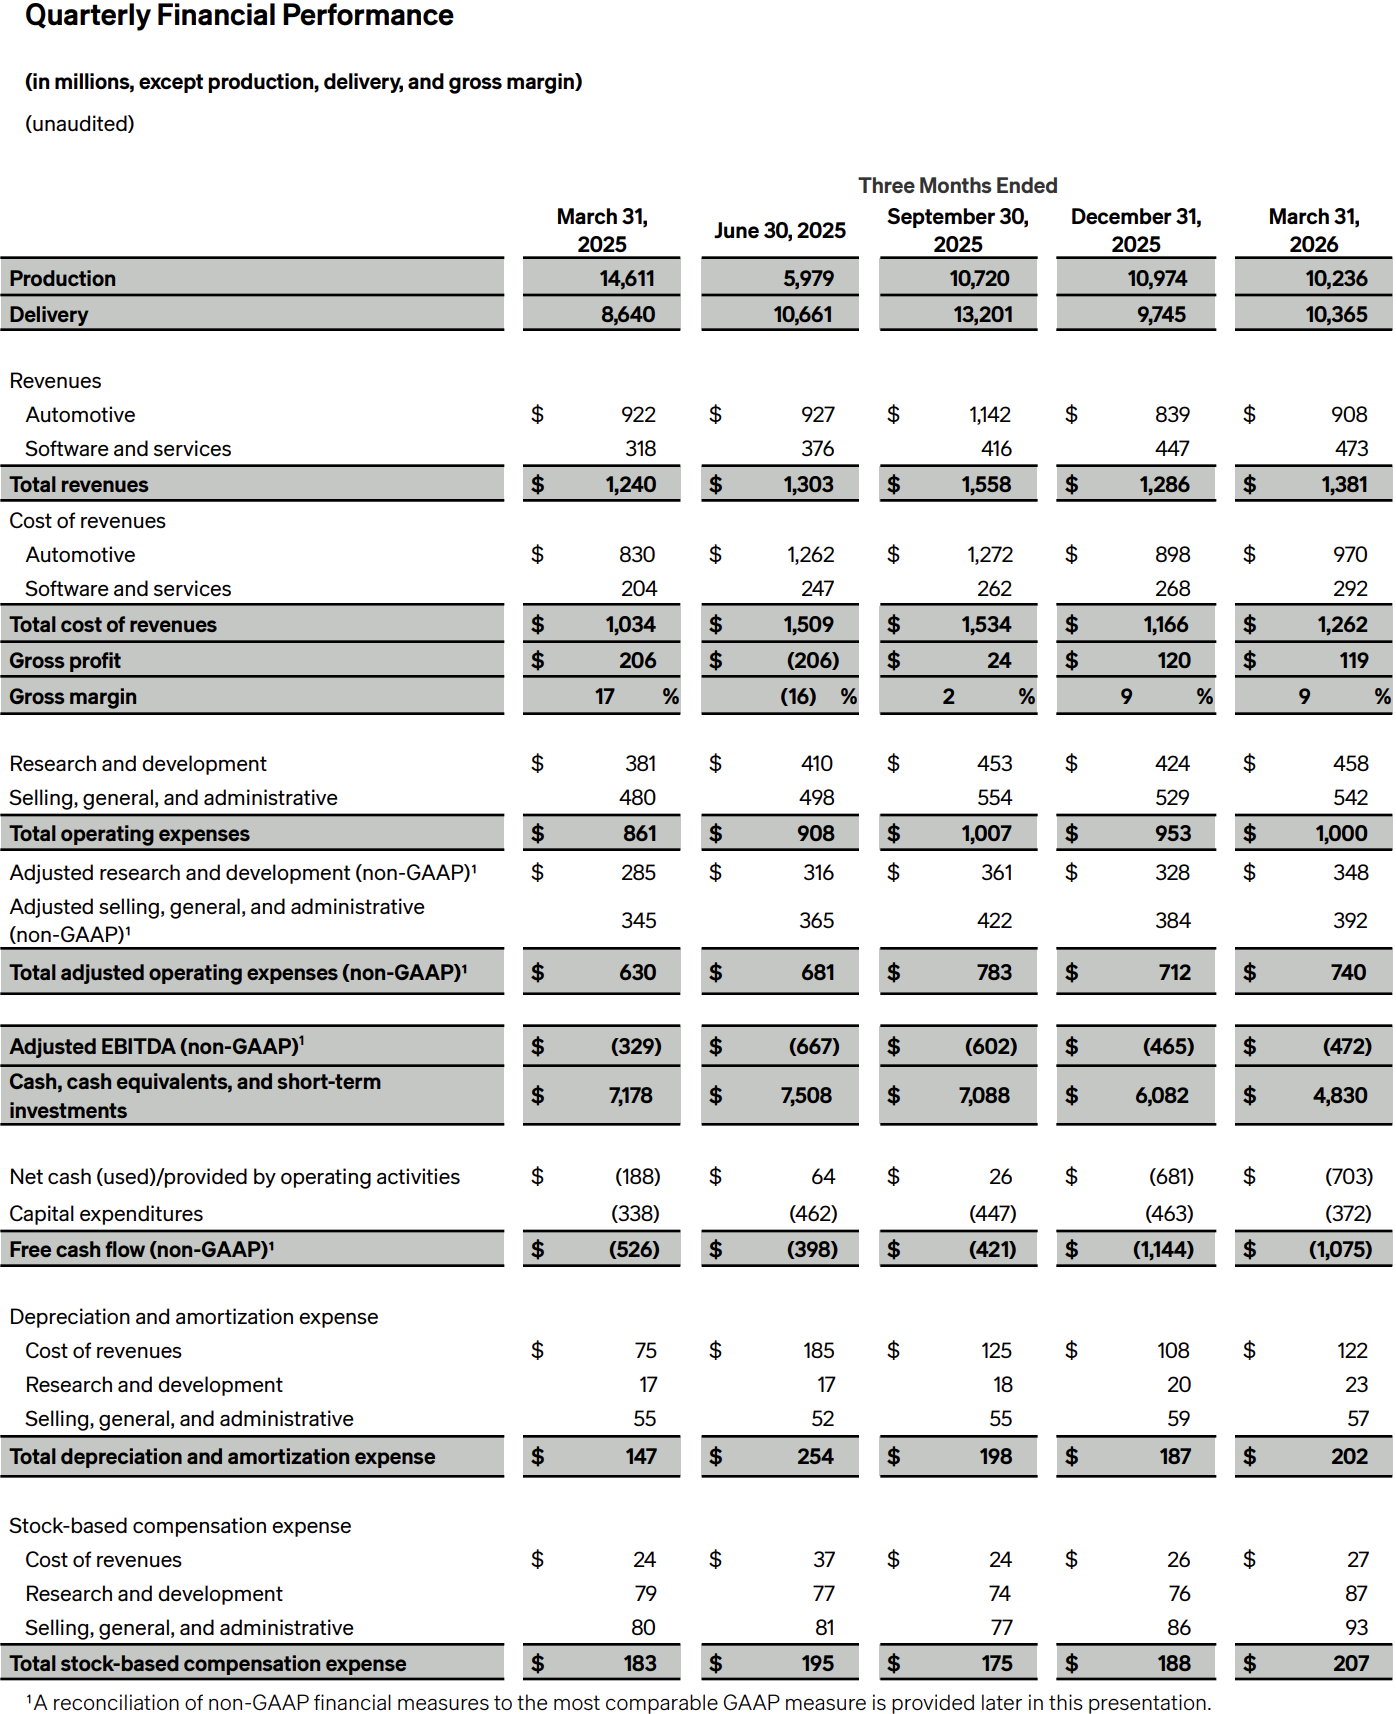
10,236 vehicles produced at Rivian’s manufacturing facility in Normal, Illinois.
-
10,365 vehicles delivered to customers.
Revenues
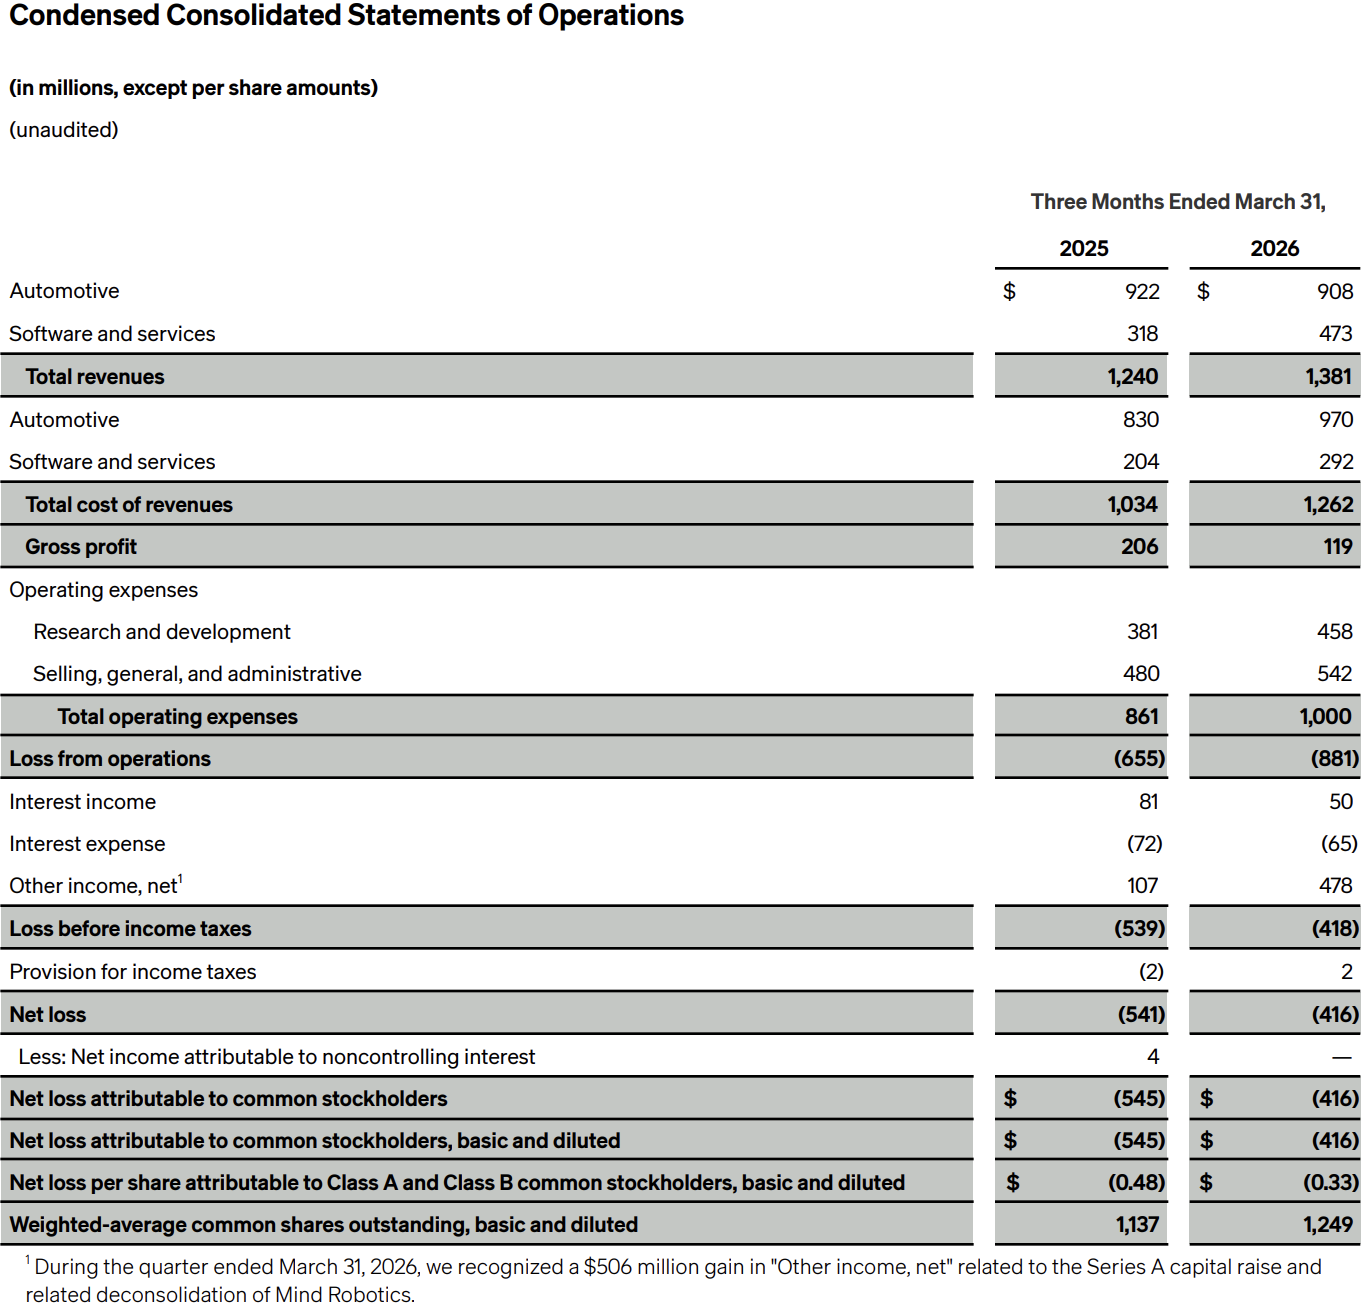
Consolidated revenue was $1,381 million, an 11 percent increase over the same quarter of the previous year.
-
Automotive segment revenue was $908 million, a 2 percent decrease over the same quarter of the previous year, primarily due to a $100 million decrease in sales of automotive regulatory credits and a decline in automotive revenue per unit delivered due to a higher mix of commercial vans, which were partially offset by a 20 percent increase in vehicle deliveries.
-
Software and services segment revenue was $473 million, a 49 percent increase over the same quarter of the previous year, due to an increase in vehicle electrical architecture and software development services, as well as vehicle repair and maintenance service and remarketing.
Gross Profit
Consolidated gross profit was $119 million, an $87 million decrease over the same quarter in the previous year.
-
Automotive segment gross profit loss was $(62) million compared to $92 million in gross profit for the same quarter in 2025, due primarily to the $100 million decrease in sales of automotive regulatory credits and lower production volumes, resulting in a $42 million and $3 million increase in depreciation and stock based compensation respectively.
-
Software and services segment gross profit was $181 million, a $67 million increase over the same quarter of the previous year, primarily due to higher vehicle electrical architecture and software development services and vehicle repair and maintenance services.
Operating Expenses and Operating Loss
Total operating expenses in the first quarter increased to $1,000 million, compared to $861 million in the same quarter of the previous year. Within operating expenses, we recognized non-cash, stock-based compensation expenses of $180 million compared to $159 million in the same quarter of the previous year and depreciation and amortization expense of $80 million as compared to $72 million in the same quarter of the previous year.
-
Research and development (R&D) expense was $458 million compared to $381 million in the same quarter of the previous year. The increase was primarily related to increased software and cloud spend on autonomy and R2 pre-production costs, including payroll and related expenses.
-
Selling, general and administrative (SG&A) expense was $542 million compared to $480 million in the same quarter the previous year. The increase was primarily related to expanding our go-to-market operations and footprint, including higher payroll and stock-based compensation expenses and facilities, software, and other operating expenses.
-
For the first quarter of 2026, we experienced a loss from operations of $881 million compared to $655 million in the same quarter of the previous year due to lower gross profit and higher operating expenses.
Adjusted Operating Expenses
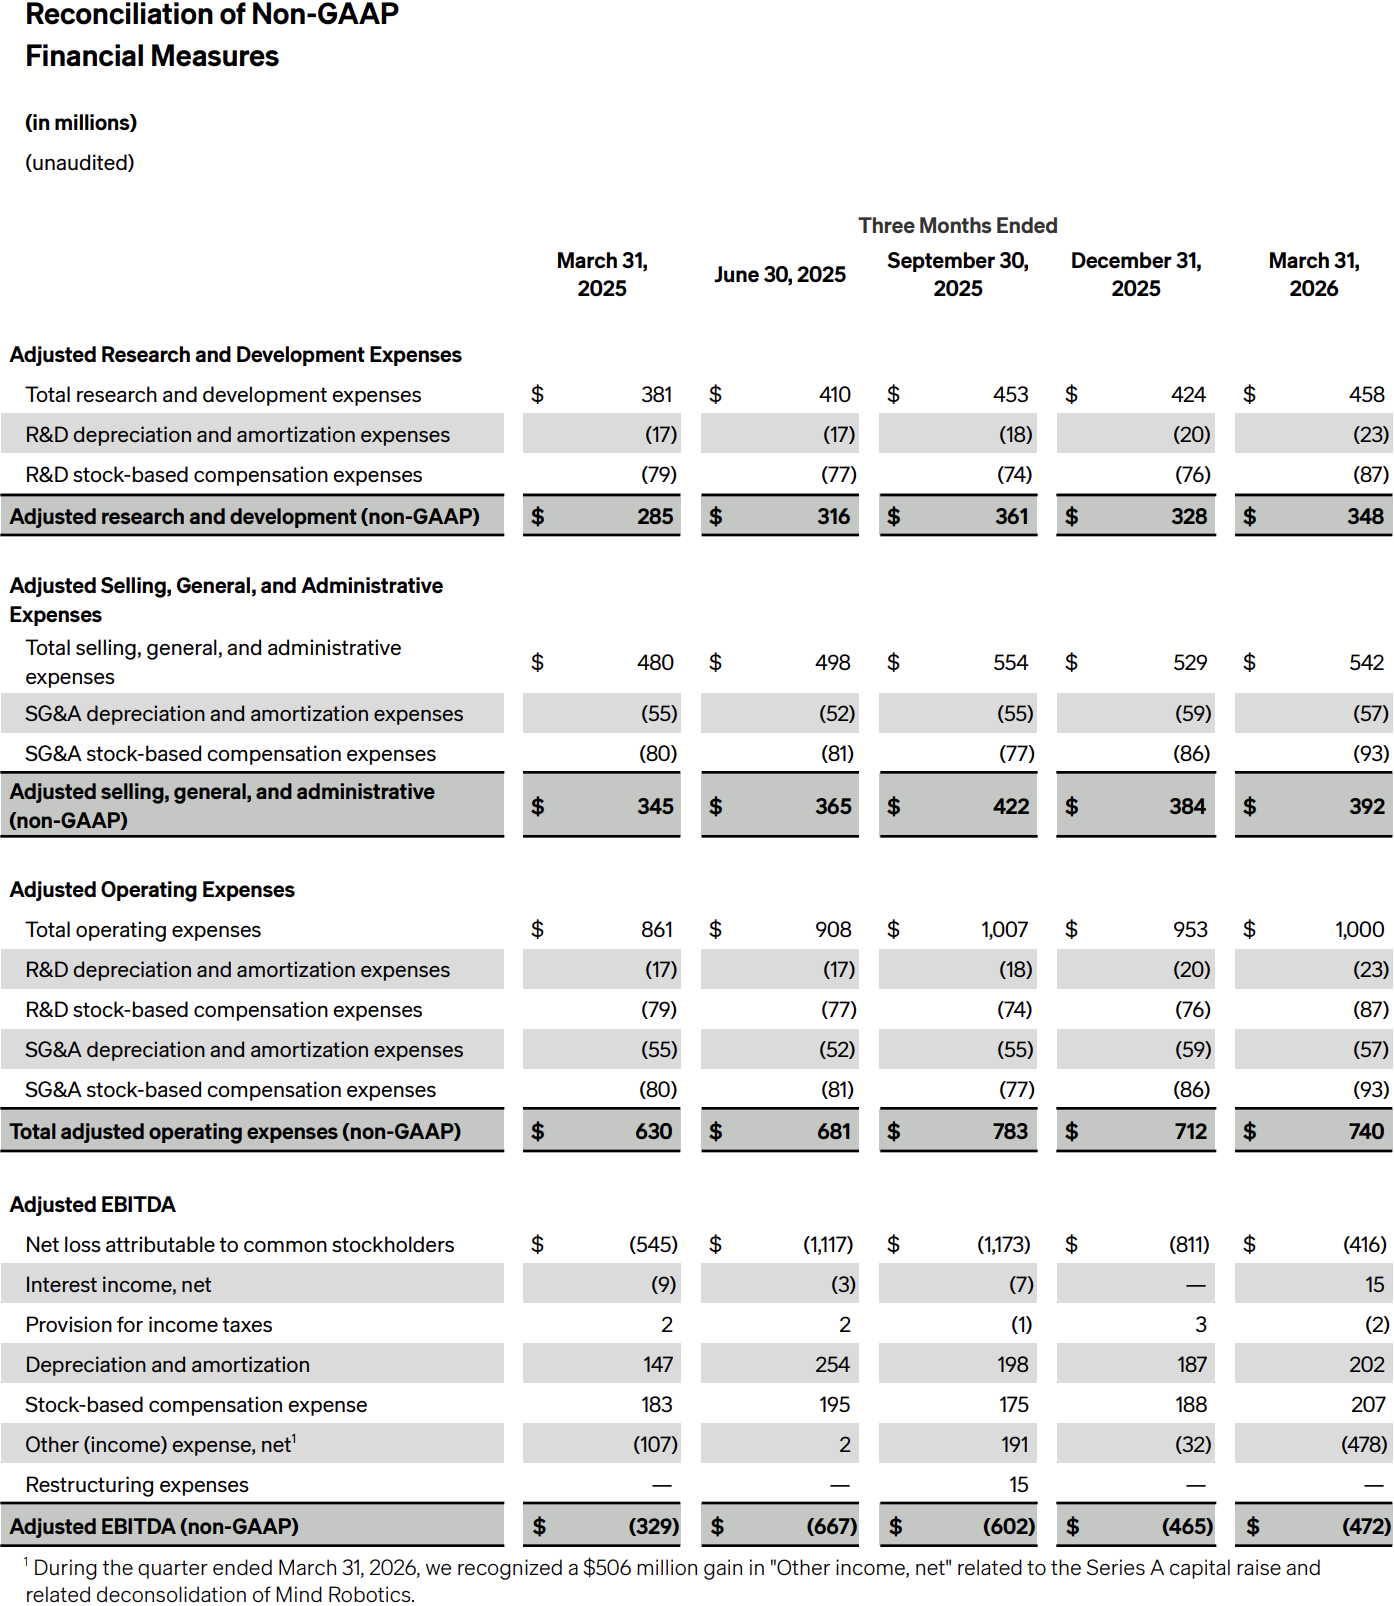
Total adjusted operating expenses for the first quarter of 2026 were $740 million compared to $630 million for the same quarter of the previous year.
-
Adjusted R&D expenses for the first quarter of 2026 were $348 million compared to $285 million for the same quarter the previous year.
-
Adjusted SG&A expenses for the first quarter of 2026 were $392 million compared to $345 million for the same quarter the previous year.
Net Loss
- Net loss for the first quarter of 2026 was $(416) million compared to $(541) million for the same quarter the previous year. Net loss for the quarter benefited from a $506 million gain in other income related to the Series A capital raise and related deconsolidation of Mind Robotics.
Adjusted EBITDA
- Adjusted EBITDA for the first quarter of 2026 was $(472) million compared to $(329) million for the same quarter the previous year.
Net Cash Used in Operating Activities
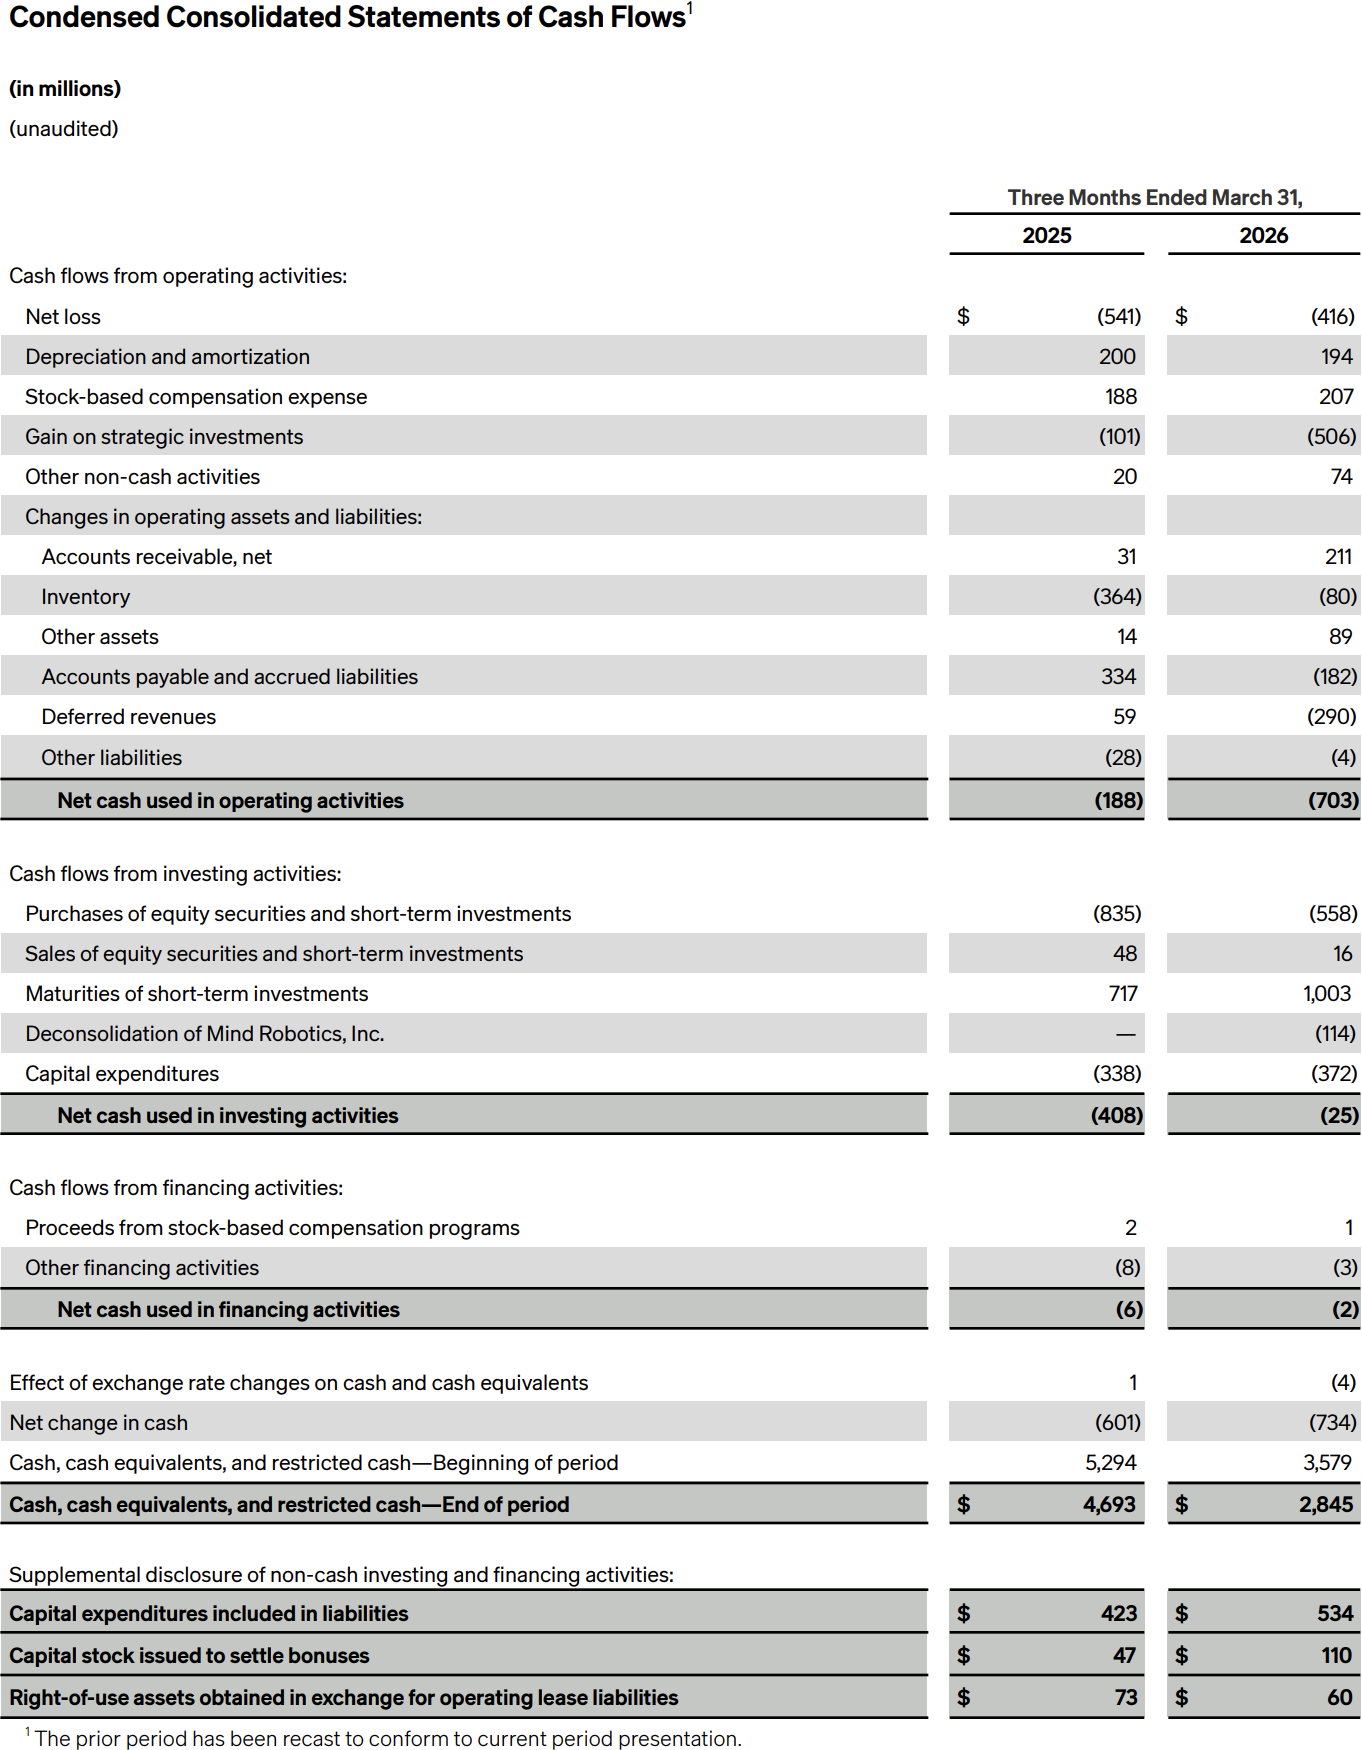
- Net cash used in operating activities for the first quarter of 2026 was $(703) million compared to $(188) million for the same quarter the previous year. The increase in net cash used in operations was primarily driven by cash consumed by working capital, increased operating expenses, and a reduction in regulatory credit sales.
Capital Expenditures
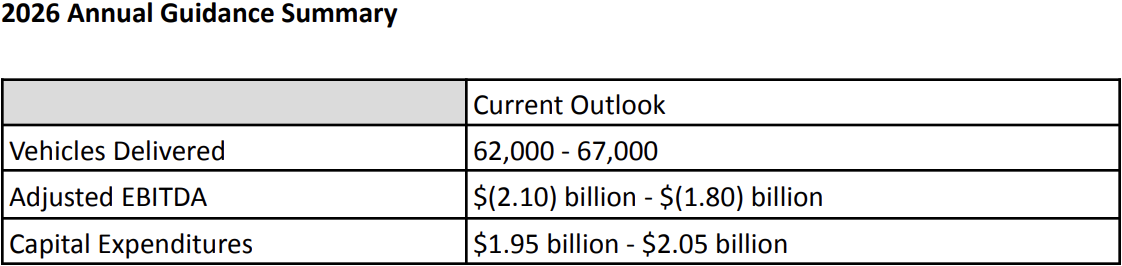
- Capital expenditures for the first quarter of 2026 were $372 million compared to $338 million for the same quarter the previous year.
Liquidity and Free Cash Flow
-
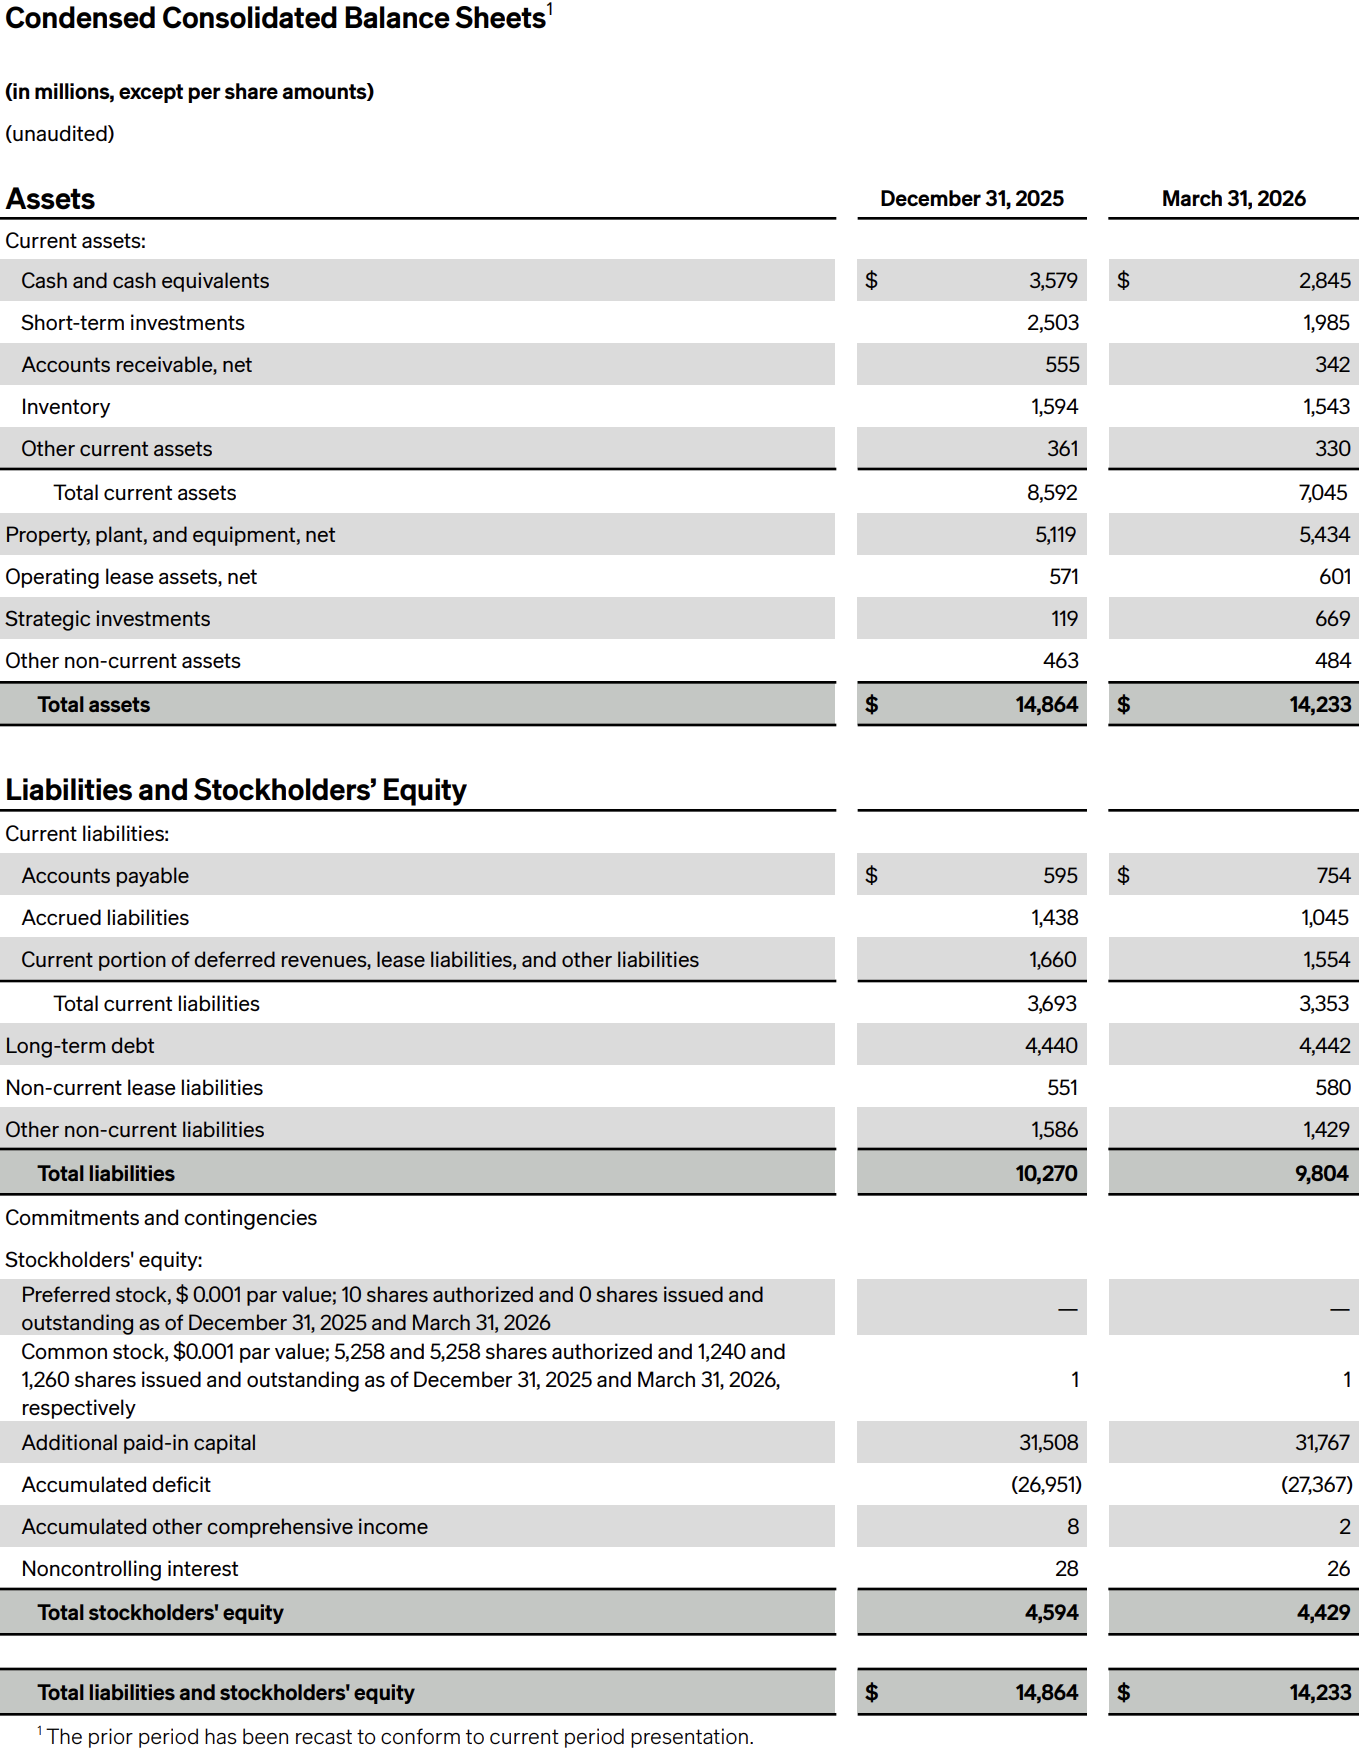
Rivian ended the first quarter of 2026 with $4,830 million in cash, cash equivalents, and short-term investments.
- Including the capacity under our asset-based revolving-credit facility, we ended the first quarter of 2026 with $5,394 million of total liquidity.
-
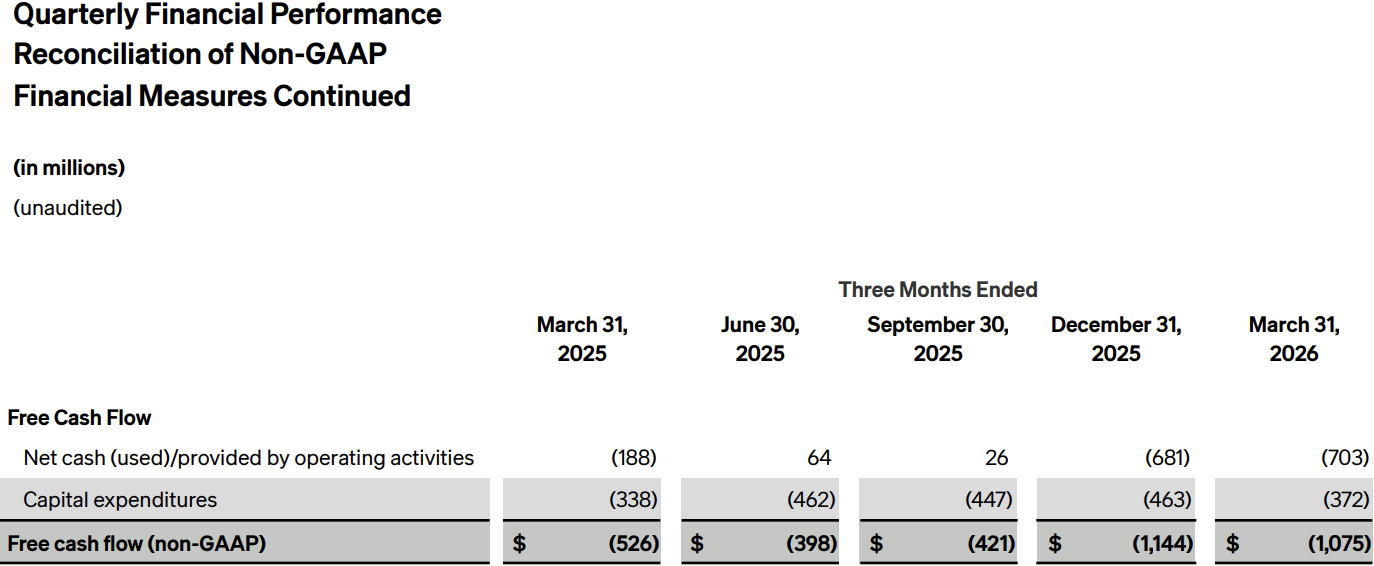
We define free cash flow as net cash used or provided by operating activities less capital expenditures. The increase in net cash used in operating activities coupled with the increase in capital expenditures discussed above resulted in negative free cash flow¹ of $(1,075) million for the first quarter of 2026 compared to negative free cash flow of $(526) million for the same quarter the previous year.
Q1 2026 Results Webcast and Replay Information
Rivian will host an audio webcast to discuss its results and provide a business update at 2:00pm PT / 5:00pm ET on Thursday, April 30, 2026. The link to the webcast and shareholder presentation will be made available on the company’s Investor Relations website at rivian.com/investors
. After the call, a replay will be available at rivian.com/investors
for four weeks.
Forward Looking Statements:
This press release and statements that are made on our earnings call contain forward-looking statements within the meaning of the Private Securities Litigation Reform Act of 1995. All statements contained in this press release and made on our earnings call that do not relate to matters of historical fact should be considered forward-looking statements, including without limitation statements regarding our future operations, initiatives and business strategy, including our future financial results, vehicle profitability and future gross profits, our future capital expenditures, the underlying trends in our business (including customer preferences and expectation), macroeconomic and policy conditions, including changes to the availability of government and economic incentives, including tax credits, for electric vehicles, our market opportunity, and our potential for growth, our production ramp and manufacturing capacity expansion and anticipated production levels, the timeline for the start of production at the Georgia plant, the timeline for drawing on our Department of Energy Loan, our expected future production and deliveries, scaling our service infrastructure, our expected future products and technology and product enhancements, including enhanced performance features and pricing (including the timing of launches and customer deliveries), our roadmap and timeline for the release of our next-generation vehicle autonomy systems, hardware, including RAP1, ACM3 and LiDAR, and software architecture underpinned by artificial intelligence, including LDM, Rivian Assistant, Universal Hands-Free, and RUI, future revenue opportunities, including with respect to the emerging autonomous driving market, our joint venture with Volkswagen Group, including the expected benefits from the partnership and future Volkswagen Group investments, our partnership with Uber Technologies, Inc., including the expected benefits from the partnership and future Uber investments, the achievement of certain milestones and regulatory approval, the timeline, total purchase, and deployment plans for fully autonomous R2 robotaxis by Uber and its fleet partners, the timeline and geographic location for initial commercial deployments and future scaling, and expected benefits from partnerships with other third parties. These statements are neither promises nor guarantees and involve known and unknown risks, uncertainties, and other important factors that may cause our actual results, performance, or achievements to be materially different from any future results, performance, or achievements expressed or implied by the forward-looking statements, including, but not limited to: our history of losses as a growth-stage company and our limited operating history; we may underestimate or not effectively manage the cost of revenues, operating expenses, and capital expenditures associated with our business and operations; that we will require additional financings to raise capital to support our business; our ability to attract and retain a large number of consumers and maintain strong demand for our vehicles, software and services; the highly competitive automotive and software and services markets in which we operate; demand for and consumers’ willingness to adopt electric vehicles; that our long-term results depend upon our ability to successfully introduce, integrate and market new products and services; that we have experienced and may in the future experience significant delays in the manufacture and delivery of our vehicles; risks associated with the development of complex software and hardware in coordination with our joint venture with Volkswagen Group and our other vendors and suppliers; risks associated with our joint venture with Volkswagen Group; risks associated with additional strategic alliances or acquisitions; we have experienced and could experience in the future cost increases and disruptions in supply of raw materials, components, or equipment used to produce our vehicles; our dependence on establishing and maintaining relationships with vendors and suppliers; our ability to accurately estimate the supply and demand for our vehicles and predict our manufacturing requirements; our ability to scale our business and manage future growth effectively; our ability to maintain our relationship with one customer that has generated a significant portion of our revenues; that we are highly dependent on the services and reputation of our Founder and Chief Executive Officer; the unavailability, reduction or elimination of government and economic incentives and credits for electric vehicles; that we may not be able to obtain or agree on acceptable terms and conditions for all or a significant portion of the government grants, loans, and other incentives, including regulatory credits, for which we apply or are approved for; risks associated with breaches in data security, failure of technology systems, cyber-attacks or other security or privacy-related incidents; risk of intellectual property infringement claims; effect of trade tariffs or other trade barriers; effects of export and import control laws; risks related to motor vehicle safety standards; delays, limitations and risks related to permits and other approvals required to build, operate or expand operations including the construction and development of facilities to support R2; and the other factors described in our filings with the SEC. These factors could cause actual results to differ materially from those indicated by the forward-looking statements made in this press release. Any such forward-looking statements represent management’s estimates as of the date of this press release. While we may elect to update such forward-looking statements at some point in the future, except as may be required by law, we disclaim any obligation to do so, even if subsequent events cause our views to change.
*Non-GAAP Financial Measures
In addition to our results determined in accordance with generally accepted accounting principles in the United States (“GAAP”), we review financial measures that are not calculated and presented in accordance with GAAP (“non-GAAP financial measures”). We believe our non-GAAP financial measures are useful in evaluating our operating performance. We use the following non-GAAP financial information, collectively, to evaluate our ongoing operations and for internal planning and forecasting purposes. We believe that non-GAAP financial information, when taken collectively, may be helpful to investors, because it focuses on underlying operating results and trends, provides consistency and comparability with past financial performance, and assists in comparisons with other companies, some of which use similar non-GAAP financial information to supplement their GAAP results. The non-GAAP financial information is presented for supplemental informational purposes only, should not be considered a substitute for financial information presented in accordance with GAAP, and may be different from similarly titled non-GAAP measures used by other companies. A reconciliation of each historical non-GAAP financial measure to the most directly comparable financial measure stated in accordance with GAAP is provided above. Reconciliations of forward- looking non-GAAP financial measures are not provided because we are unable to provide such reconciliations without unreasonable effort due to the uncertainty regarding, and potential variability of, certain items, such as stock-based compensation expense and other costs and expenses that may be incurred in the future. Investors are encouraged to review the related GAAP financial measures and the reconciliation of these non-GAAP financial measures to their most directly comparable GAAP financial measures.
Our non-GAAP financial measures include adjusted research and development expenses, adjusted selling, general, and administrative expenses, adjusted EBITDA, and free cash flow.
Adjusted research and development expenses is defined as total research and development expenses, less R&D depreciation and amortization expenses and R&D stock-based compensation expenses.
Adjusted selling, general, and administrative expenses is defined as total selling, general, and administrative expenses, less SG&A depreciation and amortization expenses and SG&A stock-based compensation expenses.
Adjusted EBITDA defined as net loss before interest expense (income), net, provision for income taxes, depreciation and amortization, stock-based compensation, other (expense) income, net, and special items. Our management team ordinarily excludes special items from its review of the results of the ongoing operations. Special items is comprised of (i) cost of revenue efficiency initiatives which include costs incurred as we transition between major vehicle programs, cost incurred for negotiations with major suppliers regarding changing demand forecasts or design modifications, and other costs for enhancing capital and cost optimization of the Company (ii) restructuring expenses for significant actions taken by the Company, (iii) significant asset impairments and write-offs, and (iv) other items that we do not necessarily consider to be indicative of earnings from ongoing operating activities, including loss (gain) on convertible note, net, and joint venture formation expenses.
Free cash flow is defined as net cash used in operating activities less capital expenditures.
About Rivian:
Rivian (NASDAQ: RIVN) is an American automotive technology company that develops and manufactures category-defining electric vehicles as well as vertically integrated technologies and services. Through innovation across its electrical architecture, end-to-end software, autonomous driving platform, artificial intelligence, and propulsion, the company creates vehicles that excel at work and play with the goal of accelerating the global transition to zero-emission transportation and energy. Rivian vehicles are manufactured in the United States and are sold directly to consumer and commercial customers. Whether taking families on new adventures or electrifying fleets at scale, Rivian vehicles all share a common goal — preserving the natural world for generations to come.


