Radware Ltd. is a provider of application security and delivery solutions for multi-cloud environments. The company offers infrastructure, application, and network protection services to enterprises, carriers, and cloud service providers globally. Its business is divided into two segments: the Core Business, which includes cloud security-as-a-service, application and data center security, and application availability products; and The Hawks’ Business, comprising subsidiaries SkyHawk Security and EdgeHawk Security. Key products include the Cloud DDoS Protection Service, Cloud Web DDoS Protection, Cloud Firewall as a Service, and the Web Application and API Protection (WAAP) suite. The company also provides on-premises hardware and software, such as the DefensePro device, along with managed services, professional services, and technical support. Radware was organized in 1996 and commenced operations in 1997. Recent acquisitions include Pynt, Inc. for API security testing and the technology of DC Security Ltd. for cloud DDoS scrubbing services. The company operates through its wholly owned subsidiary Radware Inc. in the United States and Canada.

Summarised from the company's own disclosures, fiscal year ended Mar 2026

Industry Software - Infrastructure Homepage radware.com
Sector Technology IR page radware.com
Tags
ddos protection, web application firewall, api security, cloud security, network security, bot management, application availability, carrier security, cloud-native threat detection, security-as-a-service, Radware Inc., SkyHawk Security, EdgeHawk Security, Pynt Inc., DC Security Ltd., SecurityDAM Ltd., Cloud DDoS Protection Service, Always-On Cloud DDoS Protection Service, Always-On Hybrid Cloud DDoS Protection Service, On-Demand Cloud DDoS Protection Service, On-Demand Cloud Hybrid DDoS Protection Service, Cloud Web DDoS Protection, Cloud Firewall as a Service, Cloud Network Analytics, AI SOC Xpert DDoS, Web Application and API Protection, WAAP, DefensePro, ERT Active Attackers Feed, EAAF
Press page —

Metrics

Valuation  
Market cap $ 1.477B
Market cap (USD) $ 1.477B
P/E 76.07
PEG —
P/BV 4.23
P/S 4.89
P/OCF 29.48
P/FCF 35.54
Dividend yield —
Turnover / mcap —
Returns  
ROE 6.1%
ROI 7.9%
ROIC 3.1%
Profit margin 6.7%
Growth  
Revenue growing Yes
Profits growing Yes
Revenue up 3y No
Revenue up 5y No
Earnings growth 3y (net profit CAGR) —
Quality  
Profitable Yes
Margin expanding Yes
Buying back stock No
Diluting (TTM) Yes
Debt/Equity —
Podcast bulls (TTM) Sign up
Podcast bears (TTM) Sign up
Podcast sentiment (TTM) Sign up
Podcast sentiment % (TTM) Sign up
News sentiment (TTM) 18
Quality score -5.9%
Insiders  
Buys, 1w Sign up
Buys, 1m Sign up
Buys, 1y Sign up
Sells, 1w Sign up
Sells, 1m Sign up
Sells, 1y Sign up

Sign up to see this company's insider trades

Figure FY 2025 FY 2024 FY 2023 FY 2022 FY 2021 FY 2020 FY 2019 FY 2018 FY 2017 FY 2016 FY 2015 FY 2014 FY 2013 FY 2012 FY 2011 FY 2010 FY 2009
Revenue 301.85M 274.88M 261.292M 293.426M 286.496M 250.027M 252.072M 234.404M 211.369M 196.585M 216.566M 221.892M 192.997M 189.171M 167.02M 144.119M 108.904M
Net profit 20.257M 6.038M -21.59M -166K 7.811M 9.636M 22.566M 11.735M -7.493M -8.659M 18.569M 24.95M 18.055M 31.757M 21.337M 9.634M -5.936M
Free cash flow 41.555M 66.33M -8.929M 23.334M 66.171M 55.194M 44.697M 40.382M 24.252M 29.076M 25.362M 42.695M 21.488M 42.183M 36.256M 35.316M 8.59M

Figure FY 2025 FY 2024 FY 2023 FY 2022 FY 2021 FY 2020 FY 2019 FY 2018 FY 2017 FY 2016 FY 2015 FY 2014 FY 2013 FY 2012 FY 2011 FY 2010 FY 2009
Share price 24.09 22.53 16.68 19.75 41.64 27.75 25.78 22.71 19.4 14.58 15.34 22.02 17.98 32.71 — — —
Price performance 12m 0.07 0.35 -0.16 -0.53 0.5 0.08 0.14 0.17 0.33 -0.05 -0.3 0.22 -0.45 — — — —

Filed figures

Figure Dec 2016 Dec 2017 Dec 2018 Dec 2019 Dec 2020 Dec 2021 Dec 2022 Dec 2023 Dec 2024 Dec 2025
Balance sheet detail
Trade receivables (USD) 19.4M 16.2M 17.2M 22.6M 16.8M 13.2M 17.8M 20.3M 16.8M 35M
↳ YoY growth -26.5% -16.8% +6.3% +31.7% -25.5% -21.7% +34.6% +14.2% -17.0% +108.2%
↳ 5y CAGR +9.1% -2.6% -7.2% -2.5% -8.6% -7.4% +1.9% +3.4% -5.7% +15.8%
Lease liabilities (USD) — — — 19.1M 30.1M 27.5M 24.1M 20.7M 18.3M 17M
Cash and deposits (USD) 79.6M 65.2M 45.2M 40.8M 54.8M 92.5M 46.2M 70.5M 98.7M 105M
Intangible assets (USD) 2.4M 10.4M 9.47M 14.5M 12.6M 10.7M 19.7M 15.7M 11.8M 7.78M
Right-of-use assets (USD) — — — 18.1M 27.8M 24.8M 23.1M 20.8M 18.5M 15.6M
Cash flow detail
Operating cash flow (USD) 38.5M 31.5M 49.3M 52.9M 63.9M 71.8M 32.1M -3.5M 71.6M 50.1M
Purchases of property, plant and equipment (USD) -9.4M -7.21M -8.87M -8.16M -8.67M -5.6M -8.81M -5.43M -5.28M -8.54M
Change in receivables (cash effect) (USD) 7M 3.39M -1.17M -2.41M 5.76M 3.66M -4.56M -2.52M 3.44M -18.2M
Change in inventories (cash effect) (USD) -792,000 -1.66M 371,000 4.46M 5,000 2.36M 152,000 -4.12M 1.51M 810,000
Change in payables (cash effect) (USD) -3.28M -734,000 -884,000 1.78M -2.43M 428,000 2.15M -2.17M 1.28M 1.65M
Share buybacks (cash effect) (USD) -22M -413,000 -4.28M -24.5M -45.3M -52.5M -59.5M -63.2M -839,000 -10.5M
Income taxes paid (cash effect) (USD) -1.73M -14.4M -6.42M -3.3M -1.31M -2.75M -18.1M -4M -921,000 -2.22M
Share-based compensation (USD) 11.5M 13M 12.5M 13.1M 16.5M 17.6M 27.4M 34M 26M 24M
Operating cash flow before change in receivables (USD) 31.5M 28.1M 50.4M 55.3M 58.1M 68.1M 36.7M -985,000 68.2M 68.3M
Free cash flow (OCF - PPE - intangibles) (USD) 29.1M 24.3M 40.4M 44.7M 55.2M 66.2M 23.3M -8.93M 66.3M 41.6M
Income detail
Research and development expense (USD) 51.7M 59M 57.7M 61.8M 66.8M 74.1M 86.6M 82.6M 74.7M 79M
↳ 5y CAGR +7.5% +10.3% +7.1% +7.0% +6.0% +7.5% +8.0% +7.5% +3.9% +3.4%
Total comprehensive income (USD) -9.94M -7.92M 11.1M 24.8M 10M 5.84M -4.56M -16.7M 7.06M 20.5M
Provision for credit losses (USD) — 109,000 109,000 — 104,000 18,000 0.00 0.00 — —
Credit cost ratio (credit losses / average receivables) (%) — 0.6% 0.7% — 0.5% 0.1% 0.0% 0.0% — —
Reported Apr 27, 2017 Mar 28, 2018 Apr 20, 2021 Apr 2, 2020 Apr 20, 2021 Apr 11, 2022 Mar 30, 2023 Mar 25, 2024 Mar 28, 2025 Mar 31, 2026

Sign up to see institutional holdings

Sign Up

Podcast Mentions

Sign up to see podcast mentions and sentiment

Sign Up

Press Alt+1 for screen-reader mode, Alt+0 to cancelAccessibility Screen-Reader Guide, Feedback, and Issue Reporting | New window

Menu By Use Case By Use Case

Menu Agentic AI Security Agentic AI Security

Menu Application Delivery Application Delivery

Menu Application & API Security Application & API Security

Menu DDoS Protection DDoS Protection

Menu By Industry By Industry

Menu Agentic AI Security Agentic AI Security

Menu Application & API Security Application & API Security

Menu DDoS Protection DDoS Protection

Menu Application Delivery Application Delivery

Menu Documents Documents

Menu Blog Blog

Menu Video Video

Menu Free Assessment Tools Free Assessment Tools

Menu Events Events

Menu Security Research Center Security Research Center

Radware icon WHY RADWARE? Learn how our AI-powered platform rapidly resolves issues

Menu Customers CUSTOMERS Read case studies, reviews and customer testimonials

Menu Diversity & Inclusion DIVERSITY & INCLUSION Get to know Radware’s fair and supportive culture

Menu Investors INVESTORS Get the latest news, earnings and upcoming events

Menu Partners PARTNERS Access the new partner tools, services and expertise

Menu Locations LOCATIONS Discover Radware’s offices and strong global presence

Menu Careers CAREERS Learn about our team, values and latest job openings

Menu Training TRAINING Join in-depth training, live classes, workshops and more

Menu Contact Us CONTACT US Connect with a Radware expert today
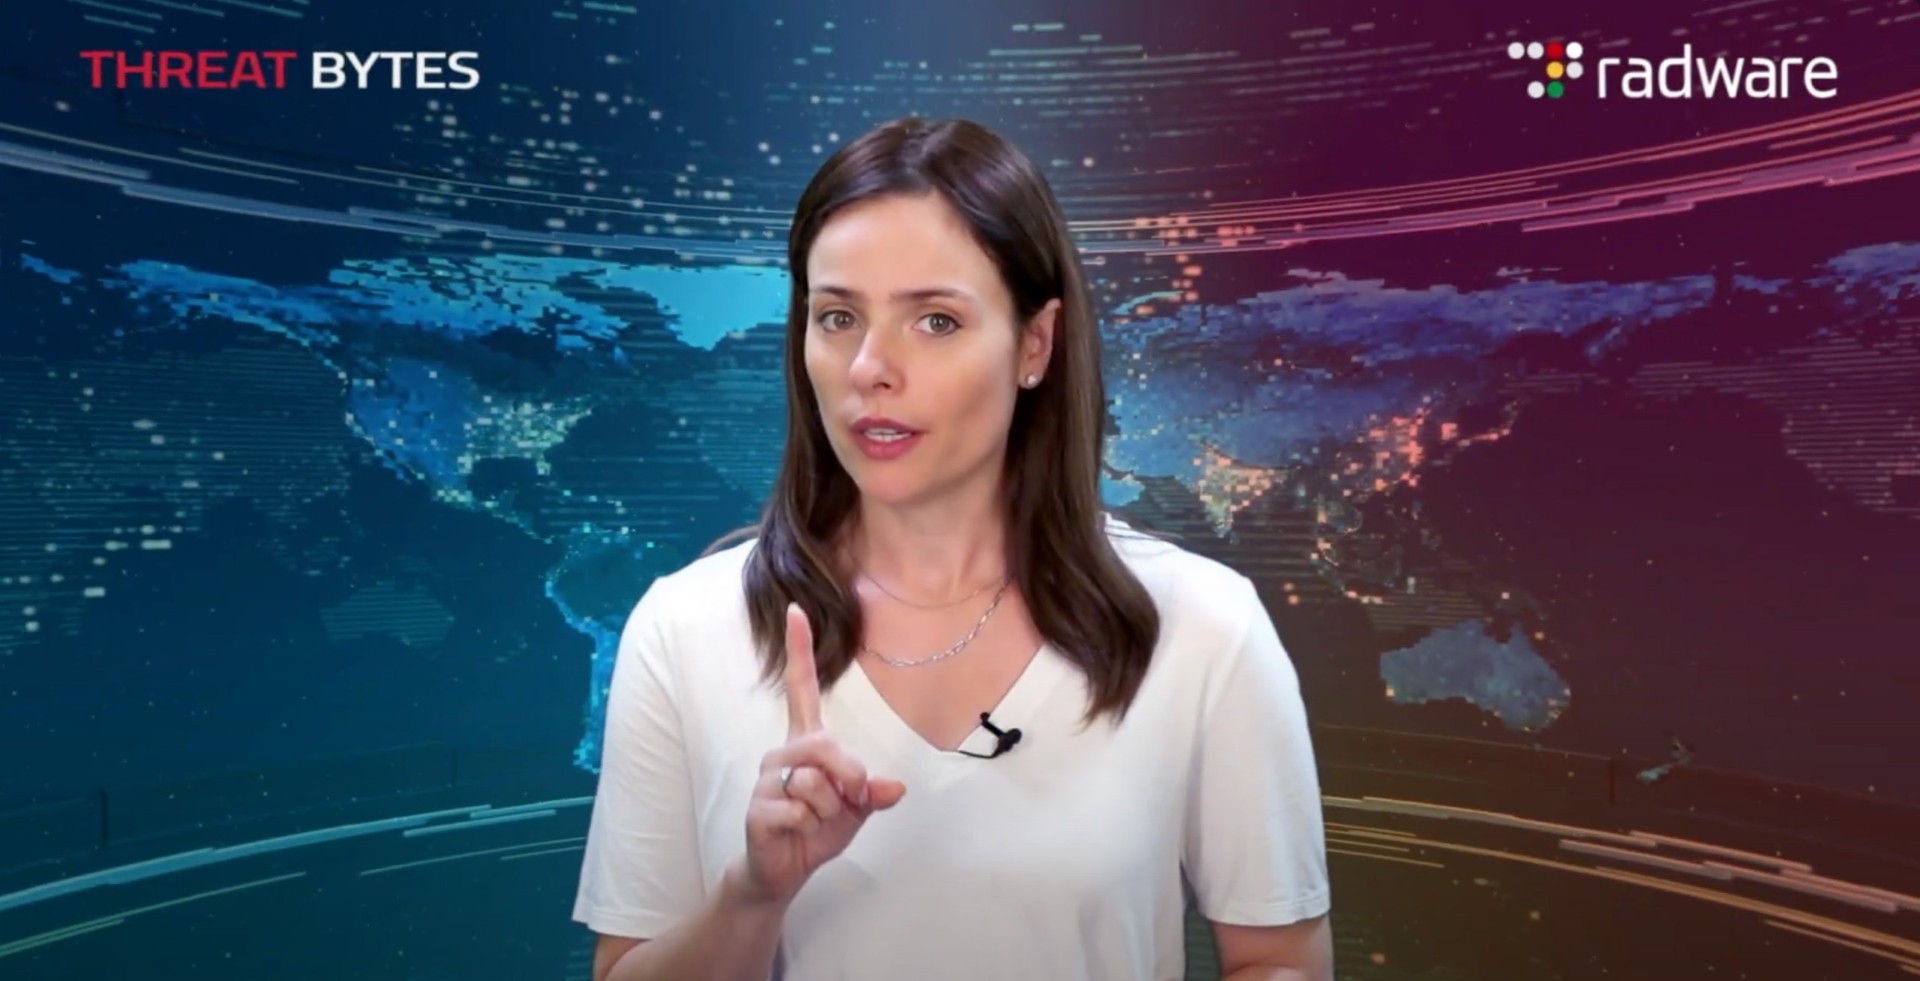
Watch Radware’s New Series: Threat Bytes

Get the latest global cyberthreat updates quickly, in just a few bytes.

Watch Now

Solutions

Products

Partners

Company

Resources

Support

Radware Reports Third Quarter 2026 Financial Results Bull 0 Bear 0 Not a release

Press Alt+1 for screen-reader mode, Alt+0 to cancelAccessibility Screen-Reader Guide, Feedback, and Issue Reporting | New window

Menu By Use Case By Use Case

Menu Agentic AI Security Agentic AI Security

Menu Application Delivery Application Delivery

Menu Application & API Security Application & API Security

Menu DDoS Protection DDoS Protection

Menu By Industry By Industry

Menu Agentic AI Security Agentic AI Security

Menu Application & API Security Application & API Security

Menu DDoS Protection DDoS Protection

Menu Application Delivery Application Delivery

Menu Documents Documents

Menu Blog Blog

Menu Video Video

Menu Free Assessment Tools Free Assessment Tools

Menu Events Events

Menu Security Research Center Security Research Center

Radware icon WHY RADWARE? Learn how our AI-powered platform rapidly resolves issues

Menu Customers CUSTOMERS Read case studies, reviews and customer testimonials

Menu Diversity & Inclusion DIVERSITY & INCLUSION Get to know Radware’s fair and supportive culture

Menu Investors INVESTORS Get the latest news, earnings and upcoming events

Menu Partners PARTNERS Access the new partner tools, services and expertise

Menu Locations LOCATIONS Discover Radware’s offices and strong global presence

Menu Careers CAREERS Learn about our team, values and latest job openings

Menu Training TRAINING Join in-depth training, live classes, workshops and more

Menu Contact Us CONTACT US Connect with a Radware expert today

Watch Radware’s New Series: Threat Bytes

Get the latest global cyberthreat updates quickly, in just a few bytes.

Watch Now

Solutions

Products

Partners

Company

Resources

Support

Press Alt+1 for screen-reader mode, Alt+0 to cancelAccessibility Screen-Reader Guide, Feedback, and Issue Reporting | New window

Menu By Use Case By Use Case

Menu Agentic AI Security Agentic AI Security

Menu Application Delivery Application Delivery

Menu Application & API Security Application & API Security

Menu DDoS Protection DDoS Protection

Menu By Industry By Industry

Menu Agentic AI Security Agentic AI Security

Menu Application & API Security Application & API Security

Menu DDoS Protection DDoS Protection

Menu Application Delivery Application Delivery

Menu Documents Documents

Menu Blog Blog

Menu Video Video

Menu Free Assessment Tools Free Assessment Tools

Menu Events Events

Menu Security Research Center Security Research Center

Radware icon WHY RADWARE? Learn how our AI-powered platform rapidly resolves issues

Menu Customers CUSTOMERS Read case studies, reviews and customer testimonials

Menu Diversity & Inclusion DIVERSITY & INCLUSION Get to know Radware’s fair and supportive culture

Menu Investors INVESTORS Get the latest news, earnings and upcoming events

Menu Partners PARTNERS Access the new partner tools, services and expertise

Menu Locations LOCATIONS Discover Radware’s offices and strong global presence

Menu Careers CAREERS Learn about our team, values and latest job openings

Menu Training TRAINING Join in-depth training, live classes, workshops and more

Menu Contact Us CONTACT US Connect with a Radware expert today

Watch Radware’s New Series: Threat Bytes

Get the latest global cyberthreat updates quickly, in just a few bytes.

Watch Now

Solutions

Products

Partners

Company

Resources

Support

Prompts

Radware Ltd. (ticker RDWR), listed in United States.

ETFs Holding Radware Ltd.

ETF Weight in ETF Shares Market value As of
IDEF 0.25% 218,112 $ 6.761M Nov 16, 2026
DTAN 0.16% 1,125 $ 34.875K Nov 17, 2026
MSSM 0.15% 35,977 $ 1.039M Aug 31, 2026