Join us for new podcast episodes each month featuring engaging discussions and expert guests covering a range of important topics for laboratory and diagnostic healthcare professionals. Listen now 
Simplifying the complexity of healthcare, one byte at a time
Stay up to date on the latest testing advancements and technology with practical advice and insights that can help improve patient care and well-being.
From greater regulations and patient demand to staffing shortages and workplace burnout, healthcare professionals today are under increased pressure to do more with less for the patients they serve.
QuidelOrtho is committed to alleviating these challenges with timely, relevant information delivered in an accessible and easy-to-use audio format. Subscribe today for new episodes and explore the Science Bytes archives.
Subscribe now to QuidelOrtho ScienceBytes:


Featured podcast
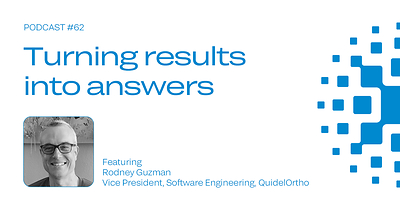
Episode 62: Turning results into answers
Click here to learn more about Episode #62
Healthcare environments produce previously unfathomable volumes of data. Yet this data is meaningless if it’s not structured in a way to facilitate decision-making.
The latest episode of QuidelOrtho Science Bytes tackles these challenges, examining what it really takes to make data meaningful – and what’s needed to make AI reliable in a high-stakes lab environment.
Host Josh Casey talks one-on-one with QuidelOrtho's Vice President of Software Engineering for Global Informatics Platforms, Rodney Guzman, about how connecting instruments, informatics and AI transforms data into meaningful answers.
This episode explores key steps to leveraging today’s powerful technologies for transforming data into decisions.
Listen to past episodes
2026
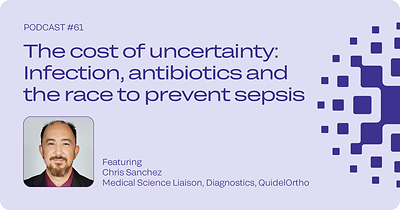
Episode 61: The cost of uncertainty: Infection, antibiotics and the race to prevent sepsis
Click here to learn more about Episode #61
The latest episode of QuidelOrtho Science Bytes covers one of the most daunting challenges in the ER today: Quickly identifying and treating sepsis patients.
Host Josh Casey sits down with QuidelOrtho's Medical Science Liaison Chris Sanchez, MSN, RN, to hear about emerging approaches to quicker diagnosis, personalized treatment, as well as better antibiotic stewardship.
This episode validates the necessity of procalcitonin-guided protocols to support healthcare providers in making swift decisions that optimize treatments and improve patient outcomes.
Episode 60: Speed, stewardship and cardiac care: ADLM 2026 highlights
Click here to learn more about Episode #60
The latest episode of QuidelOrtho Science Bytes takes listeners inside the 2026 ADLM Annual Conference, where experts discussed emerging technologies and diagnostic innovations shaping the future of healthcare.
Host Stephanie Kleewein speaks with three industry experts about advances in ultra-fast PCR, procalcitonin-guided antibiotic stewardship and high-sensitivity troponin testing. Together, they explore how faster, more precise diagnostics are helping clinicians make better decisions for patients.
This episode demonstrates how advances across laboratory medicine are helping healthcare providers accelerate diagnosis, optimize treatment and improve patient outcomes.
Episode 59: From 2025 to 2026: How the drug landscape is changing
Click here to learn more about Episode #59
The latest episode of QuidelOrtho Science Bytes explores how the overdose crisis has evolved from 2025 to 2026 and what these changes mean for laboratories and healthcare providers.
Host Josh Casey is joined by Vonda McAllister, Director of Global Product Management at QuidelOrtho, to discuss emerging drug trends, new ADLM guidance for toxicology testing and the growing challenges posed by counterfeit medications, polysubstance use and novel synthetic opioids.
This episode reinforces an important message: as the drug landscape continues to change, healthcare organizations must adapt testing strategies, strengthen collaboration and ensure clinicians have timely, actionable information to support patient care.
Episode 58: What we wish we knew: Understanding HDFN
Click here to learn more about Episode #58
Our latest episode of QuidelOrtho Science Bytes explores hemolytic disease of the fetus and newborn (HDFN) – a complex and often misunderstood condition that can have life-threatening consequences during pregnancy.
Host Michelle Mullens is joined by Bethany Weathersby, Founder of the Allo Hope Foundation, to connect diagnostic science with real patient experiences. Together, they explain how alloimmunization occurs, why many patients are unaware of their risk and how laboratory testing plays a central role in guiding care.
The conversation reveals how gaps in awareness, inconsistent care practices and delays in acting on lab results can significantly impact outcomes. It also highlights the importance of patient advocacy and collaboration between laboratories, clinicians and patients to improve care pathways.
Episode 57: Understanding and addressing syphilis trends in the United States
Click here to learn more about Episode #57
Our latest episode of QuidelOrtho Science Bytes addresses a public health paradox: while early-stage syphilis cases in the U.S. are declining, congenital syphilis continues to rise despite being entirely preventable.
Host Josh Casey is joined by Andrea Ott‑Vasconi, Director of Scientific Affairs and Regulatory at QuidelOrtho, to unpack CDC data and explain why missed or delayed screening during pregnancy is driving congenital infections. Together, they explore how syphilis testing works, when infections are being missed and why repeat screening is essential, especially later in pregnancy.
This episode makes one message clear: we have the tools, evidence and opportunity to reverse current trends if testing is timely, repeated and accessible.
Episode #56: Every minute matters: The power of high-sensitivity troponin
Click here to learn more about Episode #56
Our latest episode of QuidelOrtho Science Bytes features Dr. Lindy Carlstrom, Global Medical Affairs Manager for Acute Care, unpacking how high-sensitivity troponin is reshaping early cardiac diagnosis, where seconds matter most.
From detecting heart injury earlier and reducing emergency department bottlenecks to improving equity in cardiac care with sex-specific cutoffs, this episode highlights how precision diagnostics are accelerating decision-making and improving patient outcomes. Dr. Carlstrom explains the power of serial testing, the importance of assay precision and why today’s emergency teams rely on high-sensitivity troponin to confidently rule in, or rule out, acute coronary events.
High sensitivity troponin is more than a test, it’s a critical link in a faster, safer, more informed cardiac care pathway. Tune in to learn how this powerful tool is helping clinicians deliver timely insight when it matters most.
Episode #55: Blood donor Awareness
Click here to learn more about Episode #55
Our 55th episode of QuidelOrtho Science Bytes features Michelle Mullens, Global Portfolio Marketing Manager for Transfusion Medicine, diving into the evolving realities of today’s blood supply, and why steady, year‑round donation is critical to modern healthcare.
From the constant demand driven by everyday trauma to climate‑related disruptions that strain regional inventories, shifting prehospital practices that rely heavily on universal blood types and the growing role of automation in stabilizing testing workflows, this episode explores the interconnected systems that keep patients safe. Mullens shares how donor habits, resilient infrastructure and smarter immunohematology platforms help ensure blood is available when and where it’s needed most.
Sustaining the blood supply isn’t just about meeting demand, it’s about building a resilient, connected system where donors, diagnostics and clinical care work together to protect patients every day.
2025
Episode #54: 2025 Diagnostic Trends and Innovations
Click here to learn more about Episode #54
Our 54th episode of QuidelOrtho Science Bytes features Jonathan Siegrist, PhD, Executive Vice President of Research & Development and Chief Technology Officer, exploring the breakthroughs shaping diagnostics in 2025.
From high-sensitivity troponin testing for faster cardiac care to non-invasive assays improving gastrointestinal health, rapid combo tests for respiratory surges and advances in molecular diagnostics, informatics and AI – these innovations are transforming workflows, guiding timely decisions and redefining patient care across the continuum.
Dr. Siegrist shares how cutting-edge research and next-generation platforms are driving smarter diagnostics – delivering fast, reliable insights that empower clinicians and improve outcomes worldwide.
This podcast includes forward-looking statements within the meaning of the Private Securities Litigation Reform Act of 1995. Actual results may differ from those expressed in these statements. For full details, please review our complete disclaimer at the end of the transcript available for download here
. Dr. Ding shares how diagnostics and emerging biomarkers are helping reshape diabetes care – delivering fast, reliable insights that support proactive treatment and healthier outcomes.
Episode #53: Don’t Wait for the Wake-Up Call
Click here to learn more about Episode #53
Our 53rd episode of QuidelOrtho Science Bytes features Dr. Qian Ding, MD, PhD, exploring why early detection of diabetes is a clinical and economic imperative.
From identifying silent disease progression to leveraging smarter lab platforms, early testing empowers clinicians to intervene sooner, personalize care and help prevent costly complications.
Dr. Ding shares how diagnostics and emerging biomarkers are helping reshape diabetes care – delivering fast, reliable insights that support proactive treatment and healthier outcomes.
Episode #52: The Power of informatics in Clinical Decision-Making
Click here to learn more about Episode #52
Our 52nd episode of QuidelOrtho Science Bytes features George Wierschem, Senior Global Product Manager – informatics, discussing how informatics is transforming clinical labs. From streamlining workflows to strengthening cybersecurity, informatics helps labs turn data into decisions – faster, smarter and more securely.
George shares how modern platforms improve lab efficiency, ensure data integrity and support better patient outcomes through centralized access, automation and accountability.
Episode #51: Through the Shades of Illness, Testing Brings Clarity
Click here to learn more about Episode #51
Our 51st episode of QuidelOrtho Science Bytes features Dr. Terry O’Neil, President and Medical Director of Urgent Care Pros, discussing why testing is essential when symptoms overlap during respiratory season. With conditions like strep, flu, RSV and COVID-19 often appearing similar at the outset, timely diagnostics provide clarity for both treatment and prevention.
Dr. O’Neil shares how rapid testing empowers urgent care providers to give patients clear answers, start appropriate treatment quickly, and reduce the risk of spreading illness to vulnerable family members and communities.
Episode #50: Staying Vigilant Against Respiratory Illnesses This School Year
Click here to learn more about Episode #50
Our 50th episode of QuidelOrtho Science Bytes features Dr. Jonathan Temte, a leading public health expert, discussing how schools, families and healthcare providers can stay ahead of respiratory illnesses this school year. As students return to classrooms, familiar viruses like flu, RSV and COVID-19 often resurge.
Dr. Temte explains why symptoms alone can’t reliably distinguish between these illnesses and how rapid diagnostics are essential for early detection, accurate treatment and preventing further spread.
How Urgent Diagnostic Testing Can Help Prevent Drug Overdose Deaths
Episode #49
In this episode, you'll hear a conversation with our own Vonda McAllister about the critical role of rapid diagnostic testing in helping prevent drug overdose deaths. Discover how early detection in emergency departments enables timely interventions when patients present with altered mental status or respiratory distress. The discussion explores the evolving landscape of substance abuse in 2025, including synthetic opioids like fentanyl, emerging threats like xylazine ("tranq") and the challenges of polydrug use, creating unpredictable and potentially fatal combinations.
Bloodlines: The Connection Between Blood Donation and Patient Health
Episode #48
In this episode, you'll hear a conversation with transfusion medicine expert Michelle Mullens about how blood donation underpins patient health and the critical role it plays in healthcare. Discover how donated blood is vital not only for trauma care, but also for cancer treatments, chronic illnesses like sickle cell disease, and a wide range of surgeries. The discussion explores the growing challenges of blood supply shortages, the importance of specialized blood types, and how automation in blood banks is helping labs maintain safety and efficiency despite staffing pressures. Learn how each donation makes a difference and why maintaining a robust blood supply is essential for patient care and safety.
Diagnostic Pathways to Women’s Health and Wellness
Episode #47
In this episode, you'll hear a conversation with three women's health experts about how early diagnostic testing is transforming care for heart disease, STIs, and preeclampsia. Discover how proactive screening empowers women, supports personalized care, and helps shift healthcare from reaction to prevention.
Beyond burnout: Key factors and strategies to solve the laboratory staffing crisis
Episode #46
In this episode, we spotlight the essential yet often-overlooked role of medical laboratory technologists – the backbone of today’s healthcare. With 70% of clinical decisions relying on lab results, these professionals face challenges including staffing shortages, rising diagnostic demands, burnout and low compensation. We explore what's driving the crisis and, more importantly, what can be done to solve it.
Under attack: Sepsis and patient safety in the age of antibiotic resistance
Episode #45
This episode discusses the growing threat of sepsis, a life-threatening condition caused by the body's overwhelming response to an infection. It explores the connection between the rise in sepsis cases and the increasing problem of antibiotic resistance, highlighting the importance of effective diagnostic tools and antibiotic stewardship programs in combating this public health challenge.
Take heart: How Point-of-Care Cardiac Diagnostics Save Time and Lives
Episode #44
In this episode, we’ll discuss the importance of cardiac testing at the point of care with two renowned experts on the topic, doctors Martin Than and Paul Collinson. Both of our guests today have extensive experience on the front lines of patient care and have witnessed firsthand how point-of-care testing can save time and save lives.
Value of Metrics in the Laboratory Environment
Episode #43
In this episode, we’ll explore how quality performance metrics are transforming clinical laboratory operations and why measuring the details – from accuracy to turnaround times – are essential for improving everything from test results to patient care.
2024
Preventing Rh Disease, the evolution from discovery to ongoing challenges
Episode #42
In our latest Science Bytes podcast episode, Dr. Steven Spitalnik, Professor of Pathology at Columbia University, takes us through the inspiring journey of Rh Disease prevention. From groundbreaking discoveries to today’s biggest challenges, Dr. Spitalnik brings clarity to this important, often-overlooked field.
Spotlight on syphilis: Breaking the chain with early detection
Episode #41
The syphilis epidemic in the U.S. is a growing public health crisis, with rates increasing by 76% from 2018 to 2022. Syphilis is preventable and curable, but early detection is key—especially for pregnant women, where timely testing can prevent congenital syphilis.
Don’t miss this episode on the solutions to this growing epidemic. Let’s work together to combat the syphilis crisis and improve patient outcomes through better testing and early detection
She's not 'just tired': Exposing the hidden thyroid epidemic in women
Episode #40
Did you know that women are 10 times more likely than men to develop a thyroid condition, yet often remain undiagnosed due to medical bias and lack of awareness? We often see women present themselves to an emergency department with health concerns that are brushed off as “stress” or “weight-related” versus conducting diagnostic testing to identify the root cause.
How can we address that?
Don’t miss this episode on how healthcare providers can address these types of biases including timeliness of diagnosis, screening practices and interpretation of lab results to enhance the quality of care for women with thyroid conditions.
2023
Identifying Lesion-Causing Viral Pathogens
Episode #39
The World Health Organization estimates 67% of people under age 50 globally have herpes simplex virus type 1 (HSV-1) infection, the main cause of oral herpes, and 13% of those age 15–49 worldwide have herpes simplex virus type 2 (HSV-2) infection, the main cause of genital herpes.
In this podcast episode, Lori Henderson, the Senior Global Product Manager at QuidelOrtho, talks about the complexities in diagnosing herpes simplex virus, the most common viral causes of cutaneous and mucocutaneous lesions, as well as innovations in molecular diagnostics that play a critical role in managing HSV.
Hyperhemolysis Syndrome in the Patient With Sickle Cell Disease
Episode #38
Sickle cell disease (SCD) patients are at risk of developing multiple complications from transfusions, including alloimmunization to red blood cell antigens, delayed hemolytic transfusion reactions and hyperhemolysis syndrome (HHS). While HHS is a rare complication of repeat blood transfusions in patients with SCD, clinicians and the laboratory have important roles in its detection and management.
In this podcast, Wally R. Smith, MD, the inaugural Florence Neal Cooper Smith Professor of Sickle Cell Disease at Virginia Commonwealth University shares insights to screening for and managing HHS.
Sigma Metrics and the Value of Real World Evidence
Episode #37
Six Sigma is a popular way to measure quality. Sigma metrics have been adapted for the clinical laboratory by incorporating observed accuracy, precision and total error allowed (TEa). In vitro diagnostic (IVD) manufacturers have used Six Sigma to assess the quality of their assays using a small number of well-controlled systems to generate the data. QuidelOrtho has developed a novel approach to assess laboratory Sigma metrics for a broad range of assays using data from over 1,300 Vitros® instruments used in clinical labs.
In this podcast, Johanna Miller, data scientist at QuidelOrtho, discusses the value of using real-world data to perform Sigma metric studies and how a lab can use this information.
The Surprising Benefits of Becoming a Repeat Blood Donor
Episode #36
Each year 4.5 million lives are saved by blood transfusions thanks to blood donations. More than 118 million units of blood are donated worldwide every year but less than 10% of people who can donate blood will give.
These repeat blood donors enjoy benefits of their own while providing their lifesaving gift. Donating blood burns 650 calories, reduces stress, provides an emotional lift and has physiological benefits.
In this podcast, Dr. Mark A. Levine shares the critical importance of blood donation and how repeat donors enjoy both emotional and physical health benefits.
A Comprehensive Discussion of Reference Intervals
Episode #35
Reference intervals (RIs) are a fundamental decision support tool used by clinicians and lab professionals to interpret laboratory reports and assess an individual’s health status. The establishment of reference intervals, however, can be challenging due to many physiological factors that influence their values and heterogeneities that inherently exist in populations.
In this podcast, Dr. Lindy Crimmins will provide a comprehensive explanation of the influencing factors and evolving methodology of RIs from how they are established to how they are advancing.
Managing Febrile Transfusion Reactions
Episode #34
Transfusion reactions are adverse events associated with the transfusion of whole blood or one of its components. They range in severity from minor to life-threatening and can occur during a transfusion, termed acute transfusion reactions, or days to weeks later, termed delayed transfusion reactions. Transfusion reactions may be difficult to diagnose as they can present with non-specific, often overlapping symptoms. The most common signs and symptoms include fever, chills, urticaria, and itching. Some symptoms may resolve with little or no treatment. However, respiratory distress, high fever, hypotension, and hemoglobinuria may indicate a more serious reaction. All cases of suspected reactions should prompt immediate discontinuation of the transfusion and notification of the blood bank and treating clinician.
In this podcast episode, you will learn the evaluation and management of transfusion reactions and highlights the role of interprofessional team members in collaborating to provide well-coordinated care and enhance outcomes for affected patients.
Partial D Phenotype and Hemolytic Disease in Babies
Episode #33
Alloimmune hemolytic disease of the fetus and newborn (HDFN) may occur when a pregnant woman has an antibody against an antigen on the fetal red cells inherited from the father. Many antibodies to red blood cell antigens can cause HDFN, including those from the ABO, Rh, and other blood group systems. Women can develop antibodies either through previous pregnancy or transfusion.
In this podcast episode, we will discuss the types of HDFN, the role that partial D groups, and the presence of anti-D as it relates to its prevalence, prognosis, and management.
The Role of IVD To Detect Thyroid Disorders and Ensure Proper Treatment
Episode #32
According to the American Thyroid Association, as many as 60 percent of those with a thyroid disorder are unaware of their condition, and women are 5 to 8 times more likely than men to develop thyroid disease. If left untreated, thyroid dysfunction increases an individual’s risk for other serious conditions such as cardiovascular disease, infertility and osteoporosis.
Laboratory testing plays an important role to help diagnose and monitor thyroid disease states.
How Are Blood Groups Discovered?
Episode #31
The fascinating history of the discovery of blood groups goes back to 1900 with the breakthrough that came when Dr. Karl Landsteiner, an Austrian scientist, discovered three human blood groups. These were the A, B, and O blood groups. Two students who worked with Karl Landsteiner discovered the fourth human blood group, the AB. These two were A. van Decastello and A. Sturli. These four blood groups together are what we today know as the ABO blood group system. In this podcast episode with Dr. Jill Storry, you will learn the fascinating journey behind discovering blood groups and stay up to date on the latest blood groups that have been discovered.
2022
The Evolving Cybersecurity Environment in Laboratories
Episode #30
The cybersecurity landscape continues to evolve. Health Care Companies Are the #1 Target for Cyberattacks and Data Breaches. The pace of release of cybersecurity guidance and regulations for medical devices across the globe has been accelerating. Globally, some regulatory bodies have restricted their guidance to premarket concerns, and others have provided guidelines to include post-market considerations. One of the key tenants of all post-market cybersecurity guidance and regulations is the manufacturer’s responsibility to evaluate and maintain their product cybersecurity continually. This additional level of scrutiny and regulations only increases the need to act now. To prepare for and combat these cyberattacks, health care companies must make the necessary investments in people, processes and technology. A reactive approach to cybersecurity is no longer feasible. It’s time to anticipate and prevent these attacks before they even arrive. Learn in this episode how new, predictive technologies analyze past threats to identify future threats. Ideally, this results in the detection of potentially harmful files or behaviors before an attack is successful..
Diagnostic Testing for Type I/II Diabetes and Associated Complications
Episode #29
World Diabetes Day takes place each year in the month of November, created to raise awareness about the disease. Diabetes is a global health threat diabetes with the number of people living with diabetes continuing to rise. Diagnostic testing is one of the major tools to help prevent and manage the disease.
Resolving Antibodies to High-Prevalence Antigens
Episode #28
High-prevalence antigens occur in greater than 99% of the population. Antibodies to high-prevalence antigens are rare and may be difficult to identify due to the lack of antigen-negative panel cells for these antigens. Examples of antibodies to high-prevalence antigens are: anti-k, anti-Kpb, anti-Jsb, and anti-Lub among many others There is a need to proper identify these antibodies before transfusion to differentiate clinically significant antibodies, that could cause hemolytic transfusion reactions or hemolytic disease of the fetus and newborn from those with little or no clinical relevance. Their specific identification is often difficult, labor-intensive, and time-consuming and it may be difficult to find antigen-negative compatible blood for the patient in need of a transfusion Learn in this episode clues to recognize if an antibody to a high-prevalence antigen is present and how to apply practices for their identification in the lab and additional recommendations for patient management.
Understanding sepsis, its detection and treatment strategies
Episode #27
Sepsis occurs when the body’s immune system responds to an infection and injures its own tissues and organs. It is a medical emergency, requiring early detection and treatment as it can lead to septic shock, multi-organ failure, and death. One in five deaths worldwide is associated with sepsis and 40% of cases are in children under five years of age. Sepsis is the number one cause of death in hospitals, the number one cause of hospital readmissions, and the number one healthcare cost.
Laboratory testing is essential in helping prevent, detect, and treat sepsis to minimize injury to the body and the risk of death.
Key Learnings on Rare Blood Programs
Episode #26
A rare donor program is a collaborative effort of many blood centers and/or hospitals to combine their rare donor resources to supply what they have to patients in need. These centers work to identify rare donors by screening methods and inclusion in database systems.
Learn in this episode what resources are available to the medical community to ensure availability for patients in need of blood and why it is critical to national and international collaboration through joint programs.
The Need for Safe and Reliable Blood Donations for the Sickle Cell Disease Population
Episode #25
In Sickle Cell Disease (SCD) patients, one of the most critical treatments is a blood transfusion. A blood transfusion is used to provide normal red blood cells to the patient’s body. Red blood cell transfusions help lessen anemia and reduce the blood’s viscosity, allowing it to flow more freely, ease disease symptoms and prevent complications. Alloimmunization is common in patients with SCD and may complicate transfusion therapy. For many patients, a close blood type match is essential and is found in donors of the same race or similar ethnicity.
In this episode, learn why patient phenotyping and prophylactic matching to reduce alloimmunization is recommended for SCD patients and why donor source for blood donations of the same race or similar ethnicity is critical.
Laboratory Strategies for Diagnosis and Monitoring of Hepatitis C Virus Infection
Episode #24
The World Health Organization estimated that during 2019, 58 million people worldwide were living with the Hepatitis C virus (HCV) which causes inflammation of the liver. All types of hepatitis can be controlled or prevented. There is a cure for Hepatitis C; however, HCV infection is often undiagnosed because it remains asymptomatic until symptoms appear that are related to serious liver damage, a complication of the infection.
Laboratory Investigations for Maternal Health Testing
Episode #23
Maternal health refers to women’s health during pregnancy, childbirth, and the postnatal period. Each stage should be a positive experience, ensuring women and their babies reach their full potential for health and well-being. Prenatal care includes screening and diagnostic tests and they can provide valuable information about the baby's health. Understand the risks and benefits. Learn in this episode what are the strategies to minimize the risk of alloimmunization in the maternal population and what are the recommendations for antenatal and post-delivery care testing.
Diagnosing Chronic Kidney Disease
Episode #22
It is estimated that between 8 and 10% of the global adult population has some form of kidney damage. Early detection of kidney damage is critical. If left undetected, chronic kidney disease can lead to kidney failure which means regular dialysis treatment or a kidney transplant is necessary for survival. In this podcast episode, we will discuss who is at risk for chronic kidney disease, screening strategies, and ways to classify the level of impairment. In addition, we’ll discuss a unifying approach for estimating glomerular filtration rate (eGFR) in the United States with the recommendations published by a task force established by the National Kidney Foundation and the American Society of Nephrology.
Heart Failure and the role of NT-proBNP
Episode #21
Heart Failure (HF) is a common disease that affects an estimated global population of over 40 million. It is the most frequent cause of hospitalizations in patients over the age of 65, placing a considerable financial and social burden on patients, healthcare providers, and care providers. Accurate clinical assessment of HF and cost-effective management strategies are critical in improving patient outcomes and reducing the socioeconomic burden of this disease.
Role of the Donation Screening Lab
Episode #20
The need for a sufficient supply of safe blood is constant and globally there is an ongoing need for effective blood programs as they are critical to support patient management. The role of the donor/donation screening lab is fundamental to the protection and maintenance of the donor inventory and supply since it performs the screening of donors prior to collection of a donation to determine if the donor is ‘suitable’ to be able to donate on that occasion with the end goal of providing safe blood products for transfusion.
2021
Ensure safety with a Quality Certificate Program
Episode #19
Learn in this episode from AABB consulting services how commitment to safety and quality is available with the new AABB Quality Certificate Program – Based on AABB’s Fundamental Standards for Blood Collection and Transfusion, the Certificate is an internationally recognized distinction, acknowledging your facility’s commitment to a culture of quality and excellence.
The Role of the Lab in the Prevention and Management of Diabetes: A Physician’s Perspective
Episode #18
Diabetes is a global health threat diabetes with the number of people living with diabetes continuing to rise. Diagnostic testing is one of the major tools to help prevent and manage the disease. In this podcast episode, we will have a conversation with Dr. Ivan Salgo, Head of Medical, Clinical, and Scientific Affairs at Ortho Clinical Diagnostics about the role laboratory testing plays in the prevention and management of diabetes.
Key learnings from COVID-19 for the Labs with Dr. Arturo Casadevall
Episode #17
The COVID-19 pandemic has been already in our lives since late 2019 and the variants surge is rapidly increasing. Is there anything we can learn from the experience? Fast forward to the fall of 2021, what are the recommendations for Hospitals and Laboratories around the world for the current pandemic and future spread of diseases? In this podcast episode, we will have a conversation with Dr. Arturo Casadevall an infectious disease specialist and Bloomberg Distinguished Professor at Johns Hopkins University about learnings from this pandemic, vaccines, variants, and how antibody testing can play a key role.
Automation is Possible for All Laboratories
Episode #16
With increasing compliance requirements and resource challenges around the world, there is a growing need for the integration of digital platforms to reduce errors, reduce the need for double checks/signoffs, and provide greater process efficiency. There is a need for laboratories to implement workflow tools that automate processes and test rules to improve efficiency. Join our speaker in learning how in an evolving health care industry automation is possible for the laboratory's goals.
How to manage Partial D in donors and patients
Episode #15
After the success of our April episode, “Your Lab Journey With the Rh System and Weak D,” we continue the topic. Tune in for a conversation about partial D, the differences, types, and implications it has on transfusion.
Are Process Excellence and Lean the same thing?
Episode #14
Process Excellence is a proven way to cut costs, raise productivity, and improve service levels. PEx® combines the tools and methodologies of: Six Sigma—measuring and reducing your error and defect rate Lean Thinking—eliminating waste to speed your workflow and deliver better value. Design Excellence—structuring a process from the outset so that it flows efficiently with minimal opportunities for waste or error This podcast will provide the tools to understand the benefit of Process Excellence in your Lab to achieve goals regarding efficiency and performance.
Overcoming the Challenges of Blood and Plasma Supply with Dr. Pampee Young
Episode #13
Every two seconds someone in the U.S. needs blood. It is essential for surgeries, cancer treatment, chronic illnesses, and traumatic injuries. Whether a patient receives whole blood, red cells, platelets, or plasma, this lifesaving care starts with one person making a generous donation. 1 blood donation can potentially save 3 lives and now the conversation is towards convalescent plasma donations as a promising therapy for COVID-19, the journey to support during critical times starts with the donor qualification. In this episode, Dr. Pampee Young will provide background on the needs and challenges of blood banks and donor centers for blood and plasma supply and practices sharing plans to overcome them.
Key facts about antibody titers in transfusion medicine that you can’t miss!
Episode #12
During this episode, Dr. Claudia Cohn will provide background on the role of antibody titers for diagnosis and monitoring performed in the transfusion medicine lab and its clinical applications.
Your Lab Journey with the Rh System and Weak D
Episode #11
Discover along with Tony Casina the marvelous world of Rh D system’s complexity and why weak D is clinically relevant
The Impact of Innovation in the Health Care System
Episode #10
Innovation can refer to something new or to a change made to an existing product, idea, or field. In this episode we discuss what Innovation means, its importance in the current healthcare ecosystem and how this concept can impact Lab performance.
The Role of High Throughput Antigen SARS-CoV-2 Testing in a Large, Metropolitan Hospital System
Episode #09
Wondering how a large, metropolitan hospital is dealing with testing for the surging number of COVID-19 cases? In this episode, Dr. Karen Roush will discuss how her hospital is leveraging a high throughout antigen testing solution to meet the demands of COVID-19 testing.
Safety measures for blood products for Sars-CoV-2
Episode #08
With more than 100 million COVID-19 cases worldwide, what’s the impact of the virus on our blood supply? What’s the risk of transfusion-transmitted infection? Is COVID-19 convalescent plasma (CCP) safe? Can pathogen reduction technologies (PRT) help? In this episode, Dr. Ray Goodrich answers these hard questions and more.
Is Sars-Cov-2 transmitted by blood transfusion?
Episode #07
Can Sars-Cov-2, the virus that causes COVID-19, be transmitted by blood transfusion? In this episode we will discuss with an Infectious Disease Specialist key points behind the precedent for respiratory viruses, factors to consider in an assessment for a pathogen to cause transfusion transmitted infection, the data available and the recommendations to maintain blood safety.
2020
The importance of extended antigen typing in Transfusion Medicine
Episode #06
Tony Casina discusses the role of extended antigen typing or phenotyping and how this practice plays a critical role in preventing the development of foreign antibodies in chronically transfused patients
Do antibodies to COVID-19 disappear?
Episode #05
Listen as Dr Akiko Iwasaki from Yale Medicine discusses COVID-19 antibodies in depth, including the range of immune responses and the role Spike S1 protein may play in controlling the course of the pandemic.
Do antibodies really provide immunity against COVID-19?
Episode #04
Are serological tests available today reliable enough to guide such critical decisions? In this podcast edition we will explore in detail the answers to those questions based on currently available scientific information
The Association Between Blood Type and COVID-19
Episode #03
Tony Casina reviews the history of the association between blood type and development of diseases and whether literature answers the question if there are certain blood types associated with COVID-19.
Why Convalescent Plasma for COVID-19?
Episode #02
Matt Dawson discusses why COVID-19 Convalescent Plasma has been used as a treatment and what are the scientific and clinical basis for its use with Dr. Lily Li.
You, a Blood Donor: Be part of 2000 years in Transfusion Medicine's History
Episode #01
Speaker Tony Casina reviews the history of the association between blood type and development of diseases and whether literature answers the question if there are certain blood types associated with COVID-19


Legal Notice
By accessing, browsing, and/or using this website, you acknowledge that you have read, understood, and agree to be bound by QuidelOrtho’s Website Terms of Use
, Privacy Notice
and to comply with all applicable laws and regulations. If you do not agree to these terms, do not use the website. Additionally, the website contains information on products that is targeted to many different audiences and could contain product details or information otherwise not accessible or valid in your country. Product availability may vary from country to country and is subject to varying regulatory requirements. New QuidelOrtho branding may not be available in all markets, subject to country specific regulatory approval. Please be aware that we do not take any responsibility for your accessing such information that may not comply with any legal process, regulation, registration, or usage in the country of your origin.
©2026 QuidelOrtho Corporation. All rights reserved.
QuidelOrtho Corporation
9975 Summers Ridge Road, San Diego, CA 92121, USA

By clicking “Accept All Cookies”, you agree to the storing of cookies on your device to enhance site navigation, analyze site usage, and assist in our marketing efforts.
Cookies Settings Reject All Accept All Cookies

Privacy Preference Center
When you visit any website, it may store or retrieve information on your browser, mostly in the form of cookies. This information might be about you, your preferences or your device and is mostly used to make the site work as you expect it to. The information does not usually directly identify you, but it can give you a more personalized web experience. Because we respect your right to privacy, you can choose not to allow some types of cookies. Click on the different category headings to find out more and change our default settings. However, blocking some types of cookies may impact your experience of the site and the services we are able to offer.
More information
Allow All
Manage Consent Preferences
Functional Cookies
Functional Cookies
These cookies enable the website to provide enhanced functionality and personalisation. They may be set by us or by third party providers whose services we have added to our pages. If you do not allow these cookies then some or all of these services may not function properly.
Targeting Cookies
Targeting Cookies
These cookies may be set through our site by our advertising partners. They may be used by those companies to build a profile of your interests and show you relevant adverts on other sites. They do not store directly personal information, but are based on uniquely identifying your browser and internet device. If you do not allow these cookies, you will experience less targeted advertising.
Strictly Necessary Cookies
Always Active
These cookies are necessary for the website to function and cannot be switched off in our systems. They are usually only set in response to actions made by you which amount to a request for services, such as setting your privacy preferences, logging in or filling in forms. You can set your browser to block or alert you about these cookies, but some parts of the site will not then work. These cookies do not store any personally identifiable information.
Performance Cookies
Performance Cookies
These cookies allow us to count visits and traffic sources so we can measure and improve the performance of our site. They help us to know which pages are the most and least popular and see how visitors move around the site. All information these cookies collect is aggregated and therefore anonymous. If you do not allow these cookies we will not know when you have visited our site, and will not be able to monitor its performance.
Back Button
Cookie List
Search Icon
Filter Icon
Clear
checkbox label label
Apply Cancel
Consent Leg.Interest
checkbox label label
checkbox label label
checkbox label label
Reject All Confirm My Choices


 View original content to download multimedia:

 View original content to download multimedia:

 View original content to download multimedia:

 View original content to download multimedia:











 Log in






 View original content to download multimedia:


 View original content to download multimedia:


 View original content to download multimedia:


 View original content to download multimedia:


 View original content to download multimedia:



 View original content to download multimedia:

 View original content to download multimedia: