November 5, 2026
Raises Full-Year Outlook and Introduces Strategic Plan to Strengthen Fundamentals and Drive Long-Term Value Creation
OAK BROOK, Ill., Nov. 05, 2026 (GLOBE NEWSWIRE) -- Portillo’s Inc. (“Portillo’s” or the “Company”) (NASDAQ: PTLO), a restaurant concept known for its menu of Chicago-style favorites, today reported financial results for the third quarter ended September 27, 2026.
Third Quarter 2026 Highlights (vs. Third Quarter 2025):
-
Total revenue of $194.1 million, an increase of 7.0% or $12.6 million
-
Same-restaurant sales increase of 1.4%
-
Net income of $4.8 million, an increase of $4.0 million; Adjusted EBITDA(1) of $26.5 million, an increase of $5.1 million
-
Raises full-year 2026 Adjusted EBITDA guidance
(1) Adjusted EBITDA is a non-GAAP measure. Please see definition and the reconciliation of this non-GAAP measure accompanying this release.
“We delivered third-quarter results ahead of our expectations, and I’m encouraged by the early progress from the actions we have taken to strengthen our operations and business fundamentals,” said Brett Patterson, Portillo’s Chief Executive Officer. “While we are encouraged by the progress, one quarter does not establish a trend. We have significant work ahead, and our focus remains on executing consistently and building a foundation for durable profitable growth.”
“Today, we are also introducing a strategic plan focused on strengthening our core business, driving profitable growth and creating shareholder value,” Patterson continued. “Our strategy is centered on running great restaurants, leveraging integrated marketing and pursuing disciplined development, all underpinned by a financial framework that guides decisions, strengthens accountability and positions Portillo’s for long-term success.”
“Lastly, we evaluated every restaurant in the system and made the decision to close a select group of underperforming locations outside of Chicagoland,” said Patterson. “This will improve portfolio quality, strengthen returns on invested capital and reflect our commitment to disciplined growth.”
Third Quarter 2026 Financial and Operating Results
Revenues for the quarter ended September 27, 2026 were $194.1 million compared to $181.4 million for the quarter ended September 28, 2025, an increase of $12.6 million or 7.0%. The increase in revenues was primarily attributed to the opening of eight restaurants in fiscal 2025 and seven restaurants during the three quarters ended September 27, 2026 and an increase in our same-restaurant sales. Restaurants not in our Comparable Restaurant Base (as defined below) contributed $10.3 million of the total year-over-year increase. Same-restaurant sales increased 1.4%, or $2.4 million, in the quarter. The same-restaurant sales increase was attributable to an increase in average check of 2.1%, partially offset by a decrease in transactions of 0.7%. The higher average check was driven by an approximate 2.1% increase in certain menu prices. For the purpose of calculating same-restaurant sales for the quarter ended September 27, 2026, sales for 87 restaurants that were open for at least 24 full fiscal periods were included in the Comparable Restaurant Base.
Total restaurant operating expenses for the quarter ended September 27, 2026 were $154.0 million compared to $144.7 million for the quarter ended September 28, 2025, an increase of $9.3 million or 6.4%. The increase was primarily driven by the opening of eight restaurants in fiscal 2025 and seven restaurants during the three quarters ended September 27, 2026.
General and administrative expenses for the quarter ended September 27, 2026 were $19.8 million compared to $20.0 million for the quarter ended September 28, 2025, a decrease of $0.3 million or 1.4%. This decrease was primarily attributable to $3.3 million of lower dead site costs resulting from our 2025 strategic reset. This was partially offset by $1.4 million of restructuring charges related to a workforce reduction at the Restaurant Support Center and by the absence of a $1.1 million net benefit recognized in the prior year in connection with the Chief Executive Officer transition. The prior year benefit was driven by the forfeiture of equity awards, partially offset by severance and other transition-related expenses.
Operating income for the quarter ended September 27, 2026 was $11.8 million compared to $5.4 million for the quarter ended September 28, 2025, an increase of $6.3 million or 116.8%, primarily due to the aforementioned changes in revenue and expenses, lower pre-opening expenses of $2.6 million, and a favorable year-over-year change in other (income) loss, net, of $1.1 million, as the prior-year period included a legacy Barnelli’s trade name impairment charge that did not recur in the current year.
Net income for the quarter ended September 27, 2026 was $4.8 million compared to a net income of $0.8 million for the quarter ended September 28, 2025, an increase of $4.0 million or 508.2%. The increase in net income was primarily due to an increase in operating income of $6.3 million due to the aforementioned factors, partially offset by an increase in income tax expense of $3.0 million and a decrease in the Tax Receivable Agreement liability adjustment of $0.6 million.
Restaurant-Level Adjusted EBITDA* for the quarter ended September 27, 2026 was $40.1 million compared to $36.7 million for the quarter ended September 28, 2025, an increase of $3.4 million or 9.3%.
Adjusted EBITDA* for the quarter ended September 27, 2026 was $26.5 million compared to $21.4 million for the quarter ended September 28, 2025, an increase of $5.1 million or 23.7%.
*A reconciliation of Restaurant-Level Adjusted EBITDA and Adjusted EBITDA and the nearest GAAP financial measure is included under “Non-GAAP Measures” in the accompanying financial data below.
Planned Restaurant Closures
Portillo’s expects to close a mid-to-high single digit number of underperforming restaurants outside of Chicagoland, with the majority occurring in the fiscal fourth quarter of 2026. In making this determination, the Company evaluated each restaurant’s sales performance, restaurant-level margins, and projected operating performance. These actions are part of the Company's ongoing efforts to improve restaurant-level profitability, strengthen returns on invested capital and optimize its restaurant portfolio. The Company expects the analysis to result in material cash and non-cash charges mostly in the fiscal fourth quarter of 2026.
New Restaurant Openings
During the three quarters ended September 27, 2026, we opened seven new restaurants for a total of 109 restaurants, as of the filing of this press release, including a restaurant owned by C&O, of which Portillo’s owns 50% of the equity. We plan to open one additional restaurant in the fourth quarter of 2026, which will be our second in-line location and will be located in Chicago, Illinois.
Below are the restaurants opened thus far in fiscal 2026:
| Location | Opening Month | Fiscal Quarter Opened |
| Fort Worth, Texas | January 2026 | Q1 2026 |
| Humble, Texas | February 2026 | Q1 2026 |
| Dallas, Texas | March 2026 | Q1 2026 |
| El Paso, Texas | March 2026 | Q1 2026 |
| Frisco, Texas | April 2026 | Q2 2026 |
| Schertz, Texas | May 2026 | Q2 2026 |
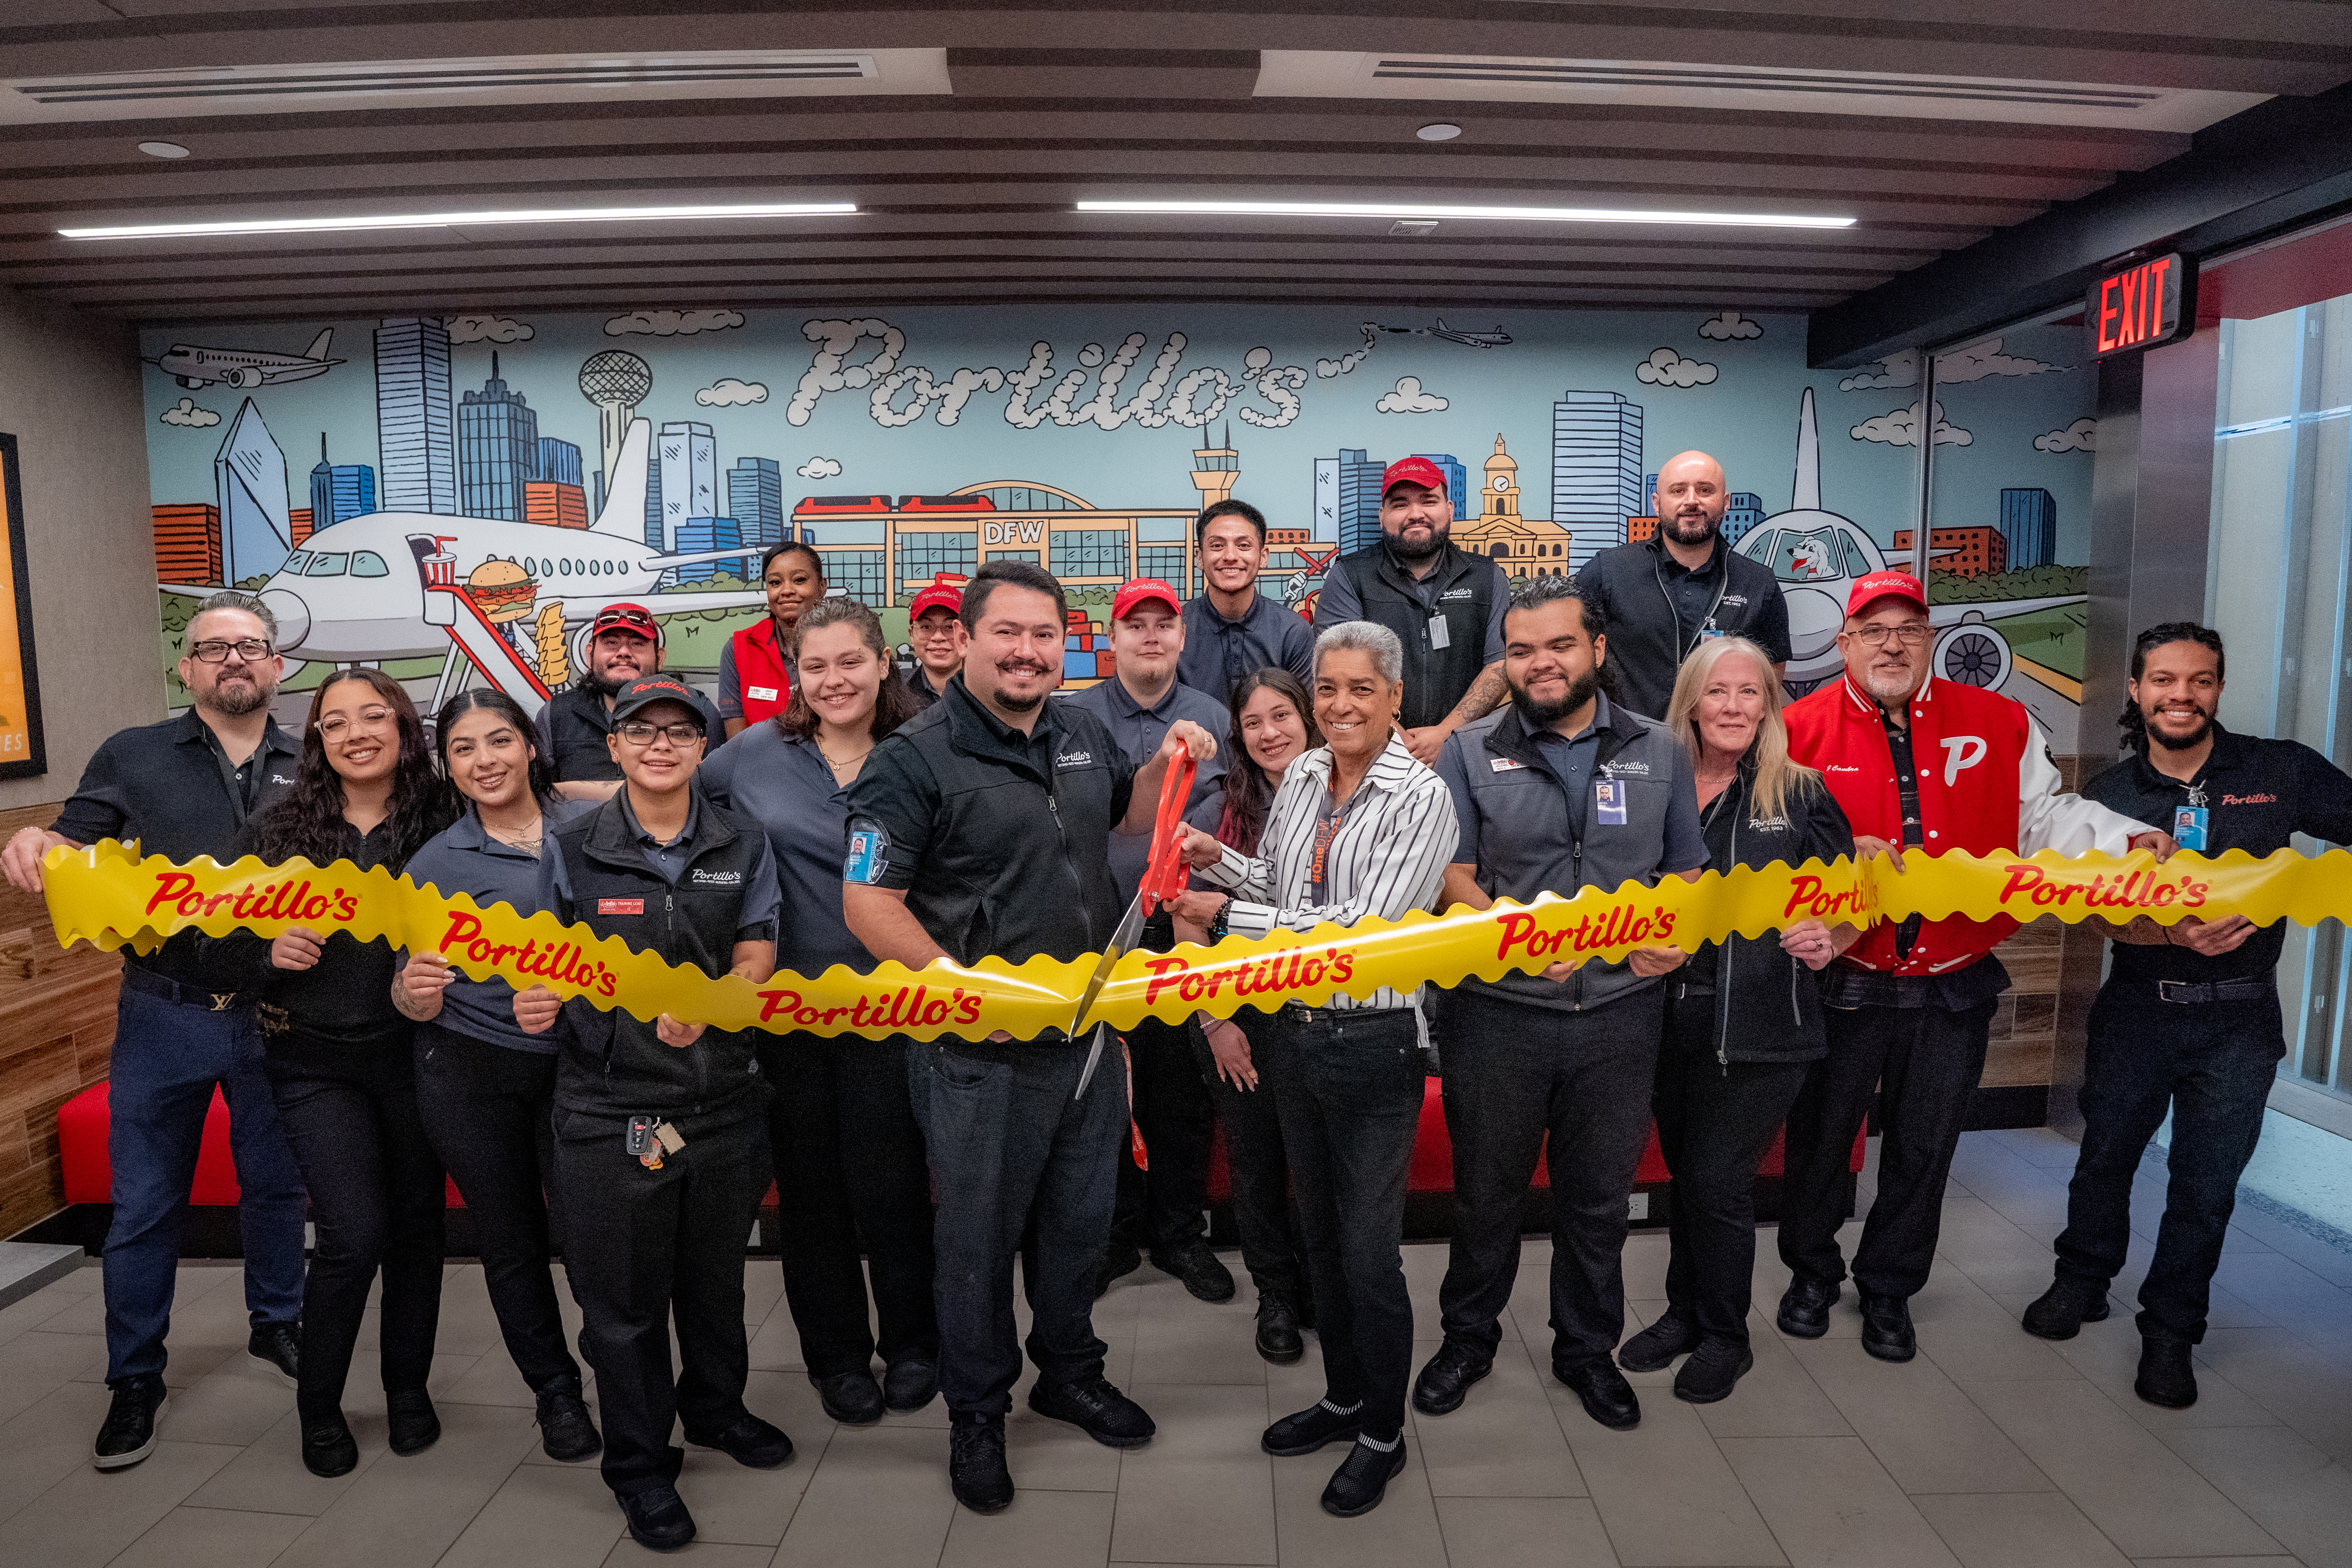
| Dallas-Fort Worth International Airport | May 2026 | Q2 2026 |
Portillo’s Details Growth Strategy to Strengthen Fundamentals and Create Shareholder Value
The foundation of Portillo’s strategy is rooted in three pillars: Operational Excellence, Integrated Marketing and Disciplined Development, supported by Financial Rigor and Discipline. The strategy reflects a candid assessment of the business and lessons from prior decisions, while preserving the distinctive food, hospitality and experience that make Portillo’s special.
Over the past nine months, Portillo’s has taken decisive actions to sharpen the Company’s focus and improve its cost structure:
-
Strengthened its leadership team and right-sized its corporate structure;
-
Built a deeper understanding of its guests through formal research;
-
Identified meaningful operational and supply chain savings;
-
Implemented a more rigorous site-selection model and developed a new prototype;
-
Exited future real estate agreements that lacked sufficient return potential; and
-
Evaluated its restaurant portfolio and identified underperforming restaurants for closure.
Formal third-party research studies confirmed that Portillo’s brand strength extends beyond the food to powerful emotional connections with guests in Chicagoland and beyond. These insights underpin the strategy and will inform a consistent decision framework that guides the path toward sustainable, profitable growth.
OPERATIONAL EXCELLENCE
Strengthened regional leadership support. Portillo’s has refined its regional leadership structure, reducing the number of restaurants each field leader oversees and the geographic distance between them. This allows field leaders to spend more time in each restaurant and provide focused, hands-on support to restaurant teams. The goal is consistent, high-quality food served accurately and on time to every guest, across every channel.
Elevating team member and management training to deliver consistent guest experiences. Portillo’s is updating all hourly and management training programs to equip restaurant teams with the skills, knowledge and tools needed to run great restaurants. Certified trainers will support these programs to ensure standards are followed consistently and training is effective, allowing well-trained team members to focus on delivering the unique Portillo’s experience.
Modernizing restaurant technology and equipment to improve accuracy and speed of service. Portillo’s is evaluating and investing in restaurant technology and equipment to improve reliability, product quality and operational consistency. These investments are expected to help restaurant teams deliver orders accurately, faster and, ultimately, with stronger hospitality.
INTEGRATED MARKETING
Refining the brand positioning and consumer targeting to drive growth. Guided by insights from the recent brand perception and customer segmentation studies, Portillo’s will better communicate its unique value proposition. The Company will prioritize two distinct millennial audiences identified in the research, which represent meaningful growth potential. Supported by a more refined brand positioning, creative approach and media strategy, Portillo’s aims to build on its strong emotional connection with these guests to drive relevance, demand and profitable growth.
Building digital and loyalty capabilities that match the strength of the brand. Portillo’s is developing a new digital roadmap and modernizing its marketing technology stack to improve the digital experience and drive conversion and sales. As part of this work, the Company is conducting a full assessment of Portillo’s Perks®, its loyalty program, to simplify the program, drive engagement and increase visit frequency.
Making core-menu quality and culinary innovation a priority. Portillo’s is returning to its roots by revitalizing its culinary culture, with a new Executive Chef overseeing menu strategy, core-menu quality and an innovation pipeline that creates food news and reasons to visit.
DISCIPLINED DEVELOPMENT
Implementing stricter standards governing growth. New data-driven sales modeling, paired with strict underwriting discipline, establishes a rigorous framework for new site selection. Locations will advance only after meeting cash-on-cash return targets consistent with the Company’s new-restaurant targets as well as passing qualifying market and site reviews.
Balancing new-market expansion and infill development. Portillo’s is balancing infill opportunities in existing markets with expansion into new, strategically adjacent markets. Infill development leverages operational efficiencies and existing restaurant support infrastructure, while adjacent markets capitalize on significant whitespace potential. The Company will prioritize markets with favorable development economics to drive sustainable, profitable growth.
Introducing a new restaurant prototype targeting a reduced capital investment. The 2028 prototype is approximately 4,600 square feet – more than 40% smaller than the previous average Portillo’s restaurant – without sacrificing the potential to generate high volumes. The site requires approximately 1.5 acres versus 3.0 acres historically. An optimized kitchen, standardized design and greater site flexibility are expected to improve throughput and productivity.
FINANCIAL RIGOR AND DISCIPLINE
Driving financial accountability and cost efficiency. Portillo’s is strengthening restaurant-level accountability by aligning incentive compensation with sales and profit growth. The Company remains focused on identifying savings in our operating model while preserving the Portillo’s experience and investing in initiatives that drive demand, enhance food quality and improve training to support long-term growth.
Prioritizing capital investments to drive shareholder value. Portillo’s will take a disciplined approach to capital allocation. First, the Company will prioritize investment in existing restaurants, including technology and maintenance to keep them clean, safe and well-maintained. Second, it will invest in new restaurant growth with projected returns on invested capital above its risk-adjusted cost of capital. Finally, excess cash will be directed toward reducing debt and balance sheet leverage to support long-term financial stability and shareholder value.
Establishing a path to sustainable, profitable growth. Based on the collective actions of its strategy, Portillo’s expects to deliver annual same-restaurant sales of 2% to 3%, and in the next three years, will ramp new restaurant growth to a high-single-digit percentage and expand margins, leveraging sales growth and efficiencies. All new restaurants beginning in 2028 will be targeted to achieve cash-on-cash returns greater than 20%.
Fiscal 2026 Financial Targets
Based on current expectations, inclusive of expected restaurant closures in the fourth quarter, fiscal 2026 outlook has been updated as follows:
| | Prior Target | | Current Targets |
| New Units | 8 new units | | 8 new units |
| Revenue | N/A | | $768-$773 million |
| Commodity inflation | Mid single digit | | Mid single digit |
| Labor inflation | 3% to 3.5% | | Low single digit |
| Restaurant-level adjusted EBITDA margin* | 19.5% to 20.5% | | 20.0% to 20.5% |
| General and administrative expenses | $78-$82 million | | $80-$82 million |
| Adjusted EBITDA* | $92-$96 million | | $98-$101 million |
| Capital expenditures | $55-$60 million | | Approximately $55 million |
*We are unable to reconcile the financial target for adjusted EBITDA and restaurant-level adjusted EBITDA margin to net income (loss) and operating income (loss) margin, the respective corresponding U.S. GAAP measure, due to variability and difficulty in making accurate forecasts and projections and because not all information necessary to prepare the reconciliation is available to us without unreasonable efforts. For the same reasons, we are unable to address the probable significance of the unavailable information because we cannot accurately predict all of the components of the adjusted calculations and the non-GAAP measure may be materially different than the GAAP measure.
The following definitions apply to these terms as used in this release:
**Change in Same-Restaurant Sales -**The change in same-restaurant sales is the percentage change in year-over-year revenue for the Comparable Restaurant Base, which is defined as the number of restaurants open for at least 24 full fiscal periods. As of the quarters ended September 27, 2026 and September 28, 2025, there were 87 and 76 restaurants in our Comparable Restaurant Base, respectively.
A change in same-restaurant sales is the result of a change in restaurant transactions, average guest check, or a combination of the two. We gather daily sales data and regularly analyze the guest transaction counts and the mix of menu items sold to strategically evaluate menu pricing and demand. Measuring our change in same-restaurant sales allows management to evaluate the performance of our existing restaurant base. We believe this measure provides a consistent comparison of restaurant sales results and trends across periods within our core, established restaurant base, and enables investors to better understand and evaluate the Company’s historical and prospective operating performance.
**Average Unit Volume -**AUV is the total revenue (excluding gift card and Portillo’s Perks loyalty program breakage) recognized in the Comparable Restaurant Base, including C&O, divided by the number of restaurants in the Comparable Restaurant Base, including C&O, by period.
This key performance indicator allows management to assess changes in consumer spending patterns at our restaurants and the overall performance of our restaurant base.
**Adjusted EBITDA and Adjusted EBITDA Margin -**Adjusted EBITDA represents net income before depreciation and amortization, interest expense, interest income, and income taxes, adjusted for the impact of certain non-cash and other items that we do not consider in our evaluation of ongoing core operating performance as identified in the reconciliation of net income, the most directly comparable GAAP measure to Adjusted EBITDA. Adjusted EBITDA Margin represents Adjusted EBITDA as a percentage of revenues, net. See also “Non-GAAP Financial Measures.”
**Restaurant-Level Adjusted EBITDA and Restaurant-Level Adjusted EBITDA Margin -**Restaurant-Level Adjusted EBITDA is defined as revenue, less restaurant operating expenses, which include food, beverage and packaging costs, labor expenses, occupancy expenses and other operating expenses. Restaurant-Level Adjusted EBITDA excludes corporate level expenses and depreciation and amortization on restaurant property and equipment. Restaurant-Level Adjusted EBITDA Margin represents Restaurant-Level Adjusted EBITDA as a percentage of revenues, net. See also “Non-GAAP Financial Measures.”