PRA Group, Inc. is a specialty finance company that purchases, collects, and manages nonperforming loan portfolios. The company operates in two reportable segments: the U.S. and Europe, with smaller operations in South America, Canada, and Australia. Its primary business involves acquiring Core accounts from credit originators who have ceased collection efforts, as well as Insolvency accounts involving bankruptcy or similar proceedings. PRA Group purchases various asset types, including general purpose and private label credit cards, consumer loans, auto loans, overdrafts, and small business loans. Collections are conducted through a mix of internal call centers, external vendors, legal recovery channels, and digital platforms. The company also provides fee-based services for class action claims recoveries in the U.S. PRA Group serves customers in multiple countries and collaborates with major banks, consumer finance companies, and auto finance providers. It maintains partnerships with organizations such as StepChange Debt Charity to support financial inclusion initiatives.

Summarised from the company's own disclosures, fiscal year ended Mar 2026

Industry Credit Services Homepage pragroup.com
Sector Financial Services IR page ir.pragroup.com
Tags
nonperforming loans, debt collection, insolvency management, class action recoveries, credit card debt, consumer loans, auto loans, bankruptcy claims, digital collections, legal recovery, StepChange Debt Charity
Press page ir.pragroup.com/press-releases

Metrics

Valuation  
Market cap $ 444.376M
Market cap (USD) $ 444.376M
P/E 2.88
PEG —
P/BV 0.42
P/S 0.34
P/OCF -10.14
P/FCF -9.04
Dividend yield —
Turnover / mcap —
Returns  
ROE -28.9%
ROI -6.5%
ROIC -0.49%
Profit margin -25.4%
Growth  
Revenue growing Yes
Profits growing No
Revenue up 3y No
Revenue up 5y No
Earnings growth 3y (net profit CAGR) —
Quality  
Profitable No
Margin expanding No
Buying back stock Yes
Diluting (TTM) No
Debt/Equity 377.3%
Podcast bulls (TTM) Sign up
Podcast bears (TTM) Sign up
Podcast sentiment (TTM) Sign up
Podcast sentiment % (TTM) Sign up
News sentiment (TTM) 18
Quality score -23.5%
Insiders  
Buys, 1w Sign up
Buys, 1m Sign up
Buys, 1y Sign up
Sells, 1w Sign up
Sells, 1m Sign up
Sells, 1y Sign up

Sign up to see this company's insider trades

Figure FY 2025 FY 2024 FY 2023 FY 2022 FY 2021 FY 2020 FY 2019 FY 2018 FY 2017 FY 2016 FY 2015 FY 2014 FY 2013 FY 2012 FY 2011 FY 2010 FY 2009 FY 2008 FY 2007 FY 2006 FY 2005 FY 2004 FY 2003 FY 2002 FY 2001
Revenue 1.202B 1.115B 802.554M 966.524M 14.699M 9.748M 15.769M 14.916M 813.574M 830.58M 942.018M 880.969M 735.135M 592.801M 458.935M 372.706M 281.091M 263.275M 220.748M 188.322M 148.525M 113.396M 84.927M 55.847M 32.336M
Net profit -305.142M 70.601M -83.477M 117.147M 183.158M 149.339M 86.158M 65.563M 162.265M 85.097M 167.926M 176.505M 175.314M 126.593M 100.791M 73.454M 44.306M 45.362M 48.241M 44.49M 36.772M 27.451M 20.714M 17.065M 5.626M
Free cash flow -90.362M -98.639M -100.422M 8.341M 73.713M 124.474M 115.355M 60.345M -21.997M 88.87M 172.211M 237.688M 209.252M 124.297M 163.391M 134.035M 80.764M 75.579M 71.694M 52.598M 54.37M 47.194M 32.627M 20.525M 5.217M

Figure FY 2025 FY 2024 FY 2023 FY 2022 FY 2021 FY 2020 FY 2019 FY 2018 FY 2017 FY 2016 FY 2015 FY 2014 FY 2013 FY 2012 FY 2011 FY 2010 FY 2009 FY 2008 FY 2007 FY 2006 FY 2005 FY 2004 FY 2003 FY 2002 FY 2001
Share price 17.69 20.89 26.2 33.78 50.21 39.66 36.3 24.37 33.2 39.1 34.69 57.93 56.64 106.25 67.47 77.02 49.03 43.8 39.7 46.67 45.86 — — — —
Price performance 12m -0.15 -0.2 -0.22 -0.33 0.27 0.09 0.49 -0.27 -0.15 0.13 -0.4 0.02 -0.47 0.57 -0.12 0.57 0.12 0.1 -0.15 0.02 — — — — —

Filed figures

Figure Dec 2016 Dec 2017 Dec 2018 Dec 2019 Dec 2020 Dec 2021 Dec 2022 Dec 2023 Dec 2024 Dec 2025
Balance sheet detail
Lease liabilities (USD) — — — 73.4M 57.3M 61.2M 59.4M 50.3M 36.4M 32.2M
Cash and deposits (USD) 94.3M 121M 98.7M 120M 109M 87.6M 83.4M 113M 106M 104M
Intangible assets (USD) 27.9M 23.6M 5.52M 4.5M — — — — — —
Right-of-use assets (USD) — — — 69M 53M 56.7M 54.5M 45.9M 32.2M 29.2M
Cash flow detail
Operating cash flow (USD) 103M 843,000 80.9M 133M 142M 84.9M 21.6M -97.5M -94.6M -85.5M
Purchases of property, plant and equipment (USD) -14.2M -22.8M -20.5M -18M -17.2M -11.2M -13.3M -2.89M -4.05M -4.82M
Change in payables (cash effect) (USD) -2.09M 2.74M 1.32M -2.07M 914,000 -1.32M 3.96M -1.21M 30.9M -3.38M
Share buybacks (cash effect) (USD) 0.00 -44.9M 0.00 0.00 0.00 -201M -111M 0.00 0.00 -20M
Interest paid (cash effect) (USD) -68M -79.8M -97.5M -119M -118M -112M -117M -138M -224M -259M
Income taxes paid (cash effect) (USD) -78.8M -144M -73.5M -69M -80.9M -77.8M -21.9M -25.5M -5.22M -38.5M
Share-based compensation (USD) 6.14M 8.68M 8.52M 10.7M 14.4M 15.9M 13M 11.1M 13.5M 15.9M
Free cash flow (OCF - PPE - intangibles) (USD) 88.9M -22M 60.3M 115M 124M 73.7M 8.34M -100M -98.6M -90.4M
Income detail
Total comprehensive income (USD) 76.3M 237M 12.2M 78.2M 168M 167M 45.9M -42.1M -39.7M -126M
Comprehensive income to owners (USD) 62M 236M 2.06M 67.2M 165M 162M 36.1M -65.5M -42.9M -149M
Reported Mar 1, 2017 Feb 28, 2018 Mar 12, 2019 Mar 2, 2020 Mar 1, 2022 Mar 1, 2022 Feb 28, 2023 Feb 29, 2024 Feb 27, 2025 Mar 2, 2026

Sign up to see institutional holdings

Sign Up

Podcast Mentions

Sign up to see podcast mentions and sentiment

Sign Up

PRA Group Reports Third Quarter 2026 Results Bull 3 Bear 0 Results

Continued Execution of PRA 3.0 Strategy Delivering Results and Building a Stronger Foundation for Long-Term Returns

$15M of Net Income Attributable to PRA Group, Inc.

NORFOLK, Va., November 5, 2026 - PRA Group, Inc. (Nasdaq: PRAA) (the "Company"), a global leader in acquiring and collecting nonperforming loans, today reported its financial results for the third quarter of 2026 ("Q3 2026").

Q3 2026 Highlights (vs. Q3 2025)

•Total cash collections of $536 million.

•Cash efficiency ratio1 of 63%. Adjusted cash efficiency ratio1 of 63%, an improvement of 200+ basis points, reflecting disciplined cost management.

•Portfolio income of $271 million, up 5%.

•Net income attributable to PRA Group, Inc. of $15 million, or diluted earnings per share of $0.39.

•Adjusted EBITDA2 for the twelve months ended September 30, 2026 of $1.4 billion, up 9%.

•Total portfolio purchases of $229 million, reflecting continued discipline in deploying capital toward opportunities meeting targeted return thresholds.

•Estimated remaining collections (ERC)3 of $8.8 billion, up 5%.

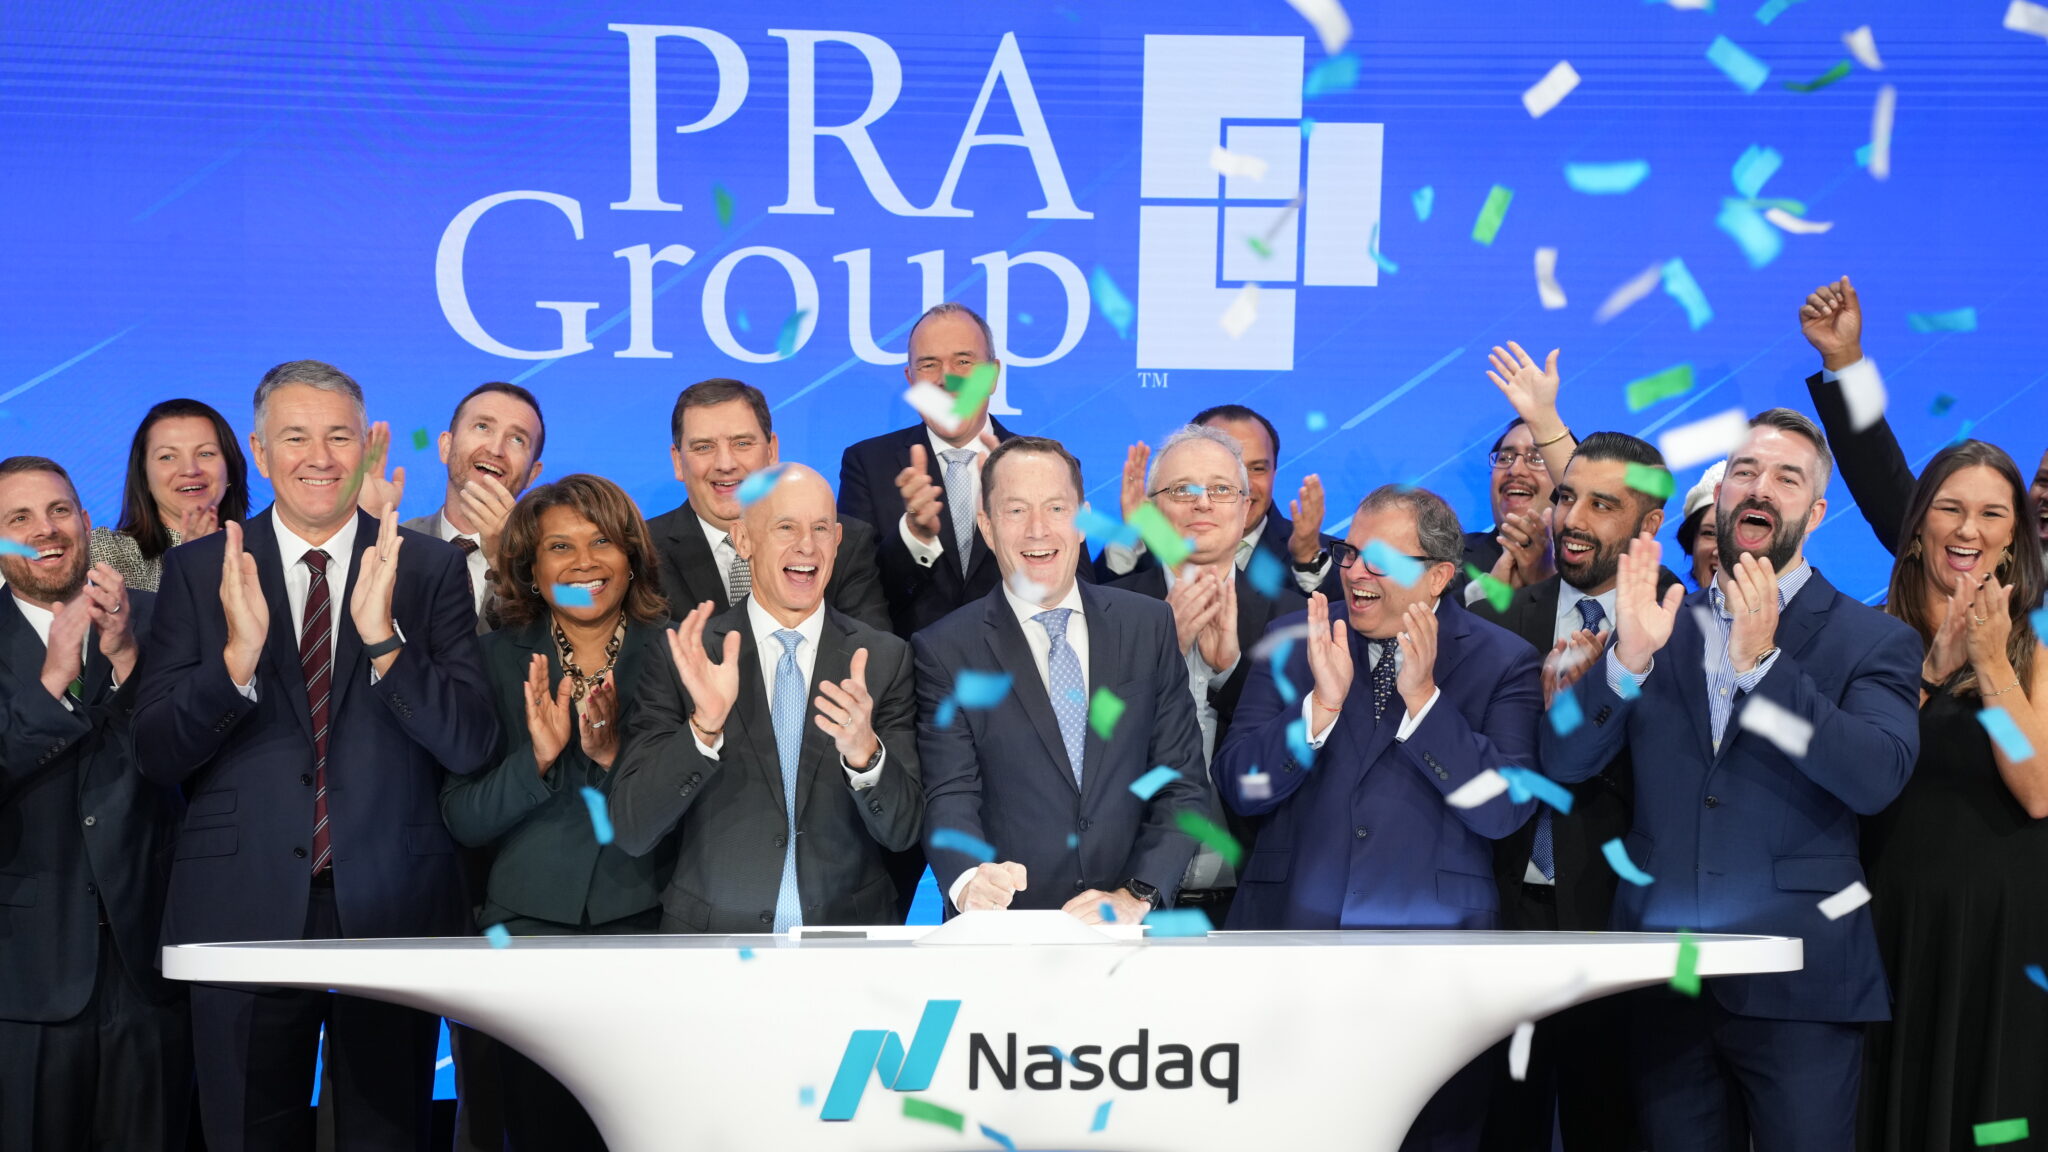
PRA Group Celebrates 30 Years of Business by Ringing Nasdaq Opening Bell

NORFOLK, Va., Nov. 2, 2026 – PRA Group, Inc. (Nasdaq: PRAA), a global leader in acquiring and collecting nonperforming loans, today celebrated its 30th anniversary by ringing the Nasdaq Stock Market Opening Bell in New York City’s Times Square. 

Photo credit: 2026 Nasdaq, Inc. / Vanja Savic

PRA Group President and Chief Executive Officer Martin Sjolund rang the bell alongside co-founder and Executive Chairman of the Board Steve Fredrickson, the company’s senior leadership team and employees representing PRA Group’s global workforce. 

“Celebrating 30 years of business is especially meaningful because this milestone belongs to the people who have helped make PRA Group what it is today,” said Sjolund. “Our people are the reason we’ve grown from a startup in Virginia into a global company, and they are the reason we’re excited about our next chapter.” 

Founded in Norfolk, Va., in 1996, PRA Group has grown into one of the most globally diversified companies in the nonperforming loan industry, with portfolio operations in 18 countries. The company has been publicly traded since 2002 and continues to play an important role in the financial ecosystem by returning capital to banks and other creditors while working directly with customers to help them resolve their debt. 

“As proud as we are of our first 30 years, we’re even more excited about what comes next,” Sjolund said. “Together, we’re advancing our new PRA 3.0 strategy introduced earlier this year, which is focused on helping us become a high-performing, technology-enabled global allocator of capital. I am proud of what our team has accomplished, and we look forward to continuing to deliver value to our customers, employees, partners and shareholders.” 


About PRA Group
As a global industry leader with more than 30 years of experience, PRA Group, Inc. (Nasdaq: PRAA) specializes in acquiring and collecting nonperforming loans. PRA Group purchases portfolios from banks and other creditors and, through its subsidiaries, collaborates with customers to help them resolve their debt. Headquartered in Norfolk, Virginia, PRA Group has operations in the U.S., Europe and other markets. For more information, please visit www.pragroup.com .

Media Contact:
Allison Herman
Manager, Public Relations and Strategic Communication
(757) 381-5205
[email protected]

**Investor Contact:
**Najim Mostamand, CFA
Vice President, Investor Relations
(757) 431-7913
[email protected]


Previous: « Shame and Stigma Keep People from Seeking Debt Advice, Research Finds

View All News & Stories

Post Categories:

PRA Group

Contact
PRA Group
Investors
Customers

Copyright 2026 PRA Group, Inc. All rights reserved.
Shame and Stigma Keep People from Seeking Debt Advice, Research Finds

43% of people struggling with debt wait more than a year before seeking advice, often reaching a crisis point before accessing support.

LONDON, 26 October 2026 – More than four in ten people struggling with debt wait over a year before seeking help, according to research from StepChange Debt Charity , the UK’s largest not for profit debt advice and solutions charity, supported by PRA Group, Inc. (Nasdaq: PRAA), a global leader in acquiring and collecting nonperforming loans.

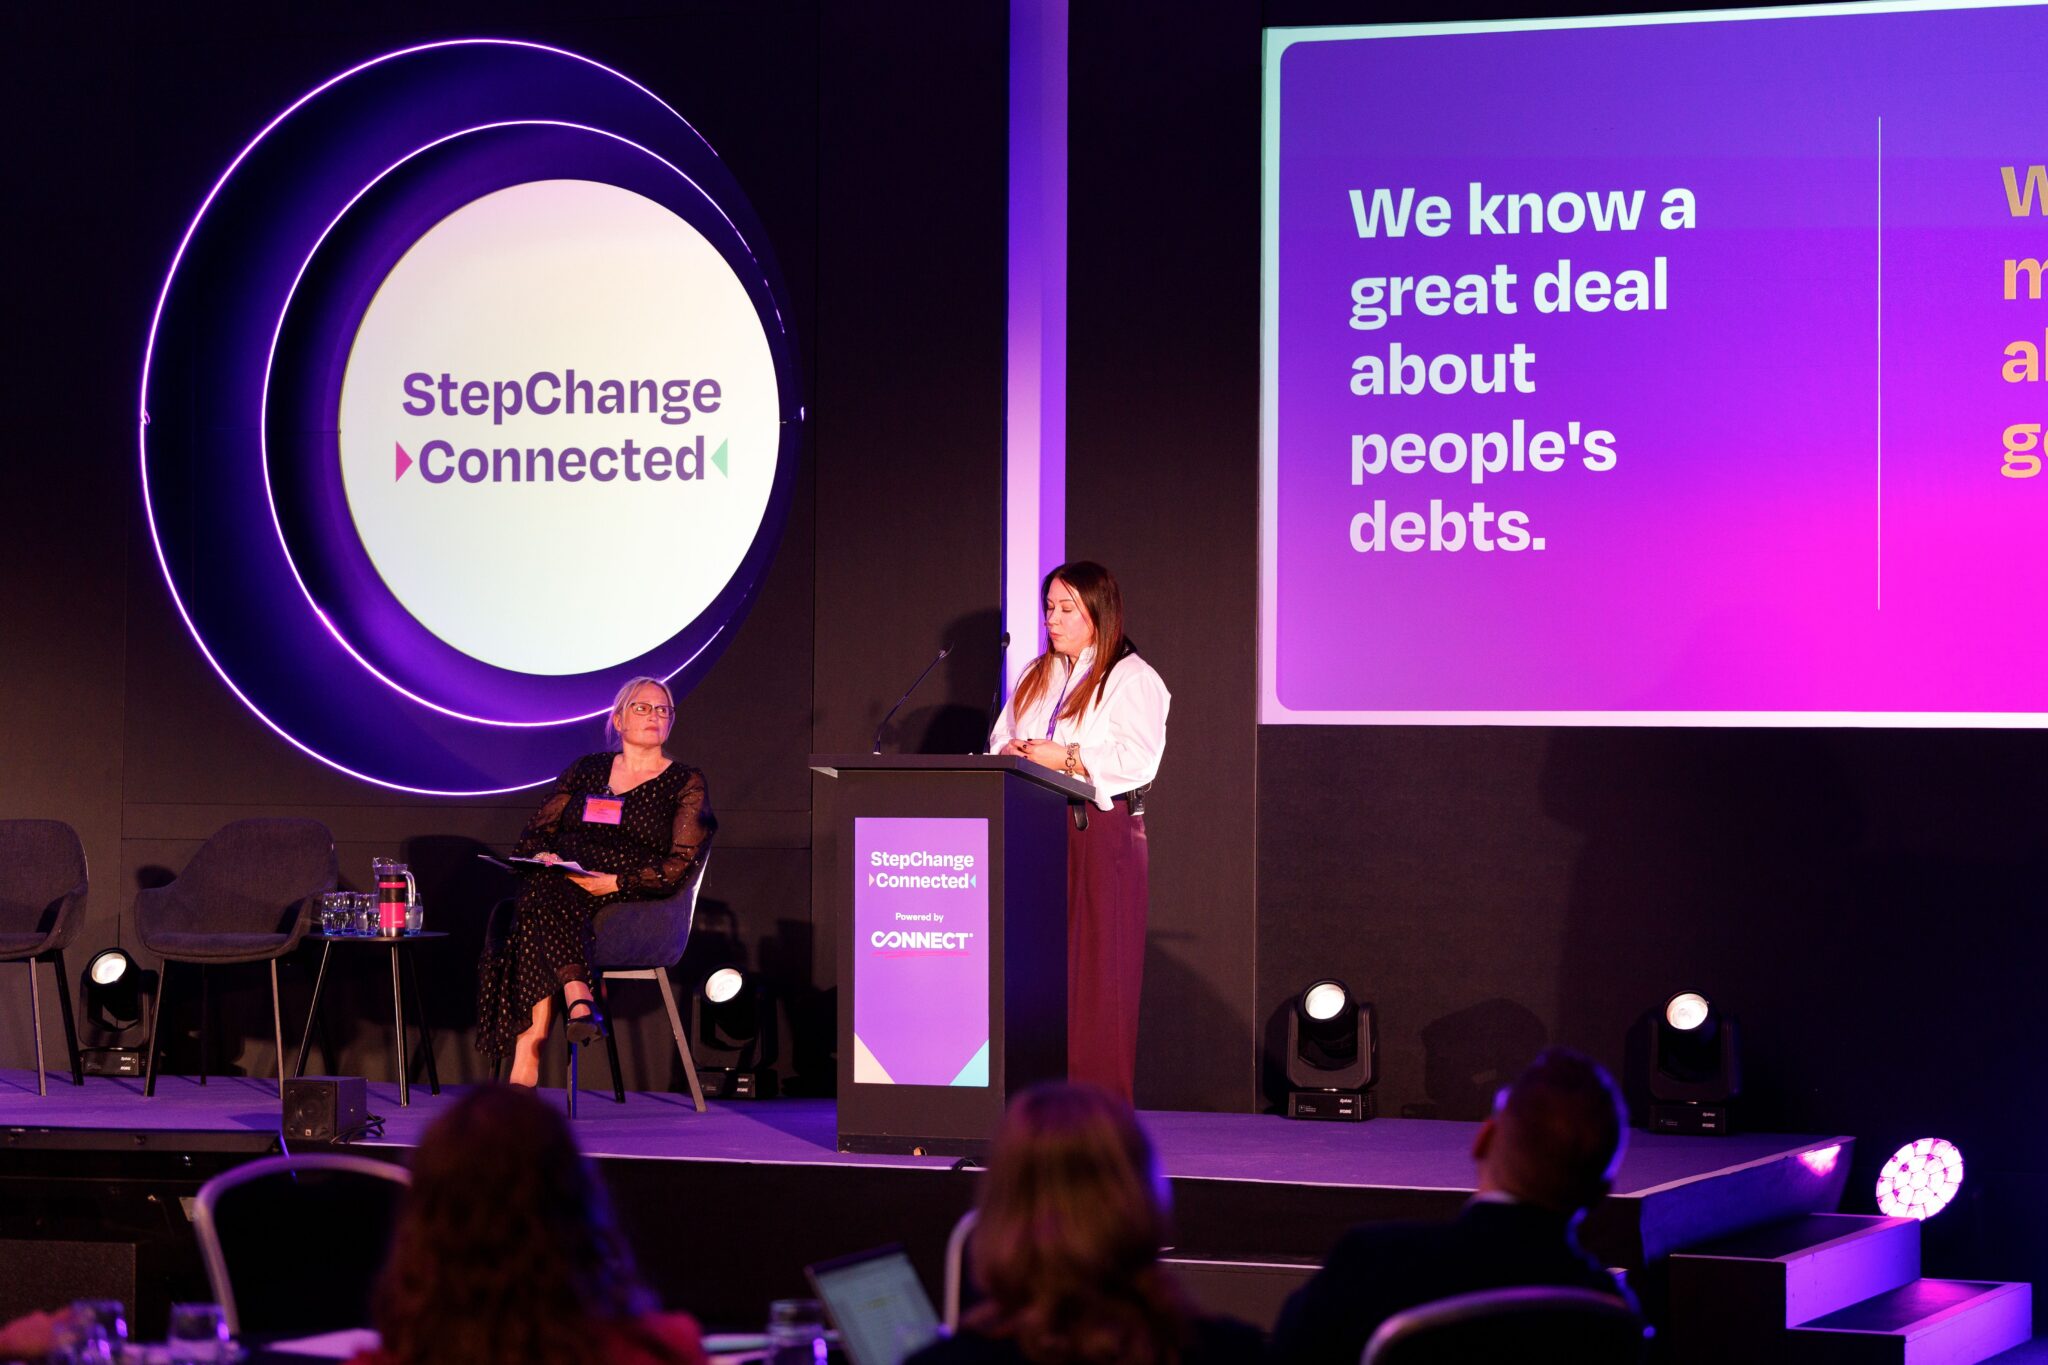
The study of more than 1,600 debt management plan clients, presented at the recent StepChange Connected Conference in Manchester, England, found that 43% worried about their finances for more than a year before seeking advice. Embarrassment was the most common reason for delaying support, with nearly one in five clients saying it prevented them from getting help. A further 10% feared being judged, while 10% were unaware debt help was available.

The research shows people often spend months or years juggling credit cards, overdrafts and borrowing from friends and family. Many reported using credit to repay credit while trying to maintain the appearance that everything was under control.

8 October 2026 StepChange Connected Conference in Manchester, England.

Participants reported concealing their difficulties from financial organisations, partners, friends and family. Interviewees often viewed debt advice as something for people with more serious problems than their own, even when facing clear signs of financial distress. As a result, many delayed seeking help until their circumstances had significantly worsened and they reached a crisis point.

The findings suggest that accessing support earlier can significantly improve outcomes. Many participants reported feeling immediate relief after seeking advice, indicating that access to impartial information, practical options and a clear plan helped them reduce uncertainty and move forward. Breaking down stigma and normalising conversations about debt could encourage more people to seek help sooner, potentially minimising financial hardship and improving long-term financial wellbeing.

Additional cost-of-living research undertaken by PRA Group revealed similar patterns. Just 35% of PRA Group customers surveyed in the UK had contacted support organisations in the previous six months, while 60% had borrowed money over the same period, highlighting a reluctance to seek assistance despite growing financial strain.

PRA Group UK Country Operations Director Tim Kirk said, “Behind these findings are people who have been carrying the worry of debt on their own, sometimes for a long time. We want people to know that they will be listened to, not judged. Staying silent can allow problems to grow, while misleading information online can make an already difficult situation feel even more confusing. A conversation with a trusted partner is the first step towards finding a way forward.”

CEO of StepChange Debt Charity Vikki Brownridge said, “Too many people continue to struggle in silence because they feel ashamed about their situation. The findings show the importance of debt advice that is visible, accessible, free and non-judgmental so people can seek support before financial difficulties worsen. Earlier engagement helps people regain control and build a more secure future.”


About PRA Group

As a global industry leader with more than 30 years of experience, PRA Group, Inc. (Nasdaq: PRAA) specializes in acquiring and collecting nonperforming loans. PRA Group purchases portfolios from banks and other creditors and, through its subsidiaries, collaborates with customers to help them resolve their debt. Headquartered in Norfolk, Virginia, PRA Group has operations in the U.S., Europe and other markets. For more information, please visit www.pragroup.com .

About StepChange

StepChange Debt Charity is the UK’s largest not for profit debt advice and solutions charity, helping hundreds of thousands of people every year to deal with their debts. Founded in 1993, StepChange supports people experiencing debt problems through telephone and online services, and campaigns for change to reduce the harm and stigma associated with debt.

Media Contact

StepChange Debt Charity

[email protected]

| +44 2073 914598

PRA Group, Inc.

[email protected]

| +1 (757) 381-5205


Previous: « Unexpected Costs Leave Many Households Vulnerable, New Research Finds

View All News & Stories

Post Categories:

PRA Group

Contact
PRA Group
Investors
Customers

Copyright 2026 PRA Group, Inc. All rights reserved.
Prompts

PRA Group, Inc. (ticker PRAA), listed in United States.

Company History

Date Change Detail
Sep 15, 2014 Renamed PORTFOLIO RECOVERY ASSOCIATES INC → PRA GROUP INC

ETFs Holding PRA Group, Inc.

ETF Weight in ETF Shares Market value As of
FSEV 0.15% 510 $ 9,684.90 Jun 30, 2026
VFVA 0.11% 54,294 $ 1.022M Aug 31, 2026
AVUV 0.05% 1,294,434 $ 14.795M Nov 16, 2026
RESM 0.04% 68 $ 1,291.32 Jun 30, 2026
AVSC 0.03% 77,029 $ 880.441K Nov 16, 2026
DFSV 0.02% 397,588 $ 4.723M Nov 12, 2026
DFAS 0.01% 300,198 $ 3.566M Nov 12, 2026
DXUV 0.01% 27,667 $ 328.684K Nov 12, 2026
DFAC 0.00% 154,568 $ 1.836M Nov 12, 2026
DFAT 0.00% 50,583 $ 600.926K Nov 12, 2026
DFSU 0.00% 2,600 $ 30.888K Nov 12, 2026
DCOR 0.00% 45,258 $ 537.665K Nov 12, 2026
DFAU 0.00% 10,115 $ 120.166K Nov 12, 2026
DFUS 0.00% 13,080 $ 155.39K Nov 12, 2026
AVUS 0.00% 34,539 $ 394.781K Nov 16, 2026
AVSU 0.00% 889 $ 10.161K Nov 16, 2026