October 15, 2026 Company remains on track with 2026 revenue growth guidance, supported by continued margin improvement and a record low net cash usage of approximately $28M Third quarter earnings call scheduled for November 9, 2026 Plug Symposium…
October 15, 2026
- Company remains on track with 2026 revenue growth guidance, supported by continued margin improvement and a record low net cash usage of approximately $28M
- Third quarter earnings call scheduled for November 9, 2026
- Plug Symposium 2026: Resilient Energy, Real Solutions scheduled to take place digitally on November 19, 2026
SLINGERLANDS, N.Y., Oct. 15, 2026 (GLOBE NEWSWIRE) -- Plug Power Inc. (NASDAQ: PLUG), a global leader in comprehensive hydrogen solutions for the hydrogen economy, is providing an update today on its 2026 business progress, highlighting improvements across three key business priorities: sales growth, margin enhancement, and improved cash flows. The Company is also sharing details for its upcoming third quarter earnings call scheduled for November 9 and Plug Symposium 2026 scheduled for November 19.
"Throughout 2026, we have remained focused on strengthening Plug's financial foundation through disciplined execution," said Jose Luis Crespo, Chief Executive Officer of Plug. "Our progress across sales, margin and cash burn demonstrates that the actions we are taking are delivering results. As we move through the fourth quarter, we remain focused on improving operating leverage, managing cash and delivering on our commercial commitments while building our pipeline for 2027 and beyond."
2026 Business Progress and Priorities
Plug continues to execute against its three key business objectives, with progress through the third quarter and continued focus on year-end performance:
- Sales: Based on preliminary, unaudited estimates, Plug expects meaningful revenue growth in Q3 2026 of greater than 10% versus Q3 2025. Progress on sales and pipeline growth suggest the Company is on track to achieve its previously communicated full-year revenue growth guidance of approximately 15% to 16%, supported by commercial execution across material handling, electrolyzers and hydrogen supply.
- Margin: The Company has demonstrated gross margin improvement over the past two quarters and expects continued year-over-year progress in Q3 2026, reflecting the focus on cost reductions and improved operating leverage.
- Cash: Based on preliminary, unaudited estimates, Plug’s net cash usage for Q3 2026 was approximately $28 million, marking continued improvement for the year. Plug ended Q3 2026 with approximately $134 million in cash and cash equivalents (excluding restricted cash). The Company did not raise any proceeds through its at-the-market (ATM) offering program or generate proceeds from other equity or debt capital raises during the quarter. Hence, this net cash usage for the third quarter reflects overall operating results and fundamental improvement, which the Company believes supports its forecast for continued improvement in Q4 2026.
Looking ahead, Plug remains focused on sustaining progress across all three objectives in the fourth quarter and going forward, with an emphasis on disciplined cash management, minimizing capital expenditures, and strengthening its operating performance.
Pipeline Developments
Plug continues to advance its global GenEco electrolyzer pipeline, converting commercial opportunities into projects across sustainable fuels, ammonia production and industrial hydrogen applications.
Recent developments include:
- Arcadia eFuels: Signed a 280 MW GenEco electrolyzer supply agreement for Project ENDOR in Denmark, alongside a strategic cooperation agreement positioning Plug as the preferred supplier for more than 1 GW of potential e-SAF projects across Europe and the Americas.
- Hy2gen: Advancing front-end engineering design (FEED) for the 275 MW Courant project in Québec, Canada, supporting renewable ammonia and ammonium nitrate production.
- Orica: Secured a 50 MW GenEco electrolyzer order for the Hunter Valley Hydrogen Hub in Australia, following the project's final investment decision (FID).
- Iberdrola and Galp: Continuing execution and commissioning activities for the 25 MW Iberdrola and bp project in Spain and the 100 MW Galp project in Portugal.
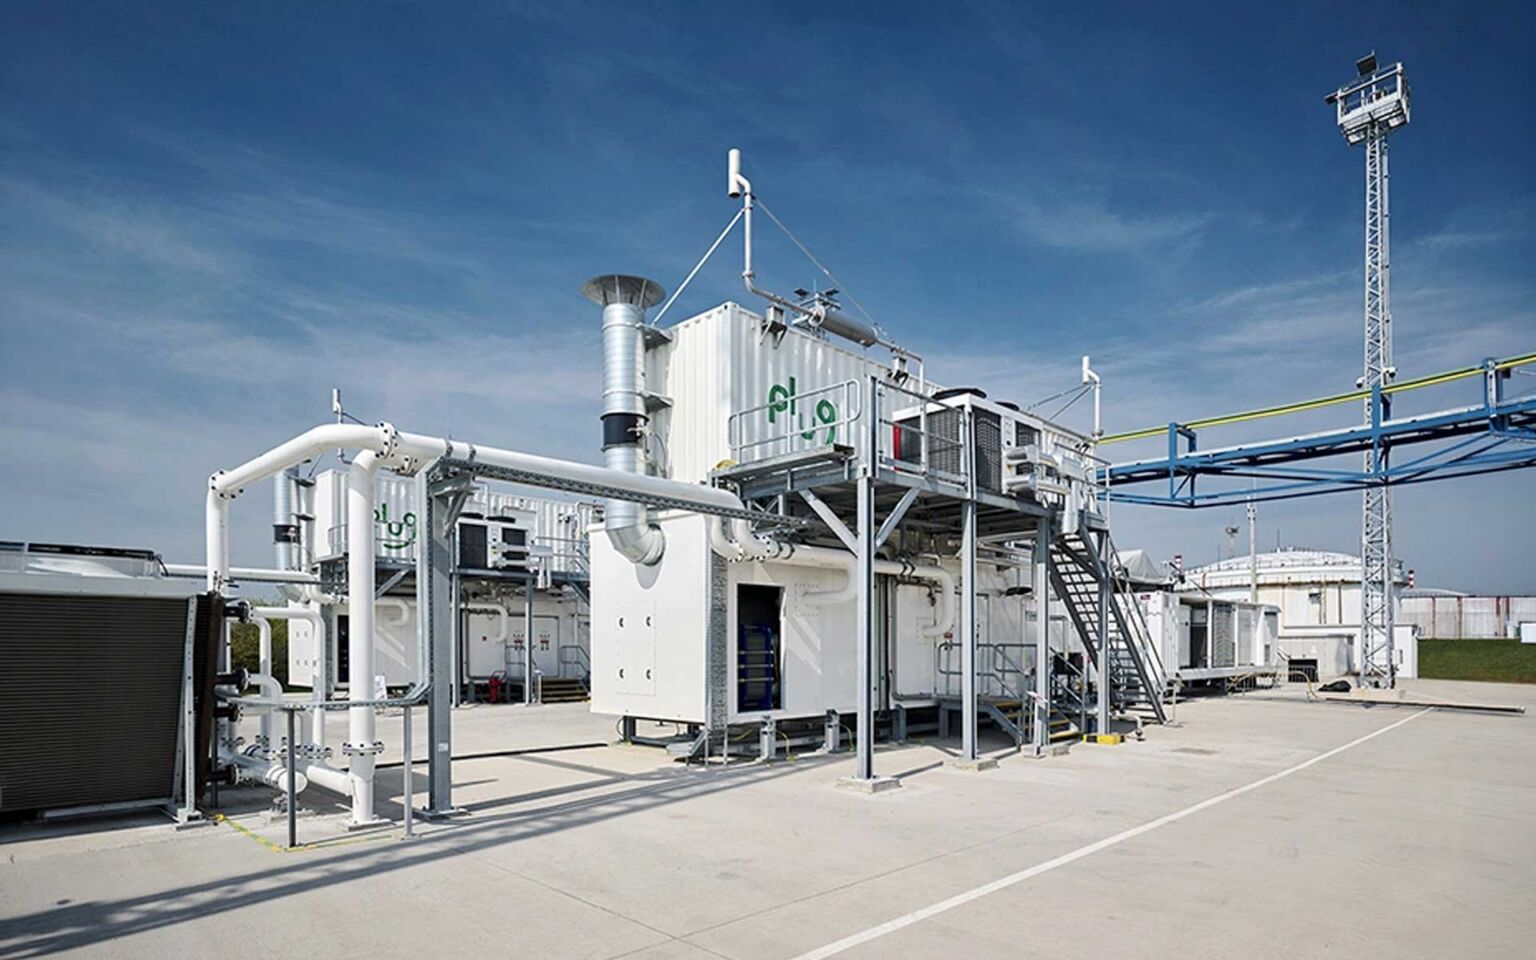
These developments reinforce Plug's approximately $8 billion global electrolyzer opportunity funnel and demonstrate continued commercial progress across multiple markets. While project timelines vary, particularly for complex, first-of-a-kind developments, Plug remains focused on advancing opportunities through key milestones and converting its pipeline into revenue, supporting its near- and mid-term growth objectives.
Plug's Third Quarter 2026 Earnings Call
Plug will announce its third quarter 2026 financial results on November 9, 2026, followed by a conference call and webcast.
Plug Symposium 2026: Resilient Energy, Real Solutions
Plug will host its annual global Symposium on November 19, 2026. The virtual broadcast will bring together customers, industry leaders and Plug executives to explore how hydrogen is addressing evolving energy needs and advancing real-world projects.
Under the theme Resilient Energy, Real Solutions, discussions will focus on energy security, rising electricity demand, grid resilience, evolving regulations and emerging hydrogen markets. The program will also feature customer perspectives on project execution and insights from Plug leadership on business priorities and technology.
"Hydrogen's role in the global energy landscape is increasingly defined by real projects and customer needs," added Crespo. "Our Symposium will bring together industry perspectives and practical solutions that can help build a more resilient energy future."
Register for Plug Symposium 2026:
About Plug Power
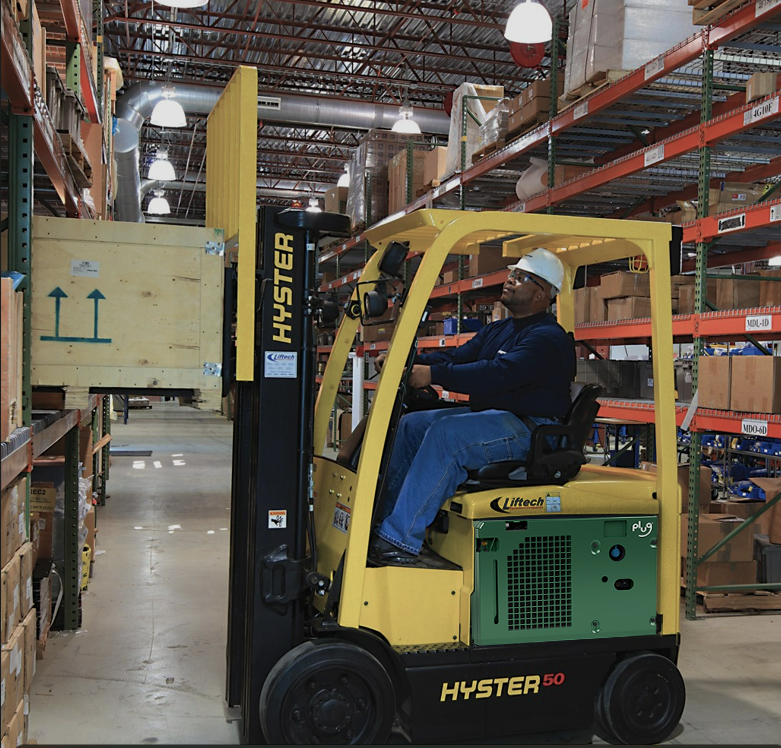
Plug is building the global hydrogen economy with a fully integrated ecosystem spanning production, storage, delivery, and power generation. A first mover in the industry, Plug provides electrolyzers, liquid hydrogen, fuel cell systems, storage tanks, and fueling infrastructure to customers worldwide across material handling, industrial applications, and energy production, advancing energy independence and decarbonization at scale.
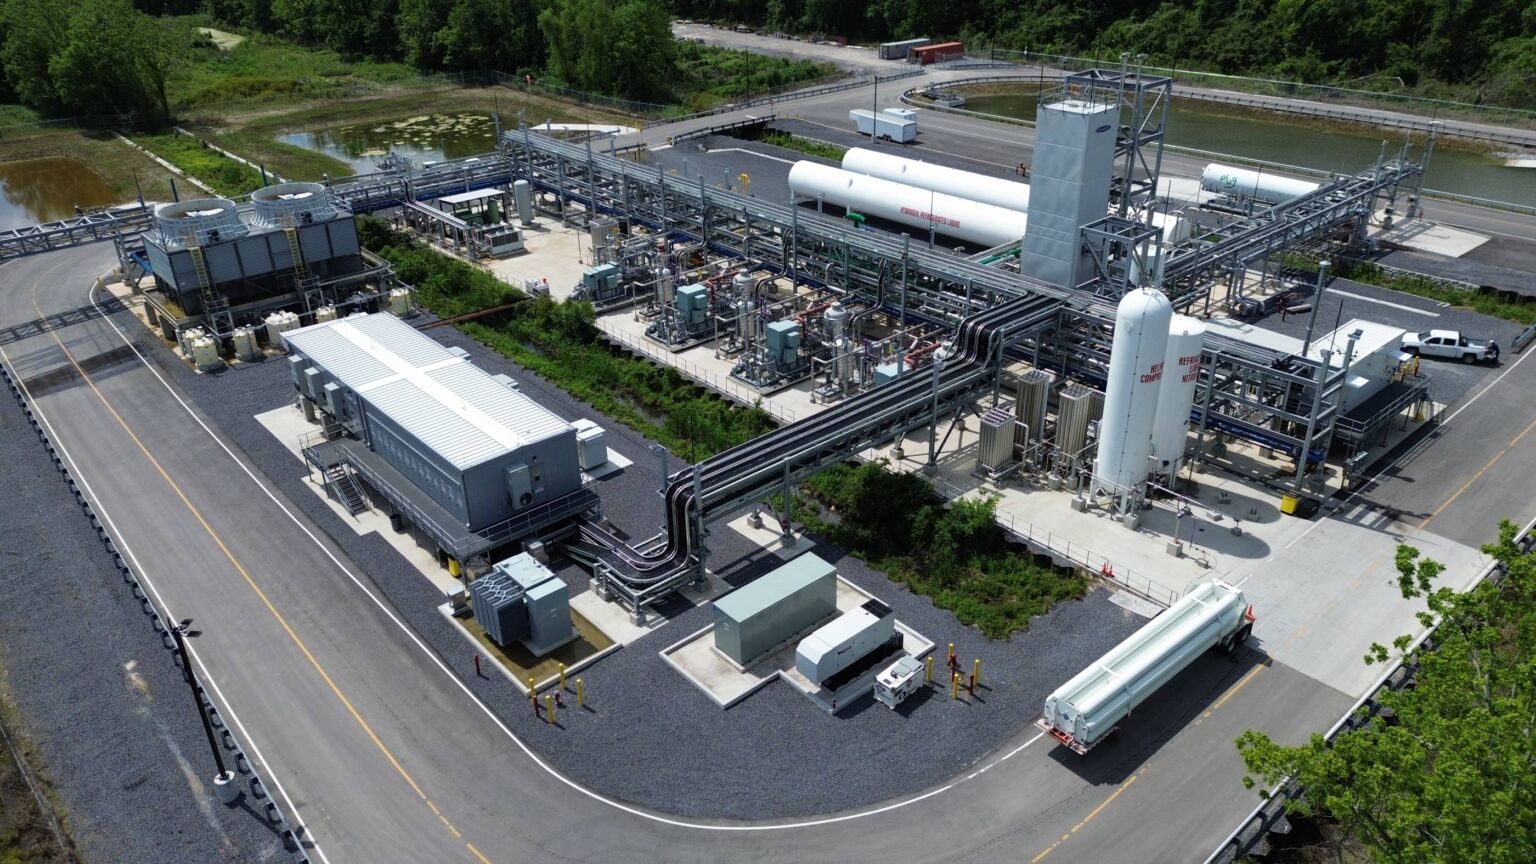
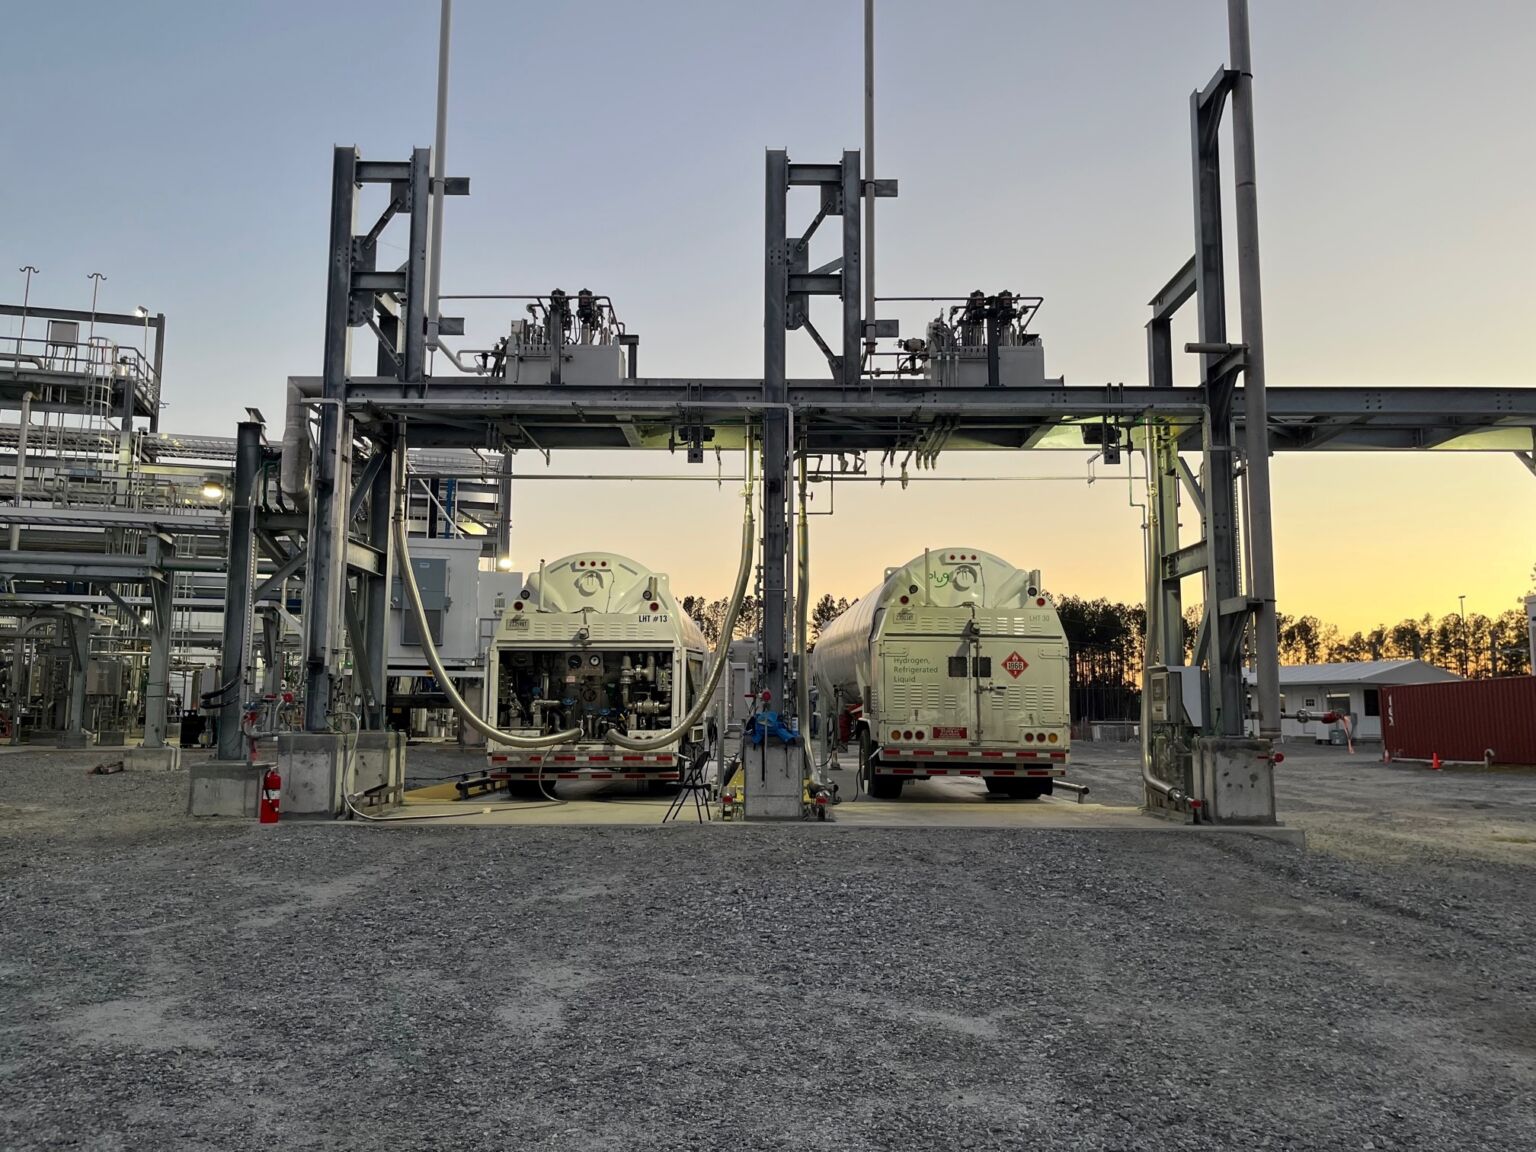
Plug has deployed electrolyzers on five continents, along with more than 76,000 fuel cell systems and 280 fueling stations, and is the world's largest user of liquid hydrogen. Its expanding generation network has production capacity of 40 tons of hydrogen per day, supplying large-scale projects that redefine industrial power for customers globally.
Headquartered in New York, with employees and state-of-the-art manufacturing facilities around the world, Plug powers global leaders like BMW, BP, Walmart, Amazon, and Home Depot. For more information, visit www.plugpower.com
.
Forward-Looking Statements
This communication contains “forward-looking statements” within the meaning of the safe harbor provisions of the Private Securities Litigation Reform Act of 1995. All statements in this press release that are not historical facts, including, without limitation, statements regarding Plug's expected financial and operational performance; the preliminary estimates of the Company's third quarter 2026 results; anticipated revenue growth; expected improvements in gross margin, operating leverage, operating efficiencies, and cost reductions; anticipated cash burn, liquidity, capital expenditures, and cash management initiatives; the Company's ability to execute on its commercial objectives and customer commitments; expected demand for Plug's products and services across material handling, electrolyzers, hydrogen production, and hydrogen supply; expectations regarding future hydrogen production capacity and utilization; anticipated benefits from strategic initiatives and operational improvements; expected business performance during the fourth quarter and full year 2026; anticipated market opportunities, industry growth, and adoption of hydrogen technologies; the Company's electrolyzer opportunity funnel and the expected development, financing, timing, and conversion of potential projects and customer agreements into orders and revenue; expectations and statements regarding Plug Symposium 2026 and related discussions concerning energy security, grid resilience, regulatory developments, hydrogen markets, and customer projects; and other statements regarding Plug's future operating results, financial condition, business strategy, performance, prospects, objectives, plans, and opportunities, are forward-looking statements.
These forward-looking statements are based on current expectations, estimates, forecasts, and projections, as well as the beliefs and assumptions of management, and are subject to a number of risks and uncertainties that could cause actual results to differ materially from those expressed or implied in such statements. These risks and uncertainties include, among other things: whether the Company achieves its anticipated revenue growth, margin improvement, operating leverage, profitability, liquidity, and cash flow objectives; whether the Company is able to sustain recent reductions in cash burn; the Company's ability to manage working capital, operating expenses, and capital expenditures; whether anticipated customer demand, project activity, bookings, and commercial opportunities materialize as expected; whether awarded projects and opportunities successfully progress to implementation, revenue generation, and commercial operation; the Company's ability to manufacture, deliver, deploy, and service its products in accordance with customer requirements and anticipated schedules; the availability and price of hydrogen, electricity, natural gas, and other key inputs; the pace of market adoption of hydrogen technologies; changes in government policies, regulations, incentives, and funding programs; supply chain disruptions, inflationary pressures, labor availability, and project execution risks; risks related to the Company's future capital requirements and liquidity needs; the Company's ability to obtain financing when needed and on acceptable terms; the possibility that the Company's actual third quarter 2026 results will differ from the preliminary estimates in this press release as a result of the completion of quarter-end close procedures, review by the Company's independent registered public accounting firm, final adjustments, or subsequent events; the Company's history of net losses and negative cash flows from operations, its need for additional capital, and the dilution or other terms that may accompany any future financing; the timing of customer collections, vendor payments, inventory purchases, and capital expenditures, which can cause net cash usage to fluctuate significantly from period to period; the timing of revenue recognition, customer acceptance, and contract modifications; the possibility that gross margin improvements are not sustained and are affected by product and project mix, inventory and other charges, warranty and service costs, and other non-recurring items; customer concentration and counterparty credit risk; delays or cancellations of customer projects, including as a result of customers' failure to reach final investment decisions or secure financing or permits; the performance, commissioning, and acceptance of the Company's products and projects; tariffs and trade restrictions; and general market, economic, competitive, geopolitical, and regulatory conditions.
Such statements are subject to risks and uncertainties that could cause actual performance or results to differ materially from those expressed in these forward-looking statements. For a further description of the risks and uncertainties that could cause actual results to differ from those expressed in these forward-looking statements, as well as risks relating to Plug's business generally, see Plug's public filings with the Securities and Exchange Commission ("SEC"), including the "Risk Factors" section of Plug's Annual Report on Form 10-K for the year ended December 31, 2025, and Plug's subsequent Quarterly Reports on Form 10-Q and other filings with the SEC. Readers are cautioned not to place undue reliance on these forward-looking statements or the preliminary estimates in this press release, which speak only as of the date of this press release. The Company undertakes no obligation to update or revise any forward-looking statements, whether as a result of new information, future events, or otherwise, except as required by law.
PLUG MEDIA CONTACT
Teal Hoyos
[email protected]
Source: Plug Power, Inc.
View All News
Keep up-to-date on the latest news and analysis
To opt-in for investor email alerts, please enter your email address in the field below and select at least one alert option. After submitting your request, you will receive an activation email to the requested email address. You must click the activation link in order to complete your subscription. You can sign up for additional alert options at any time.
At Plug Power Inc., we promise to treat your data with respect and will not share your information with any third party. You can unsubscribe to any of the investor alerts you are subscribed to by visiting the ‘unsubscribe’ section below. If you experience any issues with this process, please contact us for further assistance.
By providing your email address below, you are providing consent to Plug Power Inc. to send you the requested Investor Email Alert updates.
* Required
Email Address *
Investor Alert OptionsInvestor Alert Options *
|
| Press Releases |
| End of Day Stock Quote |
Submit Submit
Unsubscribe
Email Alert Sign Up Confirmation
Follow Us
Copyright 2026© Plug Power Inc.