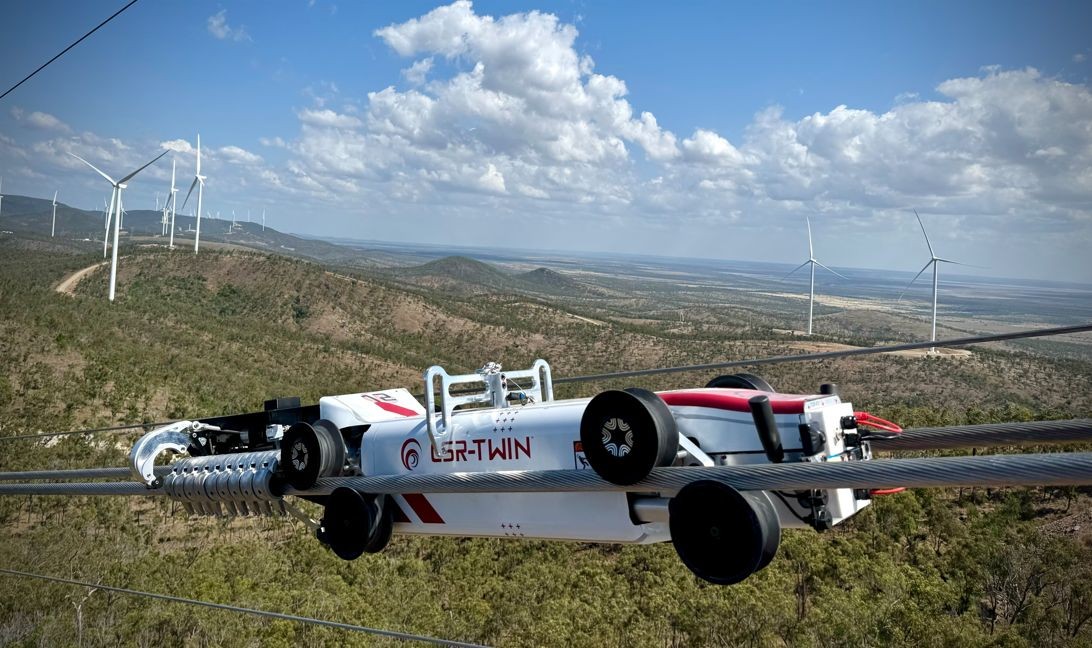
Preformed Line Products Company is an international designer and manufacturer of products and systems for the construction and maintenance of overhead, ground-mounted, and underground networks in the energy, telecommunication, cable, and data communication industries. The company's primary products support, protect, connect, terminate, and secure cables and wires. Its business segments include Energy Products, which comprise formed wire solutions, connectors, OPGW and ADSS fiber optic cables, string hardware, polymer insulators, and substation fittings; Communications Products, featuring outside plant closures for FTTx and 4G/5G applications, demarcation products, and utility pole line hardware; and Special Industries Products, which include solar framing hardware, electric vehicle charging station foundations, and drone inspection services for utility assets. The company serves a worldwide market through domestic and international manufacturing facilities, catering to public and private energy utilities, communication companies, cable operators, governmental agencies, contractors, and distributors. Founded in 1947, the company holds numerous patents and maintains a Research and Engineering Center for product development and testing.

Summarised from the company's own disclosures, fiscal year ended Mar 2026

Industry Building Products & Equipment Homepage plp.com
Sector Industrials IR page plp.com/investor-relations
Tags
power line hardware, fiber optic closures, solar mounting, ev charging infrastructure, formed wire, substation fittings, drone inspection, telecom infrastructure, PREFORMED Armor Rod, GUY-GRIP Dead-Ends, ARMOR-GRIP Suspensions, OPGW, ADSS, SERVISEAL, Stainless Steel Splice Case, Inspection Services
Press page —

Metrics

Valuation  
Market cap $ 1.987B
Market cap (USD) $ 1.987B
P/E 34.19
PEG —
P/BV 3.88
P/S 2.58
P/OCF 22.07
P/FCF 54.85
Dividend yield 0.21%
Turnover / mcap —
Returns  
ROE 7.9%
ROI 6.9%
ROIC 8.3%
Profit margin 5.3%
Growth  
Revenue growing No
Profits growing No
Revenue up 3y No
Revenue up 5y No
Earnings growth 3y (net profit CAGR) -13.4%
Quality  
Profitable Yes
Margin expanding No
Buying back stock No
Diluting (TTM) No
Debt/Equity 10.4%
Podcast bulls (TTM) Sign up
Podcast bears (TTM) Sign up
Podcast sentiment (TTM) Sign up
Podcast sentiment % (TTM) Sign up
News sentiment (TTM) 23
Quality score -33.3%
Insiders  
Buys, 1w Sign up
Buys, 1m Sign up
Buys, 1y Sign up
Sells, 1w Sign up
Sells, 1m Sign up
Sells, 1y Sign up

Sign up to see this company's insider trades

Figure FY 2025 FY 2024 FY 2023 FY 2022 FY 2021 FY 2020 FY 2019 FY 2018 FY 2017 FY 2016 FY 2015 FY 2014 FY 2013 FY 2012 FY 2011 FY 2010 FY 2009 FY 2008 FY 2007 FY 2006 FY 2005 FY 2004 FY 2003 FY 2002 FY 2001 FY 2000
Revenue 669.338M 593.714M 669.679M 637.021M 517.417M 466.449M 444.861M 420.878M 378.212M 336.634M 354.666M 388.185M 409.776M 439.192M 424.404M 338.305M 257.206M 269.742M 254.607M 216.937M 205.804M 183.112M 153.333M 169.842M 196.365M 207.332M
Net profit 35.283M 37.094M 63.332M 54.395M 35.729M 29.803M 23.303M 26.581M 12.654M 15.255M 6.675M 12.861M 20.587M 29.286M 30.984M 23.113M 23.357M 17.623M 14.159M 12.06M 11.986M 13.037M 4.383M -1.14M 5.176M 11.051M
Free cash flow 33.335M 52.829M 72.31M -14.445M 15.214M 17.073M -2.25M 13.448M 22.597M 1.249M 9.475M 7.593M -2.811M 29.342M -1.863M 16.414M 18.348M 7.3M 5.031M 4.559M 13.828M 6.682M 16.714M 13.875M 10.984M 9.116M

Figure FY 2025 FY 2024 FY 2023 FY 2022 FY 2021 FY 2020 FY 2019 FY 2018 FY 2017 FY 2016 FY 2015 FY 2014 FY 2013 FY 2012 FY 2011 FY 2010 FY 2009 FY 2008 FY 2007 FY 2006 FY 2005 FY 2004 FY 2003 FY 2002 FY 2001 FY 2000
Share price 206.71 127.79 133.86 83.29 64.7 68.44 60.35 54.25 71.05 58.12 42.1 54.63 73.16 59.42 63.72 49.16 42.11 29.73 46.5 31.48 — — — — — —
Price performance 12m 0.62 -0.05 0.61 0.29 -0.05 0.13 0.11 -0.24 0.22 0.38 -0.23 -0.25 0.23 -0.07 0.3 0.17 0.42 -0.36 0.48 — — — — — — —

Filed figures

Figure Dec 2016 Dec 2017 Dec 2018 Dec 2019 Dec 2020 Dec 2021 Dec 2022 Dec 2023 Dec 2024 Dec 2025
Balance sheet detail
Trade receivables (USD) 63.4M 74M 73.1M 83.5M 92.7M 98.2M 125M 107M 111M 113M
↳ YoY growth -0.3% +16.6% -1.1% +14.2% +11.0% +6.0% +27.6% -14.7% +4.2% +1.6%
↳ 5y CAGR -1.7% +3.7% +1.6% +4.2% +7.8% +9.1% +11.1% +7.9% +5.9% +4.1%
Borrowings, current (USD) 4.21M 3.76M 11.9M 15.4M 27.9M 22.7M 24.1M 19.9M 12.6M 12M
Borrowings, non-current (USD) 42.9M 34.6M 25M 53.7M 33.3M 40M 68.4M 48.8M 18.4M 32.9M
Lease liabilities (USD) — — 0.00 10.3M 11M 10.1M 8.63M 9.56M 8.13M 7.68M
Cash and deposits (USD) 30.7M 44.4M 43.6M 38.9M 45.2M 36.4M 37.2M 53.6M 57.2M 83.4M
Intangible assets (USD) 10.5M 10M 8.46M 15.1M 14.4M — — — — —
Right-of-use assets (USD) — — 0.00 12.5M 13.1M 12.4M 10.8M 11.7M 10.1M 9.71M
Net debt (borrowings + leases - cash) (USD) 16.4M -6M -6.71M 40.5M 27M 36.4M 63.9M 24.7M -18.1M -30.9M
Cash flow detail
Operating cash flow (USD) 26M 33.8M 23M 27.2M 41.6M 33.6M 26.2M 108M 67.5M 73.5M
Purchases of property, plant and equipment (USD) -24.7M -11.2M -9.53M -29.5M -24.6M -18.4M -40.6M -35.3M -14.7M -40.1M
Change in receivables (cash effect) (USD) -2.29M -9.21M -4.5M -9.78M -10.5M -11.6M -28M 17M -8.71M 6.99M
Change in inventories (cash effect) (USD) -6.35M -2.21M -13.7M -9.46M 80,000 -24.2M -37M -4.95M 6.78M -11.9M
Change in payables (cash effect) (USD) 3.28M 4.73M 3.05M 6.09M 6.95M 11.6M 6.71M 2.3M 8.6M 10,000
Dividends paid (cash effect) (USD) -4.17M -4.1M -4.09M -4.23M -4.18M -4.13M -4.1M -4.11M -4.08M -4.12M
Share buybacks (cash effect) (USD) -3.11M -2,000 -191,000 -2.8M -5.84M -177,000 -158,000 -728,000 -226,000 -1.05M
Interest paid (cash effect) (USD) -700,000 -1M -1.8M -2M -1.9M -1.6M -3.1M -3.8M — —
Income taxes paid (cash effect) (USD) -6.9M -3.4M -5.6M -7.8M -7.7M -16.9M -14.6M -21.9M -13.1M -11.4M
Share-based compensation (USD) 1.37M 3.06M 4.24M 4.4M 4.09M 4.16M 4.6M 4.95M 3.41M 4.96M
Operating cash flow before change in receivables (USD) 28.3M 43M 27.5M 37M 52.2M 45.2M 54.2M 90.7M 76.2M 66.5M
Free cash flow (OCF - PPE - intangibles) (USD) 1.25M 22.6M 13.4M -2.25M 17.1M 15.2M -14.4M 72.3M 52.8M 33.3M
Income detail
Research and development expense (USD) 2.7M 2.1M 2.4M 3M 2.8M 3.3M 4.5M 5.2M — —
↳ 5y CAGR -27.4% 0% +0.9% +2.1% -0.7% +4.1% +16.5% +16.7%
Total comprehensive income (USD) 12M 22.6M 14.4M 25.6M 32.6M 28.6M 46.1M 73M 14.5M 64.9M
Comprehensive income to owners (USD) 12M 22.6M 14.4M 25.5M 32.6M 28.6M 46.1M 73M 14.5M 64.8M
Provision for credit losses (USD) — — — 1.29M 1.28M 931,000 2.11M 3.25M -875,000 -119,000
Credit cost ratio (credit losses / average receivables) (%) — — — 1.7% 1.5% 1.0% 1.9% 2.8% 0.8% 0.1%
Reported Mar 10, 2017 Mar 9, 2018 May 3, 2019 Mar 4, 2022 Mar 4, 2022 Mar 4, 2022 Mar 13, 2025 Mar 13, 2025 Mar 13, 2025 Mar 5, 2026

Sign up to see institutional holdings

Sign Up

Podcast Mentions

Sign up to see podcast mentions and sentiment

Sign Up

On October 28, 2026, Glenn E. Corlett notified the Board of Directors (the “Board”) of Preformed Line Products Company (the “Company”) that he was retiring from the Board effective as of such date. Mr. Corlett had served as a director since 2004 and served as the Chairman of the Compensation Committee and as a member of the Audit Committee. The Company and the Board greatly appreciate Mr. Corlett’s significant contributions over the last 22 years.

Due to the vacancy created by Mr. Corlett’s retirement, the Board reduced the size of the Board to seven directors. The Board also appointed R. Steven Kestner, a current member of the Board, to serve on the Audit Committee.

CLEVELAND, OHIO – October 28, 2026 - Preformed Line Products Company (NASDAQ: PLPC) today reported financial results for its third-quarter of 2026.

Q3 2026 highlights:

•Quarterly net sales of $209.5 million, an increase of 18% from Q3 2025.

•Quarterly gross profit margin of 33.4%, up 370 basis points from Q3 2025.

•Quarterly diluted EPS of $3.56 per share, up $3.03 from Q3 2025. EPS was up 70% from Q3 2025 when adjusted for the charges related to the U.S. Pension Plan termination that occurred in Q3 2025.

•Quarterly Cash Flow from Operations up 95% from Q3 2025 and 32% for the nine-month period ended September 30, 2026.

Net sales in the third quarter of 2026 were $209.5 million compared to $178.1 million in the third quarter of 2025, an 18% increase. PLP-USA continued its strong 2026 performance driven primarily by sales growth in the transmission and distribution markets. Among the international segments, The Americas net sales grew 7% on a constant-currency basis, benefiting from the May 2026 acquisition of Delta Star Conetores Electricos Ltda ("Delta Star") and higher communications volumes.

CLEVELAND, OHIO – July 29, 2026 - Preformed Line Products Company (NASDAQ: PLPC) today reported record financial results for its second quarter of 2026.

Q2 2026 highlights:

•Record quarterly net sales of $212.7 million, an increase of 25% from Q2 2025 and 21% from Q1 2026.

•Record quarterly USA sales, with growth of 32% from Q2 2025 and 12% from Q1 2026, driven by robust demand in energy markets, with communications markets also providing increases.

•Gross profit margin of 34.3%, up 160 basis points from Q2 2025 and 300 basis points from Q1 2026.

•Record quarterly diluted EPS of $4.49 per share, up 75% from Q2 2025 and more than doubling from Q1 2026.

Net sales in the second quarter of 2026 were $212.7 million compared to $169.6 million in the second quarter of 2025, a 25% increase. PLP-USA continued its strong 2026 performance driven primarily by growth in energy sales. All International segments also contributed, with each segment increasing sales from Q2 2025. The Americas segment also benefited from the acquisition of Delta Star Conetores Electricos Ltda ("Delta Star") in May 2026. Foreign currency translation increased second-quarter 2026 net sales by $6.0 million.

Prompts

Preformed Line Products Company (ticker PLPC), listed in United States.

ETFs Holding Preformed Line Products Company

ETF Weight in ETF Shares Market value As of
LOPP 0.71% 284 $ 116.599K Jun 30, 2026
SAWS 0.61% 134 $ 47.835K Jul 31, 2026
AIPO 0.31% 8,145 $ 2.393M Nov 13, 2026
PSC 0.23% 12,825 $ 5.265M Jun 30, 2026
FSML 0.14% 415 $ 170.382K Jun 30, 2026
FESM 0.14% 19,136 $ 7.856M Jun 30, 2026
VFMO 0.06% 2,793 $ 1.12M Aug 31, 2026
AVSC 0.05% 5,428 $ 1.502M Nov 16, 2026
RESM 0.04% 4 $ 1,642.24 Jun 30, 2026
DFAS 0.04% 46,955 $ 13.796M Nov 12, 2026
AFSM 0.04% 203 $ 56.186K Nov 16, 2026
DFAT 0.01% 13,145 $ 3.862M Nov 12, 2026
DFAC 0.01% 21,877 $ 6.428M Nov 12, 2026
DCOR 0.01% 10,521 $ 3.091M Nov 12, 2026
MSSM 0.01% 90 $ 36.077K Aug 31, 2026
DFUV 0.00% 2,279 $ 669.616K Nov 12, 2026
DFSU 0.00% 242 $ 71.104K Nov 12, 2026
DFAU 0.00% 1,109 $ 325.846K Nov 12, 2026
DFUS 0.00% 827 $ 242.989K Nov 12, 2026
DXUV 0.00% 199 $ 58.47K Nov 12, 2026
AVUS 0.00% 1,241 $ 343.484K Nov 16, 2026