Posted on September 23, 2026 by PDF Solutions _Posted on Electronic Engineering Journal: Click here to view original article and podcast _ By: by Amelia Dalton My podcast guest this week is a powerhouse of the semiconductor industry: Ramune…
Posted on September 23, 2026 by PDF Solutions
_
By: by Amelia Dalton
My podcast guest this week is a powerhouse of the semiconductor industry: Ramune Nagisetty. Ramune, best known for developing the chiplet-based system-in-package architecture concept, joins me this week to discuss her foundational work on chiplet-based system-in-package architectures, the current reality of chiplet interoperability, and the role of artificial intelligence in semiconductor design and manufacturing. We also chat about her leadership at PDF Solutions and her music career in my hometown of Portland, Oregon.
PODCAST
Amelia’s Weekly Fish Fry – Episode 698
Publication date: September 11, 2026
AMELIA: Hello there, everyone. Welcome to episode number 698 of this here electronic engineering podcast called Amelia’s Weekly Fish Fry, brought to you by EEJournal.com and written, produced, and hosted by yours truly, Amelia Dalton.
Folks, I am absolutely thrilled to bring you a powerhouse of the semiconductor industry. My guest is none other than Ramune Nagisetty. If you didn’t know, she is best known for developing the chiplet-based system and package architecture concept that has reshaped the semiconductor industry.
In this week’s podcast, Ramune and I discuss her foundational work on chiplet-based system and package architectures, the current reality of chiplet interoperability, and the role of artificial intelligence in semiconductor design and manufacturing. We also chat about her leadership at PDF Solutions and her music career in my hometown of Portland, Oregon.
So, without further ado, please welcome Ramune to Fish Fry.
Hi, Ramune. Thank you so much for joining me.
RAMUNE: It’s great to be here.
AMELIA: Excellent. Okay, so you were instrumental in the development of the system-in-package architecture concept based on chiplets. So, Ramune, how did you come up with that idea?
RAMUNE: All right. Well, it’s actually an interesting story.
My background is in transistor device physics and process integration, which is actually pretty far down the line from the concept of chiplets and advanced packaging. So there’s a path towards this.
It started with my early career and the concept of transistor dimensional scaling that, in those days, resulted in improvements to the performance and power efficiency of chips. In those days, this was called Dennard scaling, and it started to become more challenging. And that’s primarily due to the difficulty in scaling oxide thicknesses and the high leakages associated with those very thin oxides.
So, at that time, we had really big innovations, and that included strained silicon, and that was used to improve electron and hole mobility. And then it moved to high-k metal gate and then to FinFET, which was essentially taking the transistor into the third dimension to improve the overall electrostatics and increase the transistor channel width to improve the performance.
So, I was involved with all of those technologies at Intel, and from a device perspective, each technology was getting increasingly challenging, more complex, and more expensive.
And so, at the same time, the demands for process integration required that these very complex process nodes also had to meet the needs of different types of circuits. And that included digital circuits, analog circuits, mixed signal, SRAM, and high voltage.
And so, some of these circuits didn’t continue to scale at the leading-edge technology node. And so, essentially, you were going to be putting in your design circuits that weren’t going to benefit from the cost and complexity of being on that leading-edge node.
And it started to feel at that time that the process complexity and the associated expense of all these diverging requirements would be better served by separating those functionalities into different chiplets.
So, some of the circuit designs, especially analog designs, were always the long pole in the tent in terms of validation. And those ended up being the gating item for getting a monolithic chip to actually yield.
It seemed that breaking those into designs of different chiplets that could then be reused, instead of redesigning and revalidating on every node, would be a good idea.
So, that was, you know, early in the 2005 timeframe that this was something that started to be on my mind.
And then around 2008, at Intel, we were having a lot of discussion around the concept of system-on-chip, which is basically building chips out of individual IP blocks. And those different IP blocks could be designed by Intel or by different IP providers in the ecosystem.
And there’s this concept of IP block reuse as a way to improve design efficiency. And so, you start thinking about building chips out of these blocks.
And so, in this case, they were IP blocks. So, those were parts of the design.
But I kind of took this idea and I started to think, well, what if these IP blocks were actually physical blocks? Not just, you know, IP blocks as design blocks, but actual physical blocks, like LEGO blocks are, you know, also a type of physical block.
And so, the concept of this chiplet was to create a physical IP block that could be optimized for a specific technology node. And that node would not necessarily be the most expensive and complex leading-edge node.
And the cost of that physical IP block, or chiplet, would then be amortized through reuse across a family of products.
And so, this kind of was a long path to getting to this idea.
But I presented this to Intel’s executives in 2010, and it was called the Intel System and Package Tiled Architecture. And in those days, we didn’t really know if tile was a good word or chiplet was a good word. But those words were essentially interchangeable at the time, and they kind of still can be used interchangeably. They have some nuance associated with them.
But the idea was that we’d create a chiplet library, and it would be on different nodes and even use different foundries. And then you’d be able to mix and match those chiplets according to specific market needs and specific design requirements and use an advanced packaging substrate to integrate those chiplets.
And so, back in 2010, we talked about this at the executive level at Intel, and we talked about the importance of having architected interfaces to promote the interoperability of chiplets.
We talked about the importance of testing for known-good die and the importance of co-designing all the way from the chiplet to the package and the board.
That included everything from floor planning to routing and thermal dissipation. We even talked about logistics and inventory management.
And so, basically, back in 2010, we had kind of talked about a lot of the challenges and the opportunities that we are still talking about today.
And so, that was about 16 years ago now. But that’s essentially the story of how this idea of chiplets came to be.
AMELIA: Did you know at the time that it would create a seismic change in the semiconductor industry?
RAMUNE: I actually thought that the seismic change would come sooner than it did.
There was actually a lot of resistance to this idea, and that’s not a bad thing, because when things are working really well, there has to be some sort of inflection point in order to really drive change.
And back in those days, things were working relatively well, as you know, as they were with monolithic chips.
And so, I did get two different types of reactions when I first made the pitch for this in 2010. And these are really interesting reactions.
The first reaction was that, you know, we’re already doing this. Why should we do anything different? Because we’re already doing this.
And indeed, at Intel and also in the rest of the industry, there were products that were made out of multi-chip packages. But a lot of times those products were implemented as an afterthought and not really designed ground-up to be multi-chip type of products.
And then the other reaction I got, which was really interesting, was that this is a really dumb idea and it’s never going to go anywhere.
So, it was really interesting because these are two bookends that are quite opposite from each other.
And I feel like that’s not uncommon. Sometimes people can look at something and they can say, you know, either one of these things — that, to a certain extent, we’re doing this — and to keep going farther down this path is a bad idea.
But today, the concept has really taken off, and it really took a couple of key inflection points in order to really drive this forward.
And the first is that AI compute, which, you know, started really taking off actually more than a decade ago in terms of basic AI compute and things like the ImageNet competition and so forth.
The GPUs being used at the time needed additional memory in the package. And initially, that memory was to include in-package DRAM, and then that evolved to high-bandwidth memory, or what’s called HBM.
And so, it started to kind of shift everything towards using advanced packaging integration.
And in-package DRAM and HBM, people wouldn’t necessarily call those chiplets. They’d probably call them more like in-package components. But they did use interfaces that were architected for package-level integration, and those interfaces did evolve to become industry standards to promote interoperability.
And so, that is one key inflection point.
And then the second inflection point is that the compute today that AI uses uses a lot of silicon, and they use very big die. Many products use full-reticle die, which is basically using the entire image that can be printed with lithography. And some, there are even some vendors that are using, like, a full wafer of silicon for their compute.
And so, now we’re talking about, you know, using multiple full-reticle die, very large die inside the package. And that really drives the use of advanced package integration to stitch those full-reticle die together.
Also, in some cases, breaking that full-reticle die into multiple pieces can improve the yield of that product because yield is very sensitive to the total area of the die.
And so, then again, you can use advanced packaging to stitch those different die together, or those chiplets.
And so, those two drivers — both of those originate from this inflection point with AI compute. And they’ve caused almost all leading-edge AI chips to use advanced packaging integration of chiplets.
In fact, I can’t really think of any AI chips today that don’t use advanced packaging.
And in some cases, companies are going for vertical 3D integration of chiplets, for example, integrating memory on top of logic. And in others, they’re kind of going horizontal and going for the massive 2.5D integration, which is what we call that.
And so, an inflection point like this really drove this concept forward, and that’s where we are today with that.
AMELIA: To which extent has the vision of full chiplet interoperability between chiplets from different companies been realized?
RAMUNE: This is really interesting.
So, the most common interoperable component in the package today is high-bandwidth memory, and that’s fully standardized.
But for the interoperability of chiplets inside the package, the rest of those chiplets is today essentially all done inside individual companies.
And there are some examples of companies like AMD, which has done an amazing job with developing a portfolio of interoperable chiplets. But those chiplets are only used by AMD.
Like, AMD doesn’t sell those chiplets to anybody else, and AMD isn’t having other companies design and provide chiplets for their products.
And so, this concept of interoperability has gone a long way, but it hasn’t really extended to the point of, you know, the idea of a new industry-scale ecosystem of interoperability.
And there’s a lot of effort to create standards in this space to promote this. And some of these standards come through the Open Compute Project and the Universal Chiplet Interconnect, which is called UCIe.
And now a company, Tenstorrent, has released something called the Open Chiplet Atlas.
So, there’s a lot of effort to create this interoperability so that every company — especially small companies that don’t want to design all of the chiplets — like Tenstorrent is a perfect example of that.
They want to design the aspect of the chip or the product that they’re very good at, and that’s how they want to specialize. And they want to be able to capitalize on other companies designing and providing chiplets that they can then integrate for other things that may not be the number-one leadership capability that Tenstorrent has.
So, there is a lot of effort in this space, and there has been for many years.
But the challenge is that, from a business perspective, being able to kind of orchestrate chiplets from different companies carries with it a lot of risk.
And so, one of those risks is being able to guarantee that you’re integrating what we call known-good die inside your package.
Let’s say that you’ve integrated, you know, like even today, integrating high-bandwidth memory in with your very expensive AI GPU has a risk associated with it.
Because what if that HBM die is faulty and you’ve already committed your expensive AI processor into that package? Then you might have to throw away the entire, you know, all the goodness, or at least kind of deprecate that product to say, well, it’s not going to have the full functionality that’s expected.
And so, a company that is selling this integrated product doesn’t inadvertently want to include any kind of defective chiplets that would then cause the rest of the content in the package to have low or potentially no value.
And they also want to be able to trace all of the chiplets and all the faults out into the field.
For example, some of these products might be able to be used in self-driving cars. And if that car has an accident that’s the fault of some of the compute chips inside that car, you know, we want to be able to track that problem, that defect.
And today, it’s not entirely possible to, like, trace where the fault is all the way back and then basically assign that fault to, you know, whoever provided that chiplet.
And if it’s a small company that provided that chiplet, they may not even be able to really fully assume all the responsibility that might take place with a really large problem like that.
And so, there are a lot of business issues, not just technical issues, that are associated with these challenges.
And I think that’s the part that is easy to underestimate, you know, when people are talking about things very from a very simple perspective, like, oh, we’ve got these LEGOs and just like LEGOs are interoperable because of these little interfaces, we can just, you know — like, the concept seems very simple.
But from a business perspective, it’s not that simple.
AMELIA: You are now at PDF Solutions, a company building analytics and orchestration platforms to support design and manufacturing. So, what exactly is your role as Director of Enterprise Accounts about?
RAMUNE: All right. I’ll start with how I got to PDF, because I think that’s really part of the story.
Before I was at PDF, I was at Intel for 29 years. And so, in the last few years of my job there, I deployed several of PDF’s products, specifically test chip characterization and eProbe voltage contrast tools for inspection within Intel.
And so, I had firsthand experience being a customer of PDF, and I got to know PDF’s offerings very well from the customer perspective.
After 29 years at Intel, I decided to try something new. And so, last year in January, I joined the National Center for the Advancement of Semiconductor Technology, which was called Natcast.
And that was a public-private nonprofit that was set up by the CHIPS Act. But that whole Natcast entity was dissolved in September of last year when the current administration decided that it wanted to go a different direction in terms of how to administer the CHIPS Act.
And so, that is when I joined PDF Solutions.
But I was bringing with me, you know, the experience of being a customer and also the role that I had at Natcast, which was interacting with entities across the entire worldwide semiconductor ecosystem.
And so, I think that really brings something of value to PDF.
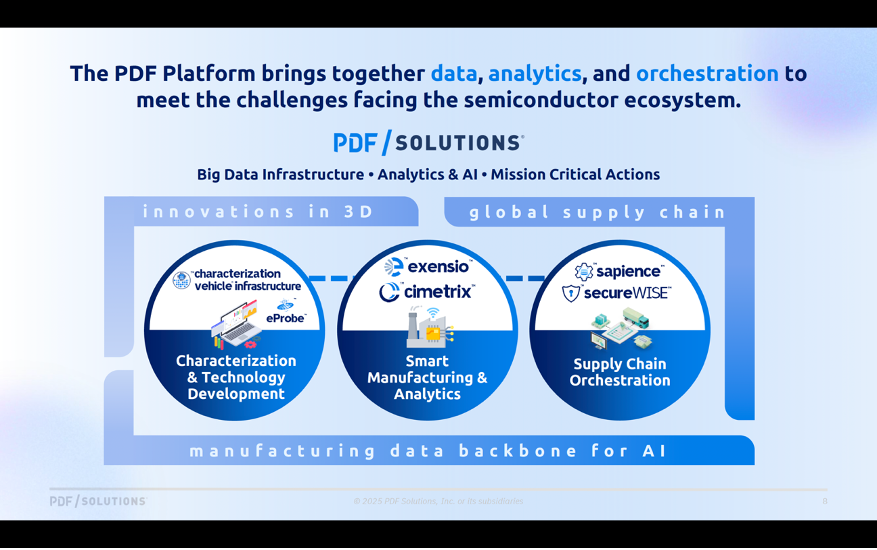
And so, today, as Director of Enterprise Accounts, I work with existing and potential future customers, and I try to understand what their problems are and come up with solutions based on PDF’s suite of capabilities.
And it suits me really well since I was previously a customer of PDF when I was at Intel. And I also really appreciate it because PDF plays a central role in the worldwide semiconductor ecosystem.
And so, I find it to be an interesting perspective with a lot of really interesting opportunities, and I continue to be able to interact with companies, you know, across the worldwide ecosystem.
AMELIA: So, how do you see the role of AI in the context of semiconductor design and manufacturing evolving over time?
RAMUNE: Well, so AI has created quite a lot of buzz, as everybody knows. And the semiconductor industry provides the compute hardware for AI applications.
And so, this whole semiconductor industry needs to be able to provide the leading-edge silicon and also provide the memory and so forth for these new AI data centers.
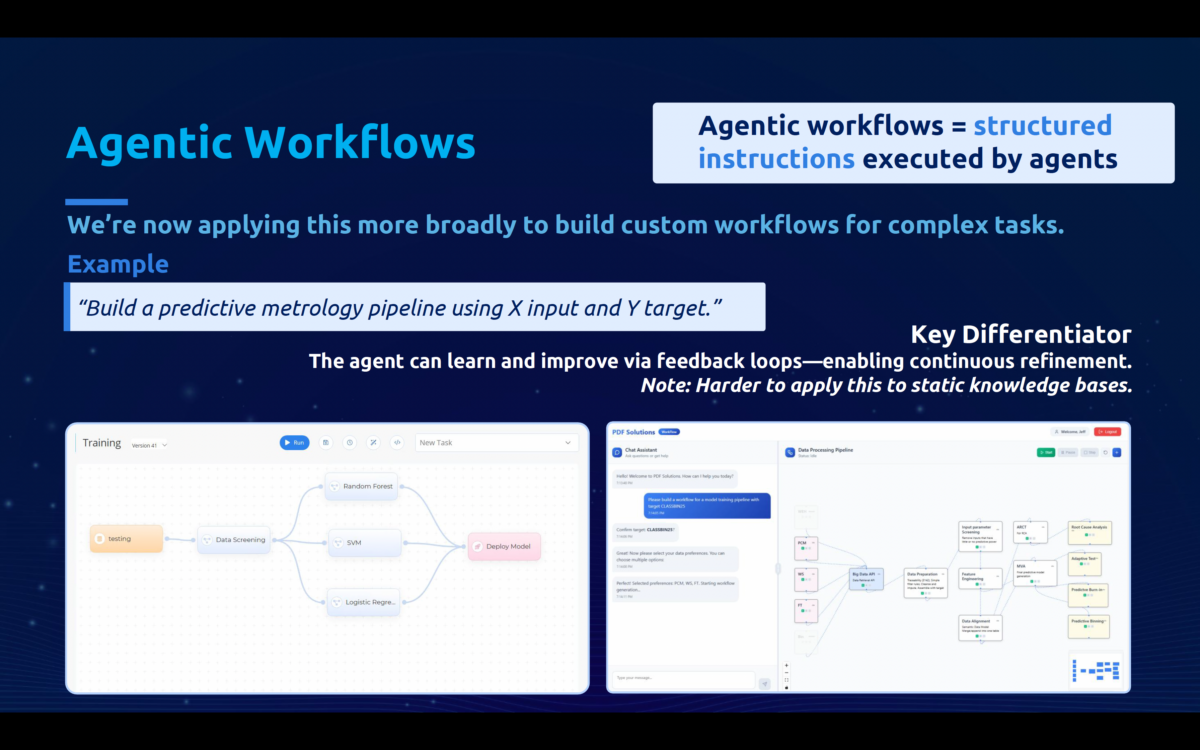
And so, there are lots of exciting applications for AI these days, and people are very much aware of those. And that includes using AI for chip design, AI for writing software, you know, AI, agentic AI, just, you know, for kind of creating workflows and so forth.
But for me, what I see is an incredible opportunity to do more with AI in semiconductor technology research, development, and manufacturing.
And so, starting with technology research, there are opportunities for large-scale exploration of innovative materials. And kind of exploring all those materials would be very expensive and actually impossible to do physically due to the overall expense of creating these physical materials.
But with AI, you can kind of explore this material space more efficiently and then down-select what could be the most interesting materials.
You can model how those materials behave in transistors and memory. And then you can potentially test out these materials in the physical world by figuring out how to create them and then test them physically.
Now, there’s been this big announcement from the Department of Energy, the Genesis Project, where big AI supercomputers — that compute capacity has been awarded to innovators in different spaces. And that includes, in terms of materials exploration.
So, that’s one application for AI in materials research.
And then in technology development, there’s a lot that can be done to accelerate learning by creating AI-ready datasets and also just by using AI to completely change the way that physical design is optimized with process technology.
And there are startups working in this space as well, and lots of really interesting announcements happening.
So, you know, what I personally see is that we have a very limited and very specialized workforce, and people work really hard. You know, most of the people I know who work in this space are working a lot, and it’s very hard to find really well-qualified people to even hire to help out.
And so, by using AI and kind of creating AI workflows, we essentially assist those people to be able to do their work more efficiently and potentially have better work-life balance.
So, that’s another application for AI in the development space.
And even in the manufacturing space, there’s a ton of opportunity to improve learning rates.
And so, the semiconductor industry really relies on doing lots of experiments and analyzing lots and lots of data in order to improve the performance and yield of the underlying silicon technology.
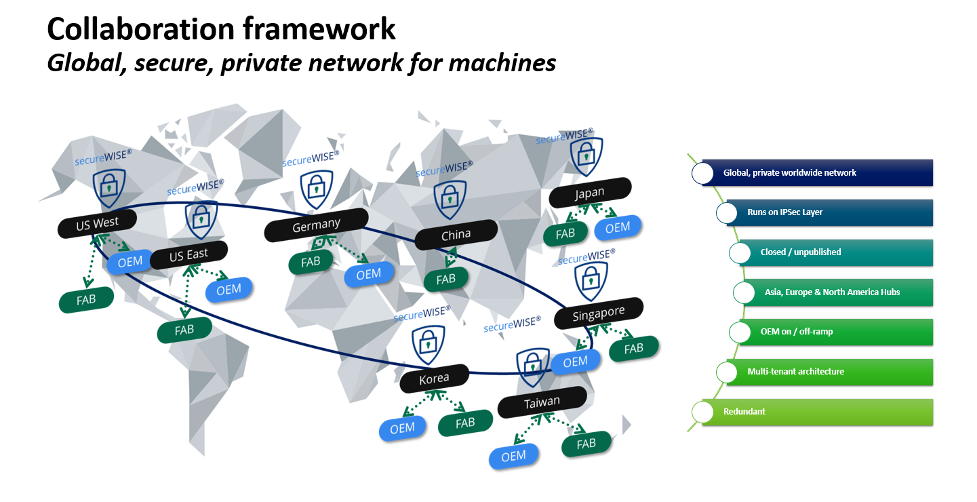
And that really relies on aggregating data from multiple manufacturing sites because the more data you have, the faster you can learn.
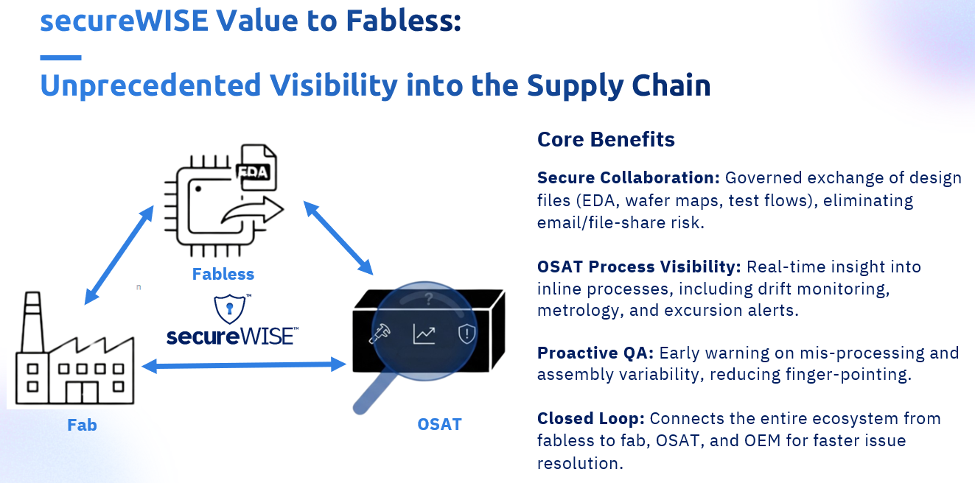
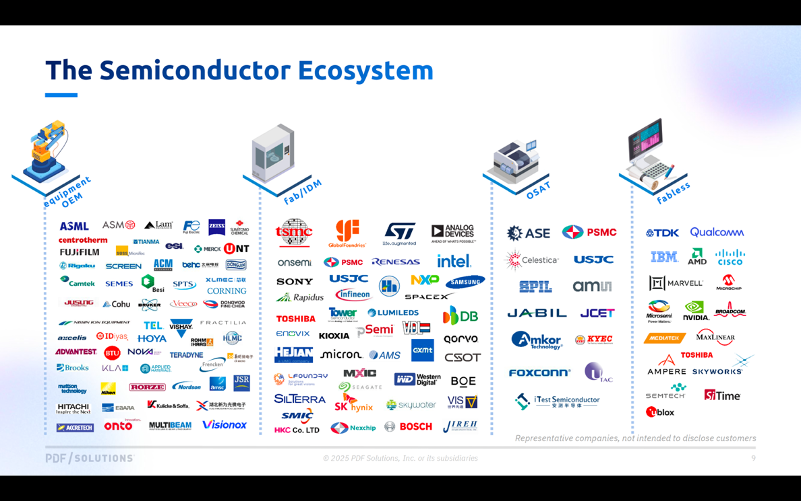
And that also includes collaboration across multiple entities, such as equipment and materials vendors, as well as fabless companies and OSATs.
All this kind of collaboration and aggregation of data has the potential to dramatically improve the rate of learning.
And then additionally, chiplets add a ton of complexity to the picture because these different chiplets all have to be tested differently, and they may be coming from different foundries. They may be coming from different OSATs.
And basically, being able to overcome those data silos and create AI-ready datasets, and then unleash the AI models that are really industry-specific, will also improve the whole picture in terms of chiplet integration.
AMELIA: Excellent. All right, it is time for your off-the-cuff question. So, I got a little something different for you today.
Let’s talk about you writing your own songs and singing in two bands in my hometown of Portland, Oregon. How did you get started in this?
RAMUNE: All right, so this is something I love.
I actually learned how to play the guitar and sing with other people when I was really young in Toledo, Ohio. And I grew up going to Catholic elementary school and Catholic high school. And I was in the folk mass.
And so, I learned how to play guitar in the folk mass at school when I was very young.
And I stopped playing for many years as I became, like, a cool teenager, and I had, you know, all my friends to keep me busy with and all of that stuff.
But I picked up music again as an adult.
And then in my early 40s, I somehow got this bug to start writing original music. And so, I started writing songs and recording songs.
And I think I might have, like, four kind of albums that I’ve recorded by now, and they’re available on all streaming platforms and all of that stuff.
But I basically started with original music, and that band — first band — was called Rocket Three. We started in 2011.
My brother, who also lives in Portland, played bass, and Rocket Three still plays. And we still play at local dive bars in Portland.
And then my second band, which is called Avalanche Lily, is me and two other women. And we play mostly cover songs.
And we play really obscure cover songs that only very cool Portland people would recognize, from bands like Pavement and Sebadoh and Hüsker Dü. So, you know, not exactly today’s mainstream music.
And these two bands both play. Avalanche Lily is actually playing next weekend at Milwaukee Porch Fest.
And both bands, at this time, we have multiple singers. We use tons of harmonies.
Singing harmony is one of my favorite things. Also, listening to other bands that have harmonies is one of my favorite things.
And so, it’s a really wonderful way to be part of Portland. And Portland is really unique in that there are still venues where local bands can play and bands that play original music can play.
It’s not uncommon for musicians who are in bands in Portland to be in multiple bands. It’s almost the norm.
And so, it’s just one of the kind of the funnest things you can do as a musician in Portland, is to be part of this Portland music scene.
I love it so much.
AMELIA: I’m gonna have to come see you play sometime.
RAMUNE: That would be fun.
AMELIA: Well, Ramune, this has been awesome. Thank you so much for joining me.
RAMUNE: Oh, it was all my pleasure.
AMELIA: If you’d like even more information about PDF Solutions, I’ve included a link below the player on this week’s Fish Fry-ing page on EEJournal.com and in the description for this week’s YouTube episode as well.
Hey, have you checked out EE Journal on social media yet? Well, you should.
You can find us at Facebook.com/EEJournal. If LinkedIn is more your thing, I dig it. You can follow us or me on LinkedIn.
And we are also on Bluesky Social and Mastodon as well.
And we have a YouTube channel, YouTube.com/EEJournal. Folks, it is chock-full of all kinds of techie videos, including our very popular Chalk Talk webcast series hosted by me.
And, of course, you can subscribe to our EE Journal YouTube channel as well.
Thank you, everyone, for tuning in.
If you know of any cool new technology or, heck, you just want to chat, shoot me a line at Amelia — that’s [email protected]
— or post a comment on our forums on EE Journal.
For the week of September 11th, 2026, I’m Amelia Dalton, and you’ve been fried.
Ready to get started?
Contact
Ready to get Started with PDF Solutions?
Learn how we can transform your manufacturing data into actionable intelligence and improve your product yield, quality, and reliability
Schedule A Demo
Contact Us
Corporate Headquarters
2858 De La Cruz Blvd.
Santa Clara, CA 95050 USA
Phone: 408-280-7900
Fax: 408-280-7900
Follow Us on Social Media
© 2026 PDF Solutions. All rights reserved.





 Posted on Semiconductor Engineering: