January 27, 2026, Bellevue, Washington – “PACCAR reported very good annual revenues and net income in 2025,” said Preston Feight, chief executive officer. “PACCAR Parts and PACCAR Financial Services delivered record revenue and strong profits.…
January 27, 2026, Bellevue, Washington – “PACCAR reported very good annual revenues and net income in 2025,” said Preston Feight, chief executive officer. “PACCAR Parts and PACCAR Financial Services delivered record revenue and strong profits. Kenworth, Peterbilt and DAF’s premium quality trucks contributed to the very good results. I am very proud of our employees and dealers who delivered outstanding trucks and transportation solutions to our customers.”
PACCAR achieved quarterly revenues of $6.82 billion in the fourth quarter of 2025, compared to $7.91 billion reported in the same period in 2024. The company earned $556.9 million ($1.06 per diluted share) in the fourth quarter of 2025, compared to $872.0 million ($1.66 per diluted share) earned in the fourth quarter of 2024.
PACCAR earned net income of $2.38 billion ($4.51 per diluted share) in 2025, including the $264.5 million after-tax, non-recurring charge related to civil litigation in Europe. PACCAR achieved adjusted net income (non-GAAP) of $2.64 billion ($5.01 per diluted share) in 2025, which was the fourth best in the company’s 120-year history. PACCAR reported 2025 annual revenues of $28.44 billion.
Feight added, “PACCAR’s North American truck factories are optimally located to operate under the Section 232 truck tariff regulations that began in November. PACCAR produces trucks in the United States, Canada and Mexico for the local markets, which minimizes tariff costs.”
John Rich, executive vice president and chief technology officer, commented, “Surveying the emissions regulatory environment, the EPA re-affirmed the EPA27 NOx limit to be 35 milligrams. The EPA’s actions provide clarity to the market and help customers make buying decisions.”
**PACCAR Dividends
**PACCAR declared cash dividends of $2.72 per share during 2025. This included a $1.40 per share year-end cash dividend paid on January 7, 2026. Mark Pigott, executive chairman, said, “In 2025, PACCAR celebrated 120 years of innovation and industry leadership. PACCAR has generated excellent shareholder returns due to its premium quality vehicles, strong aftermarket parts and financial services businesses, and technology solutions that enhance customers’ operational performance. PACCAR’s shareholders have earned returns that have exceeded the S&P 500 index for the last 20 years.”
Business Highlights – 2025
- PACCAR earned its 87th consecutive year of net income.
- PACCAR delivered 144,200 vehicles worldwide.
- DAF XD and XF Electric trucks each earned the International Truck of the Year 2026 award.
- The DAF XF truck was honored as Fleet Truck of the Year in the U.K.
- Kenworth and Peterbilt introduced next generation battery-electric trucks.
- Kenworth is constructing a 46,000 sq. ft. robotic chassis paint facility in Chillicothe, Ohio.
- PACCAR built a 50,000 sq. ft. engine remanufacturing facility in Mississippi.
- PACCAR Parts opened a new Parts Distribution Center in Calgary, Canada.
- PACCAR earned an “A” rating from CDP (formerly Climate Disclosure Project).
- Peterbilt was honored to be named a Military Friendly Employer in the United States.
- PACCAR was recognized as a 2025 Top Company for Women to Work for in Transportation.
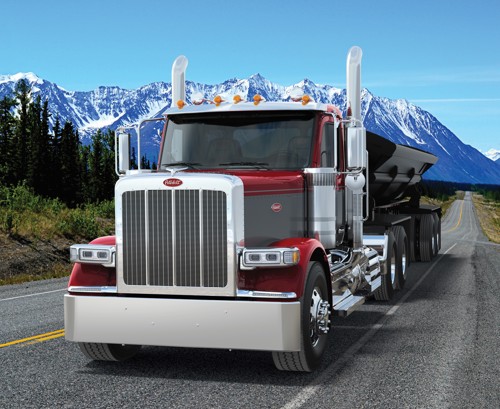
Peterbilt 589 Truck
**Financial Highlights – Fourth Quarter 2025
**Highlights of PACCAR’s financial results during the fourth quarter of 2025 include:
- Consolidated revenues of $6.82 billion.
- Net income of $556.9 million.
- Record PACCAR Parts revenue of $1.74 billion.
- PACCAR Parts pretax income of $415.0 million.
- PACCAR Financial Services pretax income of $114.9 million.
- Cash provided by operations of $1.14 billion.
**Financial Highlights – Full Year 2025
**Highlights of PACCAR’s financial results during 2025 include:
- Consolidated revenues of $28.44 billion.
- Net income of $2.38 billion and adjusted net income of $2.64 billion.
- After-tax return on revenues of 8.4%.
- Record PACCAR Parts revenue of $6.87 billion.
- PACCAR Parts pretax income of $1.67 billion.
- Financial Services assets of $22.80 billion.
- Financial Services pretax income of $485.4 million.
- Cash provided by operations of $4.42 billion.
- Dividends declared of $1.43 billion.
- Medium-term note issuances of $3.12 billion.
- PACCAR invested $1.17 billion in capital projects and research and development.
**Global Truck Markets
**Kenworth and Peterbilt achieved excellent U.S. and Canada Class 8 retail sales market share of 30% in 2025. U.S. and Canada Class 8 truck industry retail sales were 233,000 units in 2025 and are estimated to be in a range of 230,000-270,000 trucks in 2026. “Industry truck orders increased in December,” said Laura Bloch, PACCAR senior vice president. “The truck market is responding to the clarification of tariff policy and emissions regulations, which combined with early improvements in freight fundamentals, should lead to a stronger truck market in 2026.”
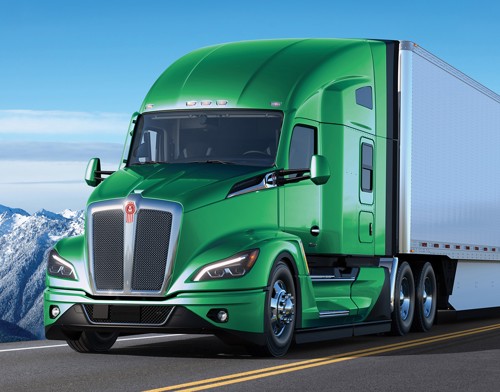
Kenworth T680 Truck
Harald Seidel, DAF president, said, “Customers appreciate the industry-leading fuel efficiency and driver comfort of DAF trucks. DAF trucks have a competitive advantage in the European truck market due to an innovative, aerodynamic design with a spacious, luxurious cab interior.” European above 16-tonne truck industry registrations were 298,000 trucks in 2025 and are estimated to be in the range of 280,000-320,000 trucks in 2026.
The South American above 16-tonne truck market was 115,000 vehicles in 2025 and is estimated to be in the range of 100,000-110,000 trucks in 2026. “Kenworth and DAF premium trucks deliver the durability and reliability that customers desire in the South American market,” said Mike Dozier, PACCAR executive vice president.
**DAF XF and XD Electric Trucks Earn International Truck of the Year 2026
**The DAF XF and XD Electric trucks were named International Truck of the Year 2026 at the Solutrans exhibition in Lyon, France. Rob Appels, DAF director of communications, said, “Achieving the International Truck of the Year honor for the third time in the last five years is a wonderful recognition for our DAF employees and the industry-leading trucks they design and produce.”
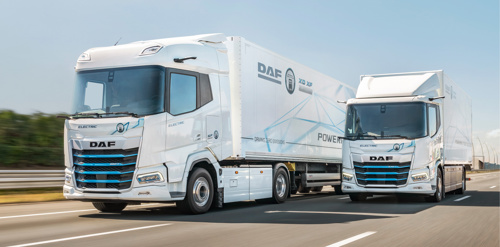
DAF XF and XD Electric Trucks
DAF’s XD and XF Electric trucks were recognized by the judges for their exceptional energy efficiency, refined and powerful driveline, long driving range, safe and cost-effective battery technology, and superior driver comfort. DAF designed the trucks for both city and regional distribution and long distance applications, combining excellent aerodynamics with a low cab position, high visibility, and advanced digital camera systems for superior safety and visibility.
**PACCAR Parts Achieves Record Annual Revenues and Strong Profits
**PACCAR Parts achieved record quarterly revenues of $1.74 billion, 4% higher than the $1.67 billion reported in the fourth quarter of 2024. Fourth quarter pretax income was $415.0 million, compared to $428.2 million earned in the fourth quarter of 2024. Annual revenues were a record $6.87 billion, 3% higher than the $6.67 billion achieved in 2024. PACCAR Parts achieved strong annual pre-tax income of $1.67 billion, compared to $1.71 billion earned in 2024. Bryan Sitko, PACCAR vice president and PACCAR Parts general manager, said, “PACCAR Parts provides strong foundational profitability through all phases of the business cycle. PACCAR Parts’ excellent long-term growth reflects the benefits of investments in transportation solutions that increase customer loyalty and vehicle uptime. These investments include new parts distribution centers (PDCs), Fleet Services, and Managed Dealer Inventory programs.”
PACCAR Parts’ 21 global PDCs, with over 4 million square feet, support more than 2,000 DAF, Kenworth and Peterbilt sales, parts and service locations, and more than 350 TRP stores. PACCAR opened a new 180,000 sq. ft. PDC in Calgary, Canada, to enhance parts delivery to dealers and customers in the region.
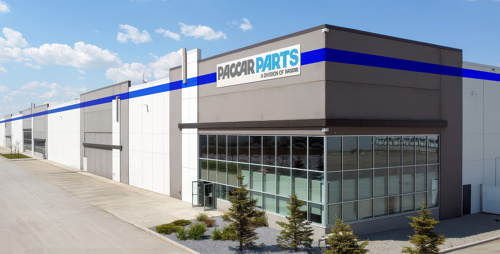
PACCAR Parts Distribution Center in Calgary, Canada
**PACCAR Financial Services Achieves Record Revenues and Strong Profits
**PACCAR Financial Services (PFS) achieved record revenues of $568.7 million compared to $544.3 million in the same quarter of 2024. Pretax income was $114.9 million in the fourth quarter of 2025, 10% higher than the $104.0 million earned in the fourth quarter of 2024. PFS annual revenues were a record $2.21 billion in 2025 compared to $2.10 billion achieved in 2024. PFS earned $485.4 million of pretax profit in 2025, 11% higher than the $435.6 million earned in 2024. “PFS achieved excellent retail market share of 27 percent in 2025,” said Craig Gryniewicz, PACCAR vice president. “PFS is a leader in the market with its superior Kenworth, Peterbilt and DAF vehicles, innovative technologies that provide seamless credit application and loan servicing processes, and its support of customers in all phases of the business cycle.”
PFS has a portfolio of 226,000 trucks and trailers, with total assets of $22.8 billion. PacLease, a major full-service truck leasing company in North America and Europe with a fleet of approximately 39,000 vehicles, is included in this segment. “PACCAR’s strong balance sheet, complemented by its A+/A1 credit ratings, enables PFS to offer competitive retail financing to Kenworth, Peterbilt and DAF dealers and customers in 26 countries on four continents,” said Terren Drake, PACCAR Financial Corp. president. “PACCAR Financial Services has excellent access to the debt markets, issuing $3.12 billion in medium-term notes during 2025.”
**Capital and R&D Investments in Products, Technologies and Facilities
**PACCAR’s excellent long-term profits, strong balance sheet and consistent focus on quality have enabled the company to invest $9.2 billion in new and expanded facilities, innovative products and new technologies during the past decade. PACCAR invested $728 million in capital projects and $446 million in research and development expenses in 2025. PACCAR estimates that it will invest $725-$775 million in capital projects and $450-$500 million in research and development expenses in 2026.
“PACCAR is investing in exciting next generation clean diesel and alternative powertrains, electric battery cells, integrated connected vehicle services, flexible manufacturing capabilities, and autonomous and advanced driver assistance systems, that create value for customers,” said Brice Poplawski, PACCAR senior vice president and chief financial officer.
PACCAR’s new $35 million, 50,000 square foot engine remanufacturing facility in Columbus, Mississippi, will open in the first half of this year.
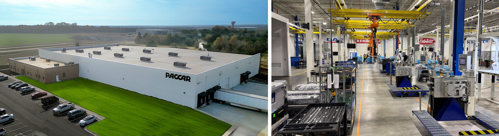
PACCAR Engine Remanufacturing Facility in Columbus, Mississippi
Lily Ley, vice president and chief information officer, said, “PACCAR is embedding artificial intelligence (“AI”) across its business to drive innovation, profitable growth and enhanced performance for PACCAR’s customers. PACCAR created an in-house platform called AI Studio which enables the use of agentic AI tools cross-functionally across PACCAR. Leveraging AI, PACCAR is able to recommend optimal truck configurations during the sales process, helping customers select the right vehicle for their specific business needs. PACCAR’s AI-driven inventory management enhances parts fill rates, ensuring customers receive the correct component in time to maximize truck uptime.”
PACCAR is a global technology leader in the design, manufacture and customer support of high-quality light-, medium- and heavy-duty trucks under the Kenworth, Peterbilt and DAF nameplates. PACCAR also designs and manufactures advanced powertrains, provides financial services and information technology, and distributes truck parts related to its principal business.
PACCAR will hold a conference call with securities analysts to discuss fourth quarter earnings on January 27, 2026, at 9:00 a.m. Pacific time. Interested parties may listen to the call by selecting “Q4 Earnings Webcast” at PACCAR’s homepage. The webcast will be available on a recorded basis through February 3, 2026. PACCAR shares are traded on the Nasdaq Stock Market, symbol PCAR. Its homepage is www.paccar.com
.
This release contains “forward-looking statements” within the meaning of the Private Securities Litigation Reform Act. These statements are based on management’s current expectations and are subject to uncertainty and changes in circumstances. Actual results may differ materially from those included in these statements due to a variety of factors. More information about these factors is contained in PACCAR’s filings with the Securities and Exchange Commission.
**Q4 Earnings Statement
**
 Printable Version
A WORLD OF OPPORTUNITY AWAITS. LEARN ABOUT CAREERS AT PACCAR ➝
PACCAR Companies

 Peterbilt 589 Low Roof Sleeper Truck
 Kenworth T680 Day Cab Truck
 DAF XF Electric Vocational Truck


 Kenworth T880 Vocational Truck
 Peterbilt Freedom 250 Special Edition Model 589 Truck
 DAF Used Truck Center in Warsaw, Poland


