Old Second Bancorp, Inc. is a bank holding company organized in 1981 that serves as the parent for Old Second National Bank, a national banking association. The company operates as a full-service community bank offering deposit products, commercial and consumer lending, trust, and wealth management services. Its loan portfolio includes commercial real estate, residential mortgages, general commercial, construction, leases, and consumer lending, with a specific focus on powersport, collector car, and manufactured home lending following the acquisition of Bancorp Financial and its subsidiary Evergreen Bank Group. The bank serves retail, commercial, industrial, and public entity customers primarily in the Chicago metropolitan area, including Cook, DeKalb, DuPage, Kane, Kendall, LaSalle, and Will counties in Illinois, while maintaining nationwide relationships in commercial, sponsor finance, leasing, and healthcare lending. Subsidiaries include Old Second Affordable Housing Fund, L.L.C., River Street Advisors, LLC, and entities holding foreclosed properties. The company provides electronic banking, corporate cash management, and investment advisory services through its banking centers and digital platforms.

Summarised from the company's own disclosures, fiscal year ended Feb 2026

Industry Banks - Regional Homepage oldsecond.com
Sector Financial Services IR page investors.oldsecond.com/overview/default.aspx
Tags
community banking, commercial lending, consumer lending, wealth management, trust services, residential mortgages, powersport lending, collector car lending, manufactured home lending, corporate cash management, investment advisory, Old Second National Bank, Old Second Affordable Housing Fund L.L.C., Station I LLC, Station II LLC, Station III LLC, River Street Advisors LLC, Bancorp Financial Inc., Evergreen Bank Group, O2 Debit Mastercard
Press page —

Metrics

Valuation  
Market cap $ 1.23B
Market cap (USD) $ 1.23B
P/E 11.79
PEG 1.96
P/BV 1.40
P/S 3.69
P/OCF 7.04
P/FCF 7.16
Dividend yield 1.1%
Turnover / mcap —
Returns  
ROE 10.2%
ROI 6.6%
ROIC 6.6%
Profit margin 24.1%
Growth  
Revenue growing Yes
Profits growing No
Revenue up 3y No
Revenue up 5y —
Earnings growth 3y (net profit CAGR) 6.0%
Quality  
Profitable Yes
Margin expanding No
Buying back stock No
Diluting (TTM) No
Debt/Equity —
Podcast bulls (TTM) Sign up
Podcast bears (TTM) Sign up
Podcast sentiment (TTM) Sign up
Podcast sentiment % (TTM) Sign up
News sentiment (TTM) 23
Quality score 29.4%
Insiders  
Buys, 1w Sign up
Buys, 1m Sign up
Buys, 1y Sign up
Sells, 1w Sign up
Sells, 1m Sign up
Sells, 1y Sign up

Sign up to see this company's insider trades

Figure FY 2025 FY 2024 FY 2023 FY 2022 FY 2021 FY 2020 FY 2019 FY 2018 FY 2017 FY 2016 FY 2015 FY 2014 FY 2013 FY 2012 FY 2011 FY 2010 FY 2009 FY 2008 FY 2007 FY 2006 FY 2005 FY 2004 FY 2003 FY 2002 FY 2001 FY 2000
Revenue 333.097M 279.899M 280.987M 244.924M 133.437M — — 103.451M — — — — — — — — — — — — — — — — — —
Net profit 80.31M 85.264M 91.729M 67.405M 20.044M 27.825M 39.455M 34.012M 15.138M 15.684M 15.385M 10.136M 82.085M -72K -6.498M -108.649M -65.588M 11.824M 23.972M 23.656M 27.683M 26.287M 22.108M 20.146M 17.223M 13.471M
Free cash flow 117.759M 120.746M 104.025M 93.012M 29.014M 22.066M 48.26M 53.012M 36.05M 25.269M 19.857M -7.404M 33.458M 42.254M 28.503M 68.25M 29.599M 35.59M 7.374M 27.682M 564K 3.822M 57.286M 5.544M -4.582M 10.254M

Figure FY 2025 FY 2024 FY 2023 FY 2022 FY 2021 FY 2020 FY 2019 FY 2018 FY 2017 FY 2016 FY 2015 FY 2014 FY 2013 FY 2012 FY 2011 FY 2010 FY 2009 FY 2008 FY 2007 FY 2006 FY 2005 FY 2004 FY 2003 FY 2002 FY 2001 FY 2000
Share price 19.5 17.78 15.44 16.04 12.59 10.1 13.47 13 13.65 11.05 7.84 5.37 4.62 1.46 1.04 1.77 7 13.09 26.5 30.5 — — — — — —
Price performance 12m 0.1 0.15 -0.04 0.27 0.25 -0.25 0.04 -0.05 0.24 0.41 0.46 0.16 2.16 0.41 -0.41 -0.75 -0.47 -0.51 -0.13 — — — — — — —

Filed figures

Figure Dec 2016 Dec 2017 Dec 2018 Dec 2019 Dec 2020 Dec 2021 Dec 2022 Dec 2023 Dec 2024 Dec 2025
Balance sheet detail
Lease liabilities (USD) — — — — — — — 11.6M 12.5M 12.7M
Cash and deposits (USD) 47.3M 55.8M 55.2M 50.6M 330M 752M 115M 100M 99.3M 124M
Intangible assets (USD) — — — — 2.18M 16.3M 13.7M 11.2M 22M 23.7M
Right-of-use assets (USD) — — — — — — — 7.09M 7.36M 7.92M
Cash flow detail
Operating cash flow (USD) 27.3M 37.1M 54.9M 52.6M 26M 31M 97.3M 116M 132M 122M
Purchases of property, plant and equipment (USD) -1.99M -1.06M -1.9M -4.38M -3.92M -2.03M -4.33M -12.4M -10.8M -4.51M
Dividends paid (cash effect) (USD) -888,000 -1.18M -1.19M -1.2M -1.19M -4.61M -8.88M -8.95M -9.41M -12.2M
Share buybacks (cash effect) (USD) -254,000 -236,000 -505,000 -666,000 -5.92M -10.4M -455,000 -605,000 -1.05M -7.41M
Interest paid (cash effect) (USD) -5.33M — — — — — — — — —
Income taxes paid (cash effect) (USD) -211,000 -430,000 -20,000 -4.43M -7.92M -10.6M -10.3M -35.7M -23M -20.7M
Share-based compensation (USD) 657,000 1.18M 2.26M 2.52M 2.1M 1.44M 2.96M 3.6M 3.91M 5.55M
Free cash flow (OCF - PPE - intangibles) (USD) 25.3M 36.1M 53M 48.3M 22.1M 29M 93M 104M 121M 118M
Income detail
Total comprehensive income (USD) 19.6M 25.4M 28.1M 48.1M 38M 14.1M -34.5M 122M 100M 99.3M
Comprehensive income to owners (USD) 19.6M 25.4M 28.1M 48.1M 38M 14.1M -34.5M 122M 100M 99.3M
Reported May 8, 2017 Mar 13, 2018 Mar 6, 2020 Mar 6, 2020 Mar 10, 2022 Mar 10, 2022 Mar 9, 2023 Mar 6, 2025 Mar 6, 2025 Feb 26, 2026

Sign up to see institutional holdings

Sign Up

Podcast Mentions

Sign up to see podcast mentions and sentiment

Sign Up

O2 Sponsor Finance Hires James Benbrook as Vice President Bull 1 Bear 0 Management

October 29, 2026

CHICAGO, IL / ACCESS Newswire / October 29, 2026 / O2 Sponsor Finance, a division of Old Second National Bank, today announced that it has recently hired James Benbrook as Vice President.

"We are excited to announce that James Benbrook has joined as Vice President of O2 Sponsor Finance. James is responsible for structuring and underwriting new and existing lending opportunities while partnering closely with equity sponsors and management teams. James will play an important role in supporting our continued growth strategy, deepening existing sponsor relationships, and helping expand our presence across the lower middle market sponsor finance landscape. We are excited about the expertise, leadership and industry perspective James brings to the team and look forward to his contributions in 2026 and beyond," stated O2 Sponsor Finance President Joe Gaffigan.

James brings substantial experience to his new role, having built a strong track record across financial services. Prior to joining O2, James held positions at Mizuho Americas and Moody's Ratings. He also gained very valuable experience earlier in this career when he spent 5 years on active duty with the United States Coast Guard.

James earned his B.A. in economics from Columbia University. His combination of lending expertise and commitment to client service will be a tremendous asset to our organization.

About O2 Sponsor Finance: O2 Sponsor Finance is a national provider of cash flow-based loans to lower middle market businesses with typically $10 to $100 million in revenue and between $2 million and $10 million in EBITDA. O2 Sponsor Finance focuses on supporting private equity sponsors, independent sponsors and family offices in their acquisition or recapitalization of lower middle market companies. www.O2sponsorfinance.com .

About Old Second Bancorp, Inc.: Old Second Bancorp, Inc., headquartered in Aurora, Illinois, is the bank holding company for Old Second National Bank, which celebrated 150 years of operation in 2021. Old Second's common stock trades on The NASDAQ Stock Market under the symbol "OSBC". More information about Old Second is available by visiting the "Investor Relations" section of its website: www.oldsecond.com .

As of September 30, 2026, Old Second has approximately $6.8 billion in assets, $5.3 billion in deposits, and $5.2 billion in loans.

Old Second National Bank, Member FDIC.
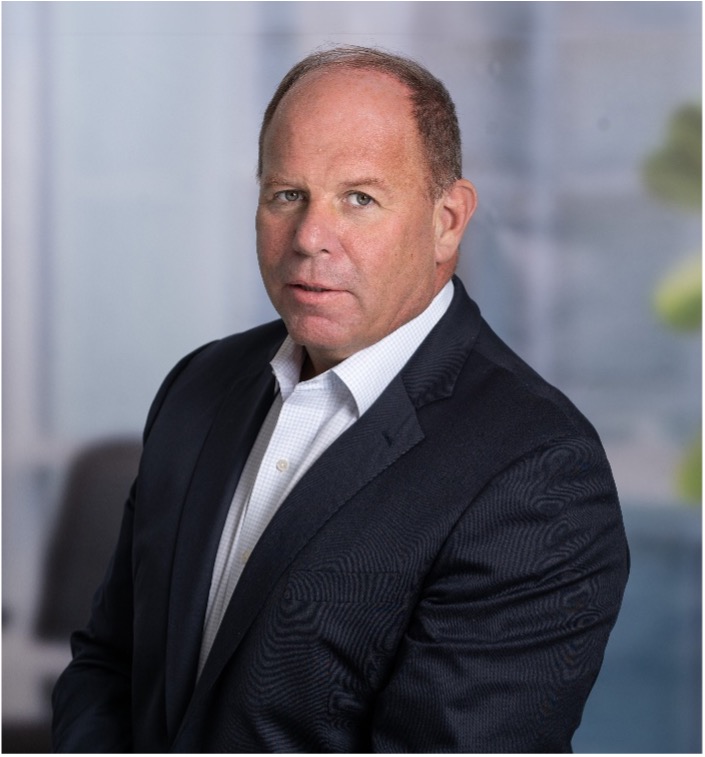
Chief Financial Officer Bull 3 Bear 0 Results

October 21, 2026

(630) 906-5484

Old Second Bancorp, Inc. Reports Third Quarter 2026 Net Income of $28.9 Million,

or $0.56 per Diluted Share

AURORA, IL, October 21, 2026 – Old Second Bancorp, Inc. (the “Company,” “Old Second,” “we,” “us,” and “our”) (NASDAQ: OSBC), the parent company of Old Second National Bank (the “Bank”), today announced financial results for the third quarter of 2026. Our net income was $28.9 million, or $0.56 per diluted share, for the third quarter of 2026, compared to net income of $28.2 million, or $0.54 per diluted share, for the second quarter of 2026. Adjusted net income1 was $28.5 million, or adjusted diluted earnings per share1 of $0.55, for the third quarter of 2026, compared to adjusted net income1 of $28.7 million, or adjusted diluted earnings per share1 of $0.55, for the second quarter of 2026.

Notable Items2

● Net interest and dividend income was $84.0 million, reflecting an increase of $720,000, or 0.86%.

● Net interest margin (NIM) on a fully tax-equivalent basis1 was 5.27%, an increase of four basis points.

● Provision for credit losses of $6.8 million compared to $7.5 million, a decrease of $750,000.

Old Second Bancorp, Inc. — Other Events Bull 0 Bear 0 Capital return

On October 20, 2026, the Registrant’s Board of Directors declared a cash dividend of $0.08 per share payable on November 9, 2026, to stockholders of record as of October 30, 2026.

2

Prompts

Old Second Bancorp, Inc. (ticker OSBC), listed in United States.

ETFs Holding Old Second Bancorp, Inc.

ETF Weight in ETF Shares Market value As of
JPSV 0.45% 5,152 $ 127.564K Nov 17, 2026
SCDS 0.28% 1,044 $ 25.849K Nov 17, 2026
BSVO 0.27% 262,084 $ 6.49M Nov 18, 2026
VFMF 0.14% 54,759 $ 1.373M Aug 31, 2026
AVUV 0.13% 1,680,571 $ 42.149M Nov 16, 2026
AVSC 0.08% 96,965 $ 2.432M Nov 16, 2026
PSC 0.08% 78,374 $ 1.828M Jun 30, 2026
VFVA 0.08% 29,529 $ 740.587K Aug 31, 2026
DFSV 0.06% 694,233 $ 17.432M Nov 12, 2026
RESM 0.06% 89 $ 2,075.48 Jun 30, 2026
DFAT 0.05% 594,140 $ 14.919M Nov 12, 2026
DFAS 0.03% 391,734 $ 9.836M Nov 12, 2026
FESM 0.01% 34,035 $ 793.696K Jun 30, 2026
DXUV 0.01% 29,394 $ 738.083K Nov 12, 2026
AVSU 0.01% 989 $ 24.804K Nov 16, 2026
MSSM 0.01% 2,236 $ 56.079K Aug 31, 2026
DFAC 0.01% 236,410 $ 5.936M Nov 12, 2026
DCOR 0.00% 72,328 $ 1.816M Nov 12, 2026
DFSU 0.00% 3,322 $ 83.415K Nov 12, 2026
DFAU 0.00% 13,109 $ 329.167K Nov 12, 2026
DFUS 0.00% 15,475 $ 388.577K Nov 12, 2026
EBI 0.00% 59 $ 1,479.72 Aug 31, 2026
AVUS 0.00% 25,880 $ 649.07K Nov 16, 2026