Oct 28, 2026 Third quarter comparable store sales growth of 7.2% 14% increase in third quarter diluted earnings per share to $0.97 $2.6 billion net cash provided by operating activities year-to-date SPRINGFIELD, Mo., Oct. 28, 2026 (GLOBE NEWSWIRE)…
Oct 28, 2026
-
Third quarter comparable store sales growth of 7.2%
-
14% increase in third quarter diluted earnings per share to $0.97
-
$2.6 billion net cash provided by operating activities year-to-date
SPRINGFIELD, Mo., Oct. 28, 2026 (GLOBE NEWSWIRE) — O’Reilly Automotive, Inc. (the “Company” or “O’Reilly”) (**Nasdaq:**ORLY), a leading retailer in the automotive aftermarket industry, today announced record revenue and earnings for its third quarter ended September 30, 2026.
3rd****Quarter Financial Results
Brad Beckham, O’Reilly’s CEO, commented, “I would like to thank our Team Members for their unwavering commitment to providing industry-leading service to each of our customers. Team O’Reilly’s dedication was evident in our strong third quarter comparable store sales increase of 7.2%. This robust growth came on top of strong sales in the third quarter last year, resulting in a two-year stack of 12.8%, and was driven by share gains on both sides of our business, with double-digit growth in our professional business and mid-single digit growth in DIY. Our impressive top-line growth, coupled with a $39 million benefit from tariff refunds received during the third quarter, drove a 14% increase in our third quarter diluted earnings per share. We are extremely pleased with the continued ability of our Team to deliver industry-leading results through their hard work and unrelenting focus on our customers.”
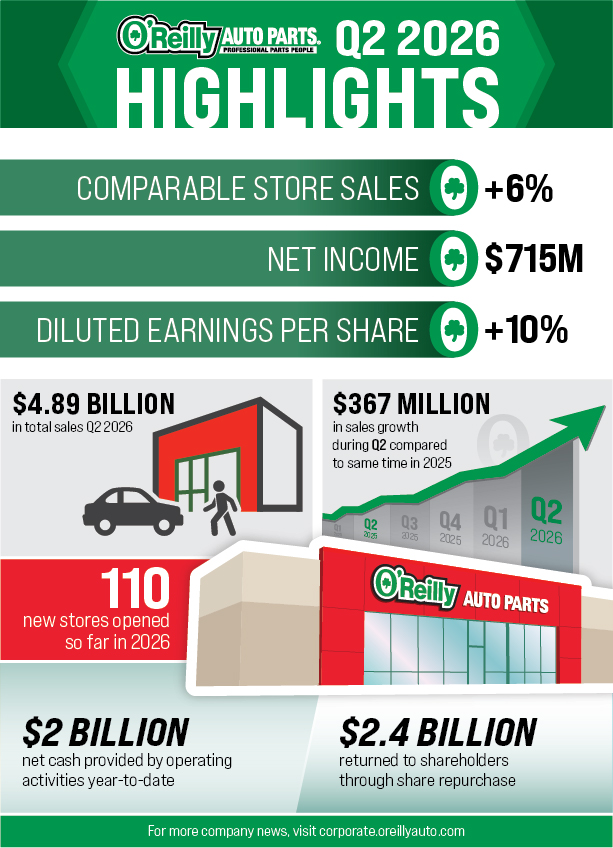
Sales for the third quarter ended September 30, 2026, increased $416 million, or 9%, to $5.12 billion from $4.71 billion for the same period one year ago. Gross profit for the third quarter increased 10% to $2.68 billion (or 52.4% of sales) from $2.44 billion (or 51.9% of sales) for the same period one year ago. Selling, general and administrative expenses (“SG&A”) for the third quarter increased 8% to $1.58 billion (or 30.9% of sales) from $1.46 billion (or 31.1% of sales) for the same period one year ago. Operating income for the third quarter increased 13% to $1.10 billion (or 21.4% of sales) from $976 million (or 20.7% of sales) for the same period one year ago.
Net income for the third quarter ended September 30, 2026, increased $60 million, or 8%, to $786 million (or 15.3% of sales) from $726 million (or 15.4% of sales) for the same period one year ago. Diluted earnings per common share for the third quarter increased 14% to $0.97 on 812 million shares versus $0.85 on 853 million shares for the same period one year ago.
Year-to-Date Financial Results
Mr. Beckham concluded, “As a result of our strong year-to-date performance and expectations for the remainder of 2026, we are raising our full-year 2026 comparable store sales guidance to a range of 5.5% to 6.5%. We are also raising our full-year 2026 gross margin guidance to a range of 51.6% to 52.1% and our operating profit guidance to a range of 19.5% to 20.0%. These updates incorporate our strong third quarter performance, including the benefit from tariff refunds, and our margin expectations for the fourth quarter. Year-to-date, we have opened 173 net, new stores across North America and are on track to reach our goal of 225 to 235 net, new store openings in 2026. We remain very pleased with our new store performance and confident in the strength of the fundamental demand drivers in our business.”
Sales for the first nine months of 2026 increased $1.21 billion, or 9%, to $14.57 billion from $13.37 billion for the same period one year ago. Gross profit for the first nine months of 2026 increased 10% to $7.55 billion (or 51.8% of sales) from $6.89 billion (or 51.5% of sales) for the same period one year ago. SG&A expenses for the first nine months of 2026 increased 9% to $4.62 billion (or 31.7% of sales) from $4.26 billion (or 31.8% of sales) for the same period one year ago. Operating income for the first nine months of 2026 increased 11% to $2.93 billion (or 20.1% of sales) from $2.63 billion (or 19.7% of sales) for the same period one year ago.
Net income for the first nine months of 2026 increased $172 million, or 9%, to $2.10 billion (or 14.4% of sales) from $1.93 billion (or 14.5% of sales) for the same period one year ago. Diluted earnings per common share for the first nine months of 2026 increased 13% to $2.54 on 828 million shares versus $2.25 on 858 million shares for the same period one year ago.
3rd****Quarter Comparable Store Sales Results
Comparable store sales are calculated based on the change in sales for U.S. stores open at least one year and exclude sales of specialty machinery, sales to independent parts stores, and sales to Team Members. Online sales for ship-to-home orders and pick-up-in-store orders for U.S. stores open at least one year are included in the comparable store sales calculation. Comparable store sales increased 7.2% for the third quarter ended September 30, 2026, on top of 5.6% for the same period one year ago. Comparable store sales increased 7.1% for the nine months ended September 30, 2026, on top of 4.5% for the same period one year ago.
Share Repurchase Program
During the third quarter ended September 30, 2026, the Company repurchased 11.8 million shares of its common stock, at an average price per share of $87.34, for a total investment of $1.03 billion. During the first nine months of 2026, the Company repurchased 38.5 million shares of its common stock, at an average price per share of $89.99, for a total investment of $3.47 billion. Excise tax on shares repurchased, assessed at one percent of the fair market value of shares repurchased, was $34.7 million for the nine months ended September 30, 2026. Subsequent to the end of the third quarter and through the date of this release, the Company repurchased an additional 2.3 million shares of its common stock, at an average price per share of $87.11, for a total investment of $204 million. The Company has repurchased a total of 1.50 billion shares of its common stock under its share repurchase program since the inception of the program in January of 2011 and through the date of this release, at an average price of $20.63, for a total aggregate investment of $31.02 billion. As of the date of this release, the Company had approximately $727 million remaining under its current share repurchase authorization.
Updated Full-Year 2026 Guidance
The table below outlines the Company’s updated guidance for selected full-year 2026 financial data:
| | | |
| | | For the Year Ending |
| | | December 31, 2026 |
| Net, new store openings | | 225 to 235 |
| Comparable store sales | | 5.5% to 6.5% |
| Total revenue | | $19.0 billion to $19.3 billion |
| Gross profit as a percentage of sales | | 51.6% to 52.1% |
| Operating income as a percentage of sales | | 19.5% to 20.0% |
| Effective income tax rate | | 22.7 | % |
| Diluted earnings per share (1) | | $3.25 to $3.35 |
| Net cash provided by operating activities | | $3.2 billion to $3.6 billion |
| Capital expenditures | | $1.3 billion to $1.4 billion |
| Free cash flow (2) | | $1.9 billion to $2.2 billion |
| (1) | Weighted-average shares outstanding, assuming dilution, used in the denominator of this calculation, includes share repurchases made by the Company through the date of this release. |
| (2) | Free cash flow is a non-GAAP financial measure. The table below reconciles Free cash flow guidance to Net cash provided by operating activities guidance, the most directly comparable GAAP financial measure: |
| | | | | | | | | | | |
| | | | For the Year Ending |
| | (in millions) | | December 31, 2026 |
| | Net cash provided by operating activities | | $ | 3,210 | | to | | $ | 3,620 |
| | Less: | Capital expenditures | | | 1,300 | | to | | | 1,400 |
| | | Excess tax benefit from share-based compensation payments | | | 10 | | to | | | 20 |
| | Free cash flow | | $ | 1,900 | | to | | $ | 2,200 |
Non-GAAP Information
This release contains certain financial information not derived in accordance with United States generally accepted accounting principles (“GAAP”). These items include adjusted debt to earnings before interest, taxes, depreciation, amortization, share-based compensation, and rent (“EBITDAR”) and free cash flow. The Company does not, nor does it suggest investors should, consider such non-GAAP financial measures in isolation from, or as a substitute for, GAAP financial information. The Company believes that the presentation of adjusted debt to EBITDAR and free cash flow provide meaningful supplemental information to both management and investors that is indicative of the Company’s core operations. The Company has included a reconciliation of this additional information to the most comparable GAAP measure in the table above and the selected financial information below.
Earnings Conference Call Information
The Company will host a conference call on Thursday, October 29, 2026, at 10:00 a.m. Central Time to discuss its results as well as future expectations. Investors may listen to the conference call live on the Company’s website at www.OReillyAuto.com by clicking on “Investor Relations.” Interested analysts are invited to join the call. The dial-in number for the call is (888) 506-0062 and the conference call identification number is 479629. A replay of the conference call will be available on the Company’s website through Thursday, October 28, 2027.