November 2, 2026 at 4:10 PM EST PDF Version Earnings growth outpaces revenue growth by 4x year-over-year SCOTTSDALE, Ariz., Nov. 02, 2026 (GLOBE NEWSWIRE) -- onsemi (the “Company”) (Nasdaq: ON) today announced its third quarter 2026 results with…
November 2, 2026 at 4:10 PM EST
PDF Version
Earnings growth outpaces revenue growth by 4x year-over-year
SCOTTSDALE, Ariz., Nov. 02, 2026 (GLOBE NEWSWIRE) -- onsemi (the “Company”) (Nasdaq: ON) today announced its third quarter 2026 results with the following highlights:
-
Revenue of $1,722 million, increased 11% year-over-year
-
GAAP gross margin of 41.4% and non-GAAP gross margin of 41.2%
-
GAAP operating margin of 22.0% and non-GAAP operating margin 23.2%
-
GAAP diluted earnings per share of $0.79 and non-GAAP diluted earnings per share $0.90
-
Cash from operations increased by 23% year-over-year to $516 million
-
Free cash flow of $489 million, grew 31% year-over-year to 28% of revenue
“Increasing power requirements are driving accelerated demand in our AI data center and industrial end markets, as customers adopt and ramp our differentiated products,” said Hassane El-Khoury, President and CEO of onsemi. “Our third quarter revenue, gross margin and earnings per share exceeded the midpoint of our guidance, while AI data center revenue grew 39% sequentially and 175% year-over-year.”
“Gross margin expanded for the fifth consecutive quarter, increasing 190 basis points sequentially. Our results continue to demonstrate the operating leverage in our model, with earnings per share growing more than 40% year-over-year on 11% revenue growth,” said Thad Trent, EVP and CFO of onsemi. “As we execute our ongoing fab right initiatives and ramp new differentiated products, we are driving further margin and earnings expansion, positioning onsemi for durable, profitable growth.”
Business Highlights:
-
Announced an agreement to acquire Ferric, establishing onsemi as a leader in next generation AI processor power delivery and raising the AI data center 2030 revenue target by $500 million to greater than $3 billion
-
Announced revised terms for planned acquisition of Synaptics, for approximately $5.7 billion in cash compared to $7 billion in stock for the prior agreement, which should make the transaction immediately accretive to non-GAAP EPS
-
Entered into a strategic technology engagement with Subaru for early access to the newly introduced Embedded Power Platform (EPP),a breakthrough power architecture integrating heterogeneous technologies
-
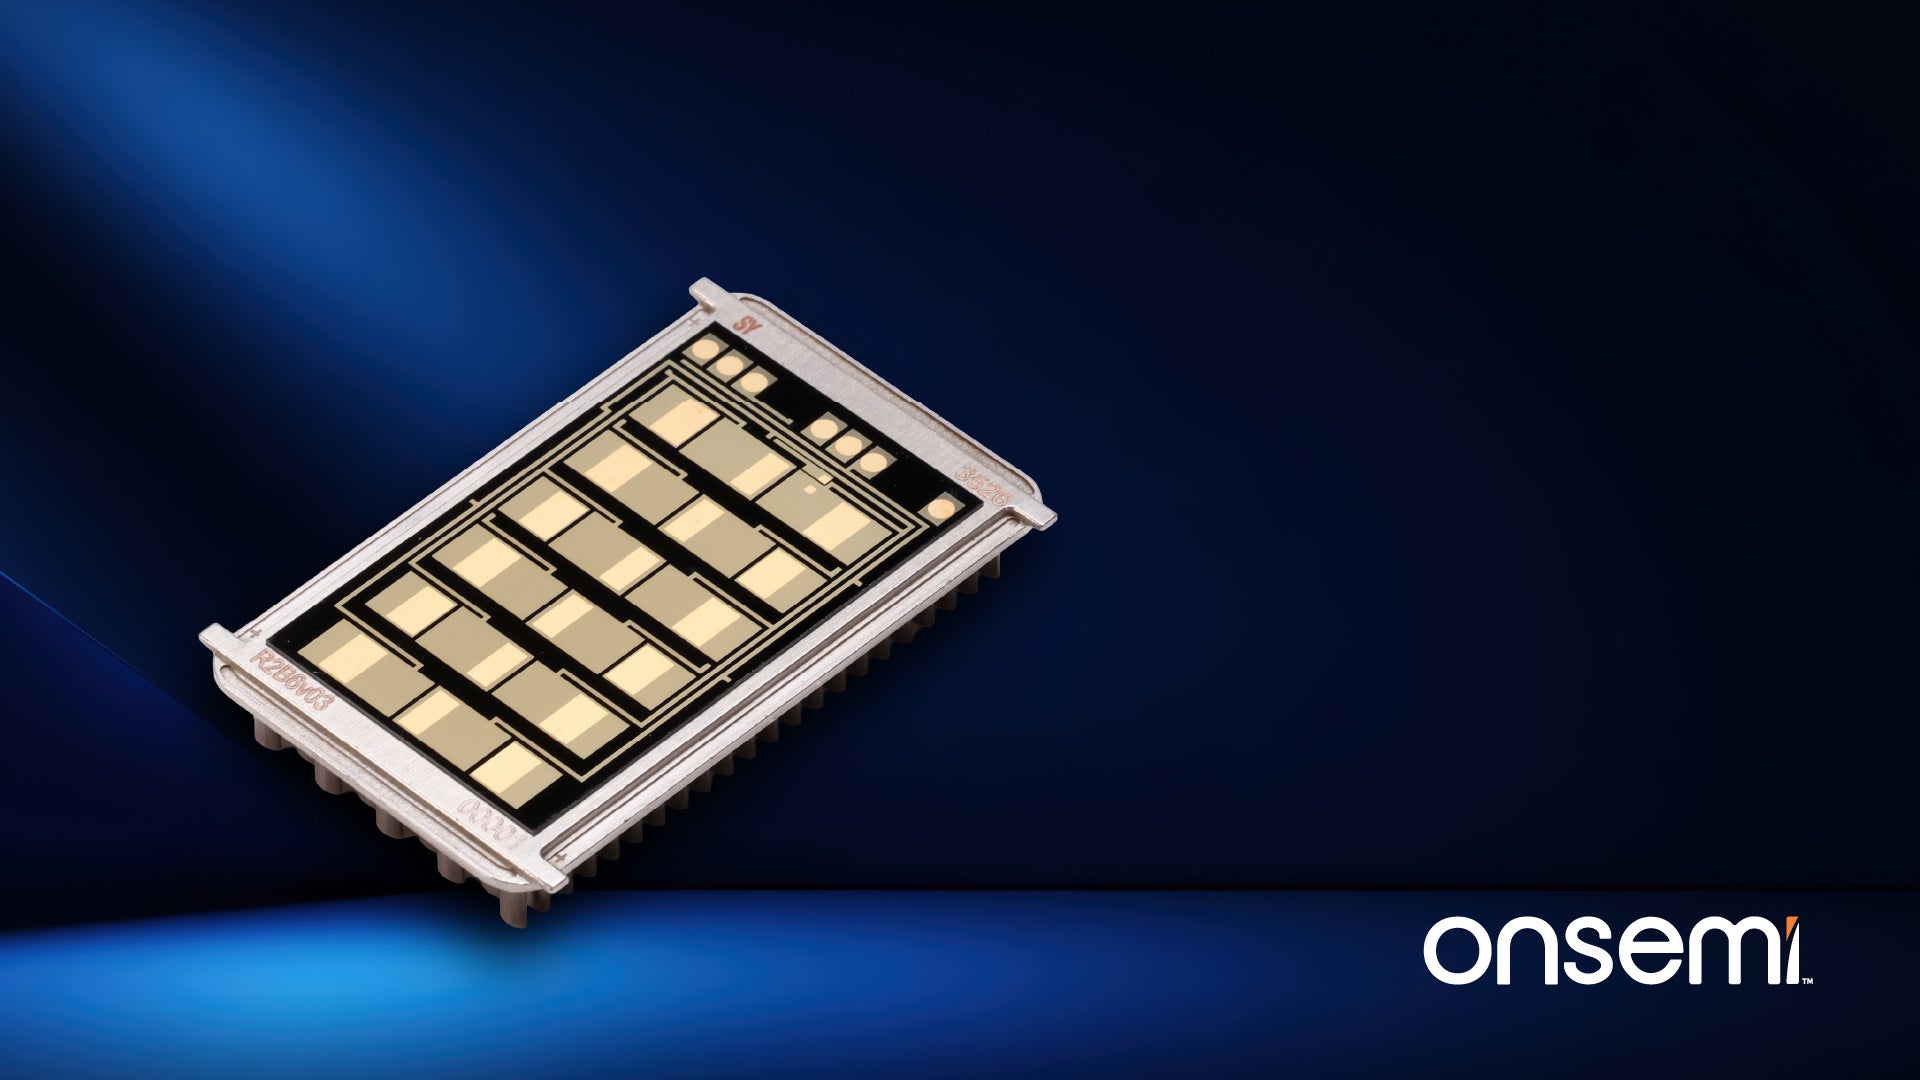
Sungrow adopted onsemi’s latest EliteSiC silicon carbide (SiC) hybrid power module technology which helps energy providers meet growing electricity demand from AI, renewable energy and electrification
Selected financial results for the quarter are shown below with comparable periods (unaudited):
| | GAAP | | Non-GAAP |
| (Revenue and Net Income in millions) | Q3 2026 | | Q2 2026 | | Q3 2025 | | | Q3 2026 | | Q2 2026 | | Q3 2025 | |
| Revenue | $ | 1,722.3 | | $ | 1,603.5 | | $ | 1,550.9 | | | $ | 1,722.3 | | $ | 1,603.5 | | $ | 1,550.9 | |
| Gross Margin | | 41.4 | % | | 38.4 | % | | 37.9 | % | | | 41.2 | % | | 39.3 | % | | 38.0 | % |
| Operating Margin | | 22.0 | % | | 16.1 | % | | 17.0 | % | | | 23.2 | % | | 20.8 | % | | 19.2 | % |
| Net Income attributable to ON Semiconductor Corporation | $ | 313.9 | | $ | 226.8 | | $ | 255.0 | | | $ | 354.0 | | $ | 293.8 | | $ | 256.3 | |
| Diluted Earnings Per Share | $ | 0.79 | | $ | 0.56 | | $ | 0.63 | | | $ | 0.90 | | $ | 0.74 | | $ | 0.63 | |
| | | | | | | | | | | | | | | | | | | | |
Revenue Summary
(in millions)
(Unaudited)
| | Quarters Ended | | | |
| Business Segment | Q3 2026 | Q2 2026 | Q3 2025 | | Sequential Change | Year-over- Year Change |
| PSG | $ | 889.9 | $ | 829.0 | $ | 737.6 | | 7% | 21% |
| AMG | | 597.3 | | 545.7 | | 583.3 | | 9% | 2% |
| ISG | | 235.1 | | 228.8 | | 230.0 | | 3% | 2% |
| Total | $ | 1,722.3 | $ | 1,603.5 | $ | 1,550.9 | | 7% | 11% |
FOURTH QUARTER2026OUTLOOK
The following table outlines onsemi’s projected fourth quarter of 2026 GAAP and non-GAAP outlook.
| | Total onsemi GAAP | Special Items ** | Total onsemi Non-GAAP*** |
| Revenue | $1,715 to $1,815 million | - | $1,715 to $1,815 million |
| Gross Margin | 41.4% to 43.4% | 0.1% | 41.5% to 43.5% |
| Operating Expenses | $331 to $346 million | $29 million | $303 to $318 million |
| Other Income and Expense (including interest), net | ($27 million) | - | ($27 million) |
| Diluted Earnings Per Share | $0.88 to $1.00 | $0.07 | $0.95 to $1.07 |
| Diluted Shares Outstanding * | 397 million | 5 million | 392 million |
| * | Diluted shares outstanding can vary as a result of, among other things, the vesting of restricted stock units, the incremental dilutive shares from the convertible notes, and the repurchase or the issuance of stock or convertible notes or the sale of treasury shares. In periods when the quarterly average stock price per share exceeds $52.97 for the 0% Convertible Senior Notes due 2027 (the “0% Notes”), $103.87 for the 0.50% Convertible Senior Notes due 2029 (the “0.50% Notes”), and $161.30 for the 0% Convertible Senior Notes due 2031 (the “2031 0% Notes”), the non-GAAP diluted share count and non-GAAP net income per share include the anti-dilutive impact of the hedge transactions entered concurrently with the 0% Notes, the 0.50% Notes, and the 2031 0% Notes, respectively. At an average stock price per share between $52.97 and $74.34 for the 0% Notes, $103.87 and $156.78 for the 0.50% Notes, and $161.30 and $211.54 for the 2031 0% Notes, the hedging activity offsets the potentially dilutive effect of the 0% Notes, the 0.50% Notes, and the 2031 0% Notes, respectively. In periods when the quarterly average stock price exceeds $74.34 for the 0% Notes, $156.78 for the 0.50% Notes, and $211.54 for the 2031 0% Notes, the dilutive impact of the warrants issued concurrently with such notes is included in the diluted shares outstanding. GAAP and non-GAAP diluted share counts are based on either the previous quarter's average stock price or the stock price as of the last day of the previous quarter, whichever is higher. |
| ** | Special items may include: amortization of acquisition-related intangibles; expensing of appraised inventory fair market value step-up; restructuring-related cost of revenue charges; non-recurring facility costs; in-process research and development expenses; restructuring, asset impairments and other, net; goodwill impairment charges; gains and losses on debt prepayment; actuarial (gains) losses on pension plans and other pension benefits; and certain other special items, as necessary. These special items are out of our control and could change significantly from period to period. As a result, we are not able to reasonably estimate and separately present the individual impact or probable significance of these special items, and we are similarly unable to provide a reconciliation of the non-GAAP measures. The reconciliation that is unavailable would include a forward-looking income statement, balance sheet and statement of cash flows in accordance with GAAP. For this reason, we use a projected range of the aggregate amount of special items in order to calculate our projected non-GAAP operating expense outlook. |
| *** | We believe these non-GAAP measures provide important supplemental information to investors. We use these measures, together with GAAP measures, for internal managerial purposes and as a means to evaluate period-to-period comparisons. However, we do not, and you should not, rely on non-GAAP financial measures alone as measures of our performance. We believe that non-GAAP financial measures reflect an additional way of viewing aspects of our operations that, when taken together with GAAP results and the reconciliations to corresponding GAAP financial measures that we also provide in our releases, provide a more complete understanding of factors and trends affecting our business. Because non-GAAP financial measures are not standardized, it may not be possible to compare these financial measures with other companies’ non-GAAP financial measures, even if they have similar names. |
TELECONFERENCE
onsemi will host a conference call for the financial community at 5 p.m. Eastern Time (ET) on November 2, 2026 to discuss this announcement and onsemi’s third quarter 2026 results. The Company will also provide a real-time audio webcast of the teleconference on the Investor Relations page of its website at http://www.onsemi.com. The webcast replay will be available at this site approximately one hour following the live broadcast and will continue to be available for approximately 30 days following the conference call. Investors and interested parties can also access the conference call by pre-registering here.
About onsemi
onsemi (Nasdaq: ON) delivers intelligent power and sensing technologies that enable electrification, energy efficiency, safety, and automation across automotive, industrial, and AI data center end-markets. With a highly differentiated and innovative product portfolio, onsemi helps customers solve complex challenges to achieve higher efficiency, improved performance, and lower system cost, while supporting a safer, cleaner, and more energy-efficient world. onsemiis part of the S&P 500® index. Learn more about onsemi at www.onsemi.com.
onsemi and the onsemi logo are trademarks of Semiconductor Components Industries, LLC. All other brand and product names appearing in this document are registered trademarks or trademarks of their respective holders. Although the Company references its website in this news release, information on the website is not to be incorporated herein.
| Krystal Heaton | | Parag Agarwal |
| Director, Head of Public Relations | | Vice President - Investor Relations & Corporate Development |
| onsemi | | onsemi |
| (480) 242-6943 | | (602) 244-3437 |
| [email protected] | | [email protected] |
This document includes “forward-looking statements,” as that term is defined in Section 27A of the Securities Act of 1933, as amended, and Section 21E of the Securities Exchange Act of 1934, as amended. All statements, other than statements of historical facts, included or incorporated in this document could be deemed forward-looking statements, particularly statements about the future financial performance of onsemi, including financial guidance for the fourth quarter of 2026. Forward-looking statements are often characterized by the use of words such as “believes,” “estimates,” “expects,” “projects,” “may,” “will,” “intends,” “plans,” “anticipates,” “should” or similar expressions or by discussions of strategy, plans or intentions. All forward-looking statements in this document are made based on our current expectations, forecasts, estimates and assumptions and involve risks, uncertainties and other factors that could cause results or events to differ materially from those expressed in the forward-looking statements. Certain factors that could affect our future results or events are described under Part I, Item 1A “Risk Factors” in the 2025 Annual Report on Form 10-K filed with the Securities and Exchange Commission (“SEC”) on February 9, 2026 (the “2025 Form 10-K”) and from time to time in our other SEC reports. Readers are cautioned not to place undue reliance on forward-looking statements. We assume no obligation to update such information, which speaks only as of the date made, except as may be required by law. Investing in our securities involves a high degree of risk and uncertainty, and you should carefully consider the trends, risks and uncertainties described in this document, our 2025 Form 10-K and other reports filed with or furnished to the SEC before making any investment decision with respect to our securities. If any of these trends, risks or uncertainties actually occurs or continues, our business, financial condition or operating results could be materially adversely affected, the trading prices of our securities could decline, and you could lose all or part of your investment. All forward-looking statements attributable to us or persons acting on our behalf are expressly qualified in their entirety by this cautionary statement.
| ON SEMICONDUCTOR CORPORATION |
| |
| UNAUDITED CONSOLIDATED STATEMENTS OF OPERATIONS |
| |
| (in millions, except per share and percentage data) |
| |
| | Quarters Ended | | Nine Months Ended |
| | October 2, 2026 | | July 3, 2026 | | October 3, 2025 | | October 2, 2026 | | October 3, 2025 |
| Revenue | $ | 1,722.3 | | | $ | 1,603.5 | | | $ | 1,550.9 | | | $ | 4,839.1 | | | $ | 4,465.3 | |
| Cost of revenue | | 1,009.3 | | | | 987.2 | | | | 963.7 | | | | 2,926.7 | | | | 3,032.4 | |
| Gross profit | | 713.0 | | | | 616.3 | | | | 587.2 | | | | 1,912.4 | | | | 1,432.9 | |
| Gross margin | | 41.4 | % | | | 38.4 | % | | | 37.9 | % | | | 39.5 | % | | | 32.1 | % |
| Operating expenses: | | | | | | | | | |
| Research and development | | 145.0 | | | | 140.8 | | | | 141.9 | | | | 430.1 | | | | 449.8 | |
| Selling and marketing | | 66.8 | | | | 63.3 | | | | 62.8 | | | | 193.1 | | | | 194.4 | |
| General and administrative | | 107.8 | | | | 101.9 | | | | 87.3 | | | | 299.1 | | | | 262.9 | |
| Amortization of intangible assets | | 10.5 | | | | 10.5 | | | | 11.2 | | | | 31.5 | | | | 33.6 | |
| Restructuring, asset impairments and other, net | | 4.6 | | | | 41.2 | | | | 19.6 | | | | 375.1 | | | | 608.1 | |
| Total operating expenses | | 334.7 | | | | 357.7 | | | | 322.8 | | | | 1,328.9 | | | | 1,548.8 | |
| Operating income (loss) | | 378.3 | | | | 258.6 | | | | 264.4 | | | | 583.5 | | | | (115.9 | ) |
| Other income (expense), net: | | | | | | | | | |
| Interest expense | | (13.9 | ) | | | (13.7 | ) | | | (17.7 | ) | | | (40.3 | ) | | | (53.6 | ) |
| Interest income | | 17.3 | | | | 17.4 | | | | 22.7 | | | | 52.4 | | | | 74.5 | |
| Other income | | 17.6 | | | | 8.6 | | | | 3.6 | | | | 30.0 | | | | 9.2 | |
| Other income (expense), net | | 21.0 | | | | 12.3 | | | | 8.6 | | | | 42.1 | | | | 30.1 | |
| Income (loss) before income taxes | | 399.3 | | | | 270.9 | | | | 273.0 | | | | 625.6 | | | | (85.8 | ) |
| Income tax (provision) benefit | | (84.9 | ) | | | (43.4 | ) | | | (17.7 | ) | | | (116.6 | ) | | | 27.6 | |
| Net income (loss) | | 314.4 | | | | 227.5 | | | | 255.3 | | | | 509.0 | | | | (58.2 | ) |
| Less: Net income attributable to non-controlling interest | | (0.5 | ) | | | (0.7 | ) | | | (0.3 | ) | | | (1.7 | ) | | | (2.6 | ) |
| Net income (loss) attributable to ON Semiconductor Corporation | $ | 313.9 | | | $ | 226.8 | | | $ | 255.0 | | | $ | 507.3 | | | $ | (60.8 | ) |
| | | | | | | | | | |
| Net income (loss) per share of common stock attributable to ON Semiconductor Corporation: | | | | | | | | | |
| Basic | $ | 0.81 | | | $ | 0.58 | | | $ | 0.63 | | | $ | 1.30 | | | $ | (0.15 | ) |
| Diluted | $ | 0.79 | | | $ | 0.56 | | | $ | 0.63 | | | $ | 1.27 | | | $ | (0.15 | ) |
| Weighted average common shares outstanding: | | | | | | | | | |
| Basic | | 389.3 | | | | 390.3 | | | | 406.9 | | | | 391.2 | | | | 414.3 | |
| Diluted | | 397.3 | | | | 404.4 | | | | 408.0 | | | | 400.0 | | | | 414.3 | |
| | | | | | | | | | | | | | | | | | | | |
| ON SEMICONDUCTOR CORPORATION |
| |
| UNAUDITED CONSOLIDATED BALANCE SHEETS |
| |
| (in millions) |
| |
| | October 2, 2026 | | July 3, 2026 | | December 31, 2025 |
| Assets | | | | | |
| Cash and cash equivalents | $ | 4,157.7 | | | $ | 3,514.5 | | | $ | 2,147.6 | |
| Short-term investments | | 210.0 | | | | 350.0 | | | | 400.0 | |
| Receivables, net | | 917.4 | | | | 897.2 | | | | 908.0 | |
| Inventories | | 2,069.7 | | | | 2,047.5 | | | | 1,989.6 | |
| Assets held-for-sale | | 26.2 | | | | 31.4 | | | | 25.0 | |
| Other current assets | | 464.3 | | | | 441.2 | | | | 352.9 | |
| Total current assets | | 7,845.3 | | | | 7,281.8 | | | | 5,823.1 | |
| Property, plant and equipment, net | | 2,823.7 | | | | 2,924.9 | | | | 3,369.0 | |
| Goodwill | | 1,686.5 | | | | 1,687.6 | | | | 1,679.9 | |
| Intangible assets, net | | 317.7 | | | | 329.4 | | | | 343.9 | |
| Deferred tax assets | | 1,018.1 | | | | 1,014.3 | | | | 929.1 | |
| ROU financing lease assets | | — | | | | — | | | | 23.1 | |
| Other assets | | 240.0 | | | | 247.1 | | | | 356.0 | |
| Total assets | $ | 13,931.3 | | | $ | 13,485.1 | | | $ | 12,524.1 | |
| Liabilities and Stockholders’ Equity | | | | | |
| Accounts payable | $ | 549.5 | | | $ | 498.3 | | | $ | 572.3 | |
| Accrued expenses and other current liabilities | | 858.3 | | | | 801.0 | | | | 714.9 | |
| Current portion of financing lease liabilities | | 0.6 | | | | 0.5 | | | | 0.5 | |
| Current portion of long-term debt | | 802.8 | | | | 802.1 | | | | — | |
| Total current liabilities | | 2,211.2 | | | | 2,101.9 | | | | 1,287.7 | |
| Long-term debt | | 3,660.2 | | | | 3,657.3 | | | | 2,980.5 | |
| Deferred tax liabilities | | 46.4 | | | | 46.8 | | | | 41.7 | |
| Long-term financing lease liabilities | | 22.3 | | | | 22.8 | | | | 23.8 | |
| Other long-term liabilities | | 409.8 | | | | 417.8 | | | | 498.5 | |
| Total liabilities | | 6,349.9 | | | | 6,246.6 | | | | 4,832.2 | |
| ON Semiconductor Corporation stockholders’ equity: | | | | | |
| Common stock | | 6.3 | | | | 6.3 | | | | 6.2 | |
| Additional paid-in capital | | 5,676.5 | | | | 5,632.8 | | | | 5,538.6 | |
| Accumulated other comprehensive loss | | (57.6 | ) | | | (67.1 | ) | | | (55.5 | ) |
| Accumulated earnings | | 8,749.2 | | | | 8,435.3 | | | | 8,241.9 | |
| Less: Treasury stock, at cost | | (6,813.3 | ) | | | (6,788.6 | ) | | | (6,057.9 | ) |
| Total ON Semiconductor Corporation stockholders’ equity | | 7,561.1 | | | | 7,218.7 | | | | 7,673.3 | |
| Non-controlling interest | | 20.3 | | | | 19.8 | | | | 18.6 | |
| Total stockholders’ equity | | 7,581.4 | | | | 7,238.5 | | | | 7,691.9 | |
| Total liabilities and stockholders’ equity | $ | 13,931.3 | | | $ | 13,485.1 | | | $ | 12,524.1 | |
| | | | | | | | | | | | |
| ON SEMICONDUCTOR CORPORATION |
| |
| UNAUDITED CONSOLIDATED STATEMENTS OF CASH FLOWS |
| |
| (in millions) |
| |
| | Quarters Ended | | Nine Months Ended |
| | October 2, 2026 | | July 3, 2026 | | October 3, 2025 | | October 2, 2026 | | October 3, 2025 |
| Cash flows from operating activities: | | | | | | | | | |
| Net income (loss) | $ | 314.4 | | | $ | 227.5 | | | $ | 255.3 | | | $ | 509.0 | | | $ | (58.2 | ) |
| Adjustments to reconcile net income (loss) to net cash provided by operating activities: | | | | | | | | | |
| Depreciation and amortization | | 135.0 | | | | 141.3 | | | | 146.5 | | | | 563.0 | | | | 471.1 | |
| Gain on sale and disposal of fixed assets | | (2.8 | ) | | | (0.3 | ) | | | (1.3 | ) | | | (4.2 | ) | | | (7.1 | ) |
| Gain on divestiture of a business | | (3.1 | ) | | | — | | | | — | | | | (3.1 | ) | | | — | |
| Amortization of debt discount and issuance costs | | 4.3 | | | | 3.8 | | | | 2.9 | | | | 11.0 | | | | 8.6 | |
| Share-based compensation | | 37.1 | | | | 37.4 | | | | 38.2 | | | | 111.8 | | | | 106.5 | |
| Non-cash asset impairment charges | | 3.3 | | | | 16.3 | | | | 15.8 | | | | 166.6 | | | | 487.9 | |
| Change in deferred tax balances | | (7.1 | ) | | | (12.8 | ) | | | (80.9 | ) | | | (17.2 | ) | | | (113.1 | ) |
| Other | | (3.2 | ) | | | 1.9 | | | | (3.1 | ) | | | (3.5 | ) | | | 1.2 | |
| Changes in assets and liabilities | | 38.5 | | | | 44.6 | | | | 45.3 | | | | (118.2 | ) | | | 308.4 | |
| Net cash provided by operating activities | | 516.4 | | | | 459.7 | | | | 418.7 | | | | 1,215.2 | | | | 1,205.3 | |
| Cash flows from investing activities: | | | | | | | | | |
| Payments for acquisition of property, plant, and equipment | | (27.8 | ) | | | (34.3 | ) | | | (46.3 | ) | | | (84.0 | ) | | | (272.1 | ) |
| Proceeds from sale of property, plant and equipment | | 8.5 | | | | 7.6 | | | | 0.1 | | | | 17.1 | | | | 6.8 | |
| Proceeds related to divestiture of businesses, net of cash transferred | | 31.7 | | | | — | | | | — | | | | 31.7 | | | | — | |
| Purchase of short-term investments | | (110.0 | ) | | | (350.0 | ) | | | (250.0 | ) | | | (760.0 | ) | | | (800.0 | ) |
| Proceeds from the maturity of short-term investments | | 250.0 | | | | 400.0 | | | | 150.0 | | | | 950.0 | | | | 700.0 | |
| Payments for acquisition of a business, net of cash acquired | | — | | | | (13.0 | ) | | | — | | | | (13.0 | ) | | | (117.5 | ) |
| Other | | 1.7 | | | | (3.0 | ) | | | (5.0 | ) | | | 2.9 | | | | (5.0 | ) |
| Net cash provided by (used in) investing activities | | 154.1 | | | | 7.3 | | | | (151.2 | ) | | | 144.7 | | | | (487.8 | ) |
| Cash flows from financing activities: | | | | | | | | | |
| Proceeds for common stock issuance under the ESPP | | 6.6 | | | | 5.3 | | | | 6.0 | | | | 18.6 | | | | 16.6 | |
| Payment of tax withholding for RSUs | | (6.5 | ) | | | (18.6 | ) | | | (2.4 | ) | | | (52.0 | ) | | | (27.5 | ) |
| Repurchase of common stock | | (19.9 | ) | | | (344.8 | ) | | | (325.0 | ) | | | (710.4 | ) | | | (927.4 | ) |
| Issuance and borrowings under debt agreements | | — | | | | 1,473.7 | | | | — | | | | 1,473.7 | | | | — | |
| Reimbursement of debt issuance and other financing costs | | — | | | | 3.4 | | | | — | | | | 3.4 | | | | — | |
| Payment of debt issuance and other financing costs | | — | | | | (4.2 | ) | | | — | | | | (4.2 | ) | | | — | |
| Repayment of borrowings under debt agreements | | (0.2 | ) | | | — | | | | — | | | | (0.2 | ) | | | — | |
| Payment for purchase of bond hedges | | — | | | | (351.6 | ) | | | — | | | | (351.6 | ) | | | — | |
| Proceeds from issuance of warrants | | — | | | | 281.0 | | | | — | | | | 281.0 | | | | — | |
| Payment of finance lease obligations | | (0.1 | ) | | | (0.1 | ) | | | (0.4 | ) | | | (0.3 | ) | | | (1.2 | ) |
| Payments related to prior business acquisitions | | (7.5 | ) | | | — | | | | (0.4 | ) | | | (7.5 | ) | | | (0.4 | ) |
| Net cash provided by (used in) financing activities | | (27.6 | ) | | | 1,044.1 | | | | (322.2 | ) | | | 650.5 | | | | (939.9 | ) |
| Effect of exchange rate changes on cash, cash equivalents and restricted cash | | 0.3 | | | | (0.3 | ) | | | (0.9 | ) | | | (0.3 | ) | | | 3.0 | |
| Net increase (decrease) in cash, cash equivalents and restricted cash | | 643.2 | | | | 1,510.8 | | | | (55.6 | ) | | | 2,010.1 | | | | (219.4 | ) |
| Beginning cash, cash equivalents and restricted cash | | 3,515.9 | | | | 2,005.1 | | | | 2,529.6 | | | | 2,149.0 | | | | 2,693.4 | |
| Ending cash, cash equivalents and restricted cash | $ | 4,159.1 | | | $ | 3,515.9 | | | $ | 2,474.0 | | | $ | 4,159.1 | | | $ | 2,474.0 | |
| | | | | | | | | | | | | | | | | | | | |
| ON SEMICONDUCTOR CORPORATION |
| |
| RECONCILIATION OF GAAP VERSUS NON-GAAP DISCLOSURES |
| |
| (in millions, except per share and percentage data) |
| |
| | | Quarters Ended | | Nine Months Ended |
| | | October 2, 2026 | | July 3, 2026 | | October 3, 2025 | | October 2, 2026 | | October 3, 2025 |
| Reconciliation of GAAP to non-GAAP gross profit: | | | | | | | | | |
| GAAP gross profit | $ | 713.0 | | | $ | 616.3 | | | $ | 587.2 | | | $ | 1,912.4 | | | $ | 1,432.9 | |
| Special items: | | | | | | | | | |
| a) | Restructuring-related inventory and other charges | | (4.9 | ) | | | 13.4 | | | | — | | | | 7.5 | | | | 281.5 | |
| b) | Amortization of intangible assets | | 1.2 | | | | 1.2 | | | | 1.2 | | | | 3.6 | | | | 3.8 | |
| c) | Amortization of fair market value step-up of inventory | | — | | | | — | | | | 0.6 | | | | — | | | | 1.8 | |
| | Total special items | | (3.7 | ) | | | 14.6 | | | | 1.8 | | | | 11.1 | | | | 287.1 | |
| Non-GAAP gross profit | $ | 709.3 | | | $ | 630.9 | | | $ | 589.0 | | | $ | 1,923.5 | | | $ | 1,720.0 | |
| Reconciliation of GAAP to non-GAAP gross margin: | | | | | | | | | |
| GAAP gross margin | | 41.4 | % | | | 38.4 | % | | | 37.9 | % | | | 39.5 | % | | | 32.1 | % |
| Special items: | | | | | | | | | |
| a) | Restructuring-related inventory and other charges | (0.3) % | | | 0.8 | % | | | — | % | | | 0.2 | % | | | 6.3 | % |
| b) | Amortization of intangible assets | | 0.1 | % | | | 0.1 | % | | | 0.1 | % | | | 0.1 | % | | | 0.1 | % |
| c) | Amortization of fair market value step-up of inventory | | — | % | | | — | % | | | — | % | | | — | % | | | — | % |
| | Total special items | (0.2) % | | | 0.9 | % | | | 0.1 | % | | | 0.3 | % | | | 6.4 | % |
| Non-GAAP gross margin | | 41.2 | % | | | 39.3 | % | | | 38.0 | % | | | 39.7 | % | | | 38.5 | % |
| Reconciliation of GAAP to non-GAAP operating expenses: | | | | | | | | | |
| GAAP operating expenses | $ | 334.7 | | | $ | 357.7 | | | $ | 322.8 | | | $ | 1,328.9 | | | $ | 1,548.8 | |
| Special items: | | | | | | | | | |
| a) | Amortization of intangible assets | | (10.5 | ) | | | (10.5 | ) | | | (11.2 | ) | | | (31.5 | ) | | | (33.6 | ) |
| b) | Restructuring, asset impairments and other, net | | (4.6 | ) | | | (41.2 | ) | | | (19.6 | ) | | | (375.1 | ) | | | (608.1 | ) |
| c) | Third-party acquisition and divestiture-related costs | | (7.5 | ) | | | (7.6 | ) | | | (0.8 | ) | | | (16.5 | ) | | | (3.7 | ) |
| d) | Adjustments related to contingent consideration | | (2.6 | ) | | | (1.6 | ) | | | — | | | | (5.8 | ) | | | — | |
| | Total special items | | (25.2 | ) | | | (60.9 | ) | | | (31.6 | ) | | | (428.9 | ) | | | (645.4 | ) |
| Non-GAAP operating expenses | $ | 309.5 | | | $ | 296.8 | | | $ | 291.2 | | | $ | 900.0 | | | $ | 903.4 | |
| Reconciliation of GAAP to non-GAAP operating income: | | | | | | | | | |
| GAAP operating income (loss) | $ | 378.3 | | | $ | 258.6 | | | $ | 264.4 | | | $ | 583.5 | | | $ | (115.9 | ) |
| Special items: | | | | | | | | | |
| a) | Restructuring-related inventory and other charges | | (4.9 | ) | | | 13.4 | | | | — | | | | 7.5 | | | | 281.5 | |
| b) | Amortization of intangible assets | | 11.7 | | | | 11.7 | | | | 12.4 | | | | 35.1 | | | | 37.4 | |
| c) | Restructuring, asset impairments and other, net | | 4.6 | | | | 41.2 | | | | 19.6 | | | | 375.1 | | | | 608.1 | |
| d) | Third-party acquisition and divestiture-related costs | | 7.5 | | | | 7.6 | | | | 0.8 | | | | 16.5 | | | | 3.7 | |
| e) | Amortization of fair market value step-up of inventory | | — | | | | — | | | | 0.6 | | | | — | | | | 1.8 | |
| f) | Adjustments related to contingent consideration | | 2.6 | | | | 1.6 | | | | — | | | | 5.8 | | | | — | |
| | Total special items | | 21.5 | | | | 75.5 | | | | 33.4 | | | | 440.0 | | | | 932.5 | |
| Non-GAAP operating income | $ | 399.8 | | | $ | 334.1 | | | $ | 297.8 | | | $ | 1,023.5 | | | $ | 816.6 | |
| Reconciliation of GAAP to non-GAAP operating margin**(operating income / revenue)****:** | | | | | | | | | |
| GAAP operating margin | | 22.0 | % | | | 16.1 | % | | | 17.0 | % | | | 12.1 | % | | (2.6) % |
| Special items: | | | | | | | | | |
| a) | Restructuring related inventory and other charges | (0.3) % | | | 0.8 | % | | | — | % | | | 0.2 | % | | | 6.3 | % |
| b) | Amortization of intangible assets | | 0.7 | % | | | 0.7 | % | | | 0.8 | % | | | 0.7 | % | | | 0.8 | % |
| c) | Restructuring, asset impairments and other, net | | 0.3 | % | | | 2.6 | % | | | 1.3 | % | | | 7.8 | % | | | 13.6 | % |
| d) | Third-party acquisition and divestiture-related costs | | 0.4 | % | | | 0.5 | % | | | 0.1 | % | | | 0.3 | % | | | 0.1 | % |
| e) | Amortization of fair market value step-up of inventory | | — | % | | | — | % | | | — | % | | | — | % | | | — | % |
| f) | Adjustments related to contingent consideration | | 0.2 | % | | | 0.1 | % | | | — | % | | | 0.1 | % | | | — | % |
| | Total special items | | 1.3 | % | | | 4.7 | % | | | 2.2 | % | | | 9.1 | % | | | 20.8 | % |
| Non-GAAP operating margin | | 23.2 | % | | | 20.8 | % | | | 19.2 | % | | | 21.2 | % | | | 18.3 | % |
| Reconciliation of GAAP to non-GAAP income before income taxes: | | | | | | | | | |
| GAAP income (loss) before income taxes | $ | 399.3 | | | $ | 270.9 | | | $ | 273.0 | | | $ | 625.6 | | | $ | (85.8 | ) |
| Special items: | | | | | | | | | |
| a) | Restructuring-related inventory and other charges | | (4.9 | ) | | | 13.4 | | | | — | | | | 7.5 | | | | 281.5 | |
| b) | Amortization of intangible assets | | 11.7 | | | | 11.7 | | | | 12.4 | | | | 35.1 | | | | 37.4 | |
| c) | Restructuring, asset impairments and other, net | | 4.6 | | | | 41.2 | | | | 19.6 | | | | 375.1 | | | | 608.1 | |
| d) | Third-party acquisition and divestiture-related costs | | 7.5 | | | | 7.6 | | | | 0.8 | | | | 16.5 | | | | 3.7 | |
| e) | Amortization of fair market value step-up of inventory | | — | | | | — | | | | 0.6 | | | | — | | | | 1.8 | |
| f) | Adjustments related to contingent consideration | | 2.6 | | | | 1.6 | | | | — | | | | 5.8 | | | | — | |
| g) | Actuarial gains on pension plans and other pension benefits | | (0.6 | ) | | | — | | | | — | | | | (0.6 | ) | | | — | |
| h) | Gain of divestiture of a business | | (3.1 | ) | | | — | | | | — | | | | (3.1 | ) | | | — | |
| | Total special items | | 17.8 | | | | 75.5 | | | | 33.4 | | | | 436.3 | | | | 932.5 | |
| Non-GAAP income before income taxes | $ | 417.1 | | | $ | 346.4 | | | $ | 306.4 | | | $ | 1,061.9 | | | $ | 846.7 | |
| Reconciliation of GAAP to non-GAAP net income attributable to ON Semiconductor Corporation: | | | | | | | | | |
| GAAP net income (loss) attributable to ON Semiconductor Corporation | $ | 313.9 | | | $ | 226.8 | | | $ | 255.0 | | | $ | 507.3 | | | $ | (60.8 | ) |
| Special items: | | | | | | | | | |
| a) | Restructuring-related inventory and other charges | | (4.9 | ) | | | 13.4 | | | | — | | | | 7.5 | | | | 281.5 | |
| b) | Amortization of intangible assets | | 11.7 | | | | 11.7 | | | | 12.4 | | | | 35.1 | | | | 37.4 | |
| c) | Restructuring, asset impairments and other, net | | 4.6 | | | | 41.2 | | | | 19.6 | | | | 375.1 | | | | 608.1 | |
| d) | Third-party acquisition and divestiture-related costs | | 7.5 | | | | 7.6 | | | | 0.8 | | | | 16.5 | | | | 3.7 | |
| e) | Amortization of fair market value step-up of inventory | | — | | | | — | | | | 0.6 | | | | — | | | | 1.8 | |
| f) | Adjustments related to contingent consideration | | 2.6 | | | | 1.6 | | | | — | | | | 5.8 | | | | — | |
| g) | Actuarial gains on pension plans and other pension benefits | | (0.6 | ) | | | — | | | | — | | | | (0.6 | ) | | | — | |
| h) | Gain of divestiture of a business | | (3.1 | ) | | | — | | | | — | | | | (3.1 | ) | | | — | |
| i) | Adjustment to income taxes | | 22.3 | | | | (8.5 | ) | | | (32.1 | ) | | | (42.7 | ) | | | (162.5 | ) |
| | Total special items | | 40.1 | | | | 67.0 | | | | 1.3 | | | | 393.6 | | | | 770.0 | |
| Non-GAAP net income attributable to ON Semiconductor Corporation | $ | 354.0 | | | $ | 293.8 | | | $ | 256.3 | | | $ | 900.9 | | | $ | 709.2 | |
| Reconciliation of GAAP to non-GAAP diluted shares outstanding: | | | | | | | | | |
| GAAP diluted shares outstanding | | 397.3 | | | | 404.4 | | | | 408.0 | | | | 400.0 | | | | 414.3 | |
| Special items: | | | | | | | | | |
| a) | Less: dilutive shares attributable to convertible notes | | (5.1 | ) | | | (7.4 | ) | | | — | | | | (5.0 | ) | | | — | |
| b) | Add: dilutive shares attributable to share-based awards | | — | | | | — | | | | — | | | | — | | | | 0.6 | |
| | Total special items | | (5.1 | ) | | | (7.4 | ) | | | — | | | | (5.0 | ) | | | 0.6 | |
| Non-GAAP diluted shares outstanding | | 392.2 | | | | 397.0 | | | | 408.0 | | | | 395.0 | | | | 414.9 | |
| Non-GAAP diluted earnings per share: | | | | | | | | | |
| Non-GAAP net income attributable to ON Semiconductor Corporation | $ | 354.0 | | | $ | 293.8 | | | $ | 256.3 | | | $ | 900.9 | | | $ | 709.2 | |
| Non-GAAP diluted shares outstanding | | 392.2 | | | | 397.0 | | | | 408.0 | | | | 395.0 | | | | 414.9 | |
| Non-GAAP diluted earnings per share | $ | 0.90 | | | $ | 0.74 | | | $ | 0.63 | | | $ | 2.28 | | | $ | 1.71 | |
| Reconciliation of net cash provided by operating activities to free cash flow: | | | | | | | | | |
| Net cash provided by operating activities | $ | 516.4 | | | $ | 459.7 | | | $ | 418.7 | | | $ | 1,215.2 | | | $ | 1,205.3 | |
| Special items: | | | | | | | | | |
| a) | Payments for acquisition of property, plant and equipment | | (27.8 | ) | | | (34.3 | ) | | | (46.3 | ) | | | (84.0 | ) | | | (272.1 | ) |
| | Total special items | | (27.8 | ) | | | (34.3 | ) | | | (46.3 | ) | | | (84.0 | ) | | | (272.1 | ) |
| Free cash flow | $ | 488.6 | | | $ | 425.4 | | | $ | 372.4 | | | $ | 1,131.2 | | | $ | 933.2 | |
Certain of the amounts in the above tables may not total due to rounding of individual amounts.
FREE CASH FLOW
| | Quarters Ended | | |
| | December 31, 2025 | | April 3, 2026 | | July 3, 2026 | | October 2, 2026 | | Last Twelve Months |
| Net cash provided by operating activities | $ | 554.5 | | | $ | 239.1 | | | $ | 459.7 | | | $ | 516.4 | | | $ | 1,769.7 | |
| Payments for acquisition of property, plant and equipment | | (69.1 | ) | | | (21.9 | ) | | | (34.3 | ) | | | (27.8 | ) | | | (153.1 | ) |
| Free cash flow | $ | 485.4 | | | $ | 217.2 | | | $ | 425.4 | | | $ | 488.6 | | | $ | 1,616.6 | |
| | | | | | | | | | |
| Revenue | $ | 1,530.1 | | | $ | 1,513.3 | | | $ | 1,603.5 | | | $ | 1,722.3 | | | $ | 6,369.2 | |
SHARE-BASED COMPENSATION
Total share-based compensation related to restricted stock units, stock grant awards and the employee stock purchase plan was as follows:
| | Quarters Ended | | Nine Months Ended |
| | October 2, 2026 | | July 3, 2026 | | October 3, 2025 | | October 2, 2026 | | October 3, 2025 |
| Cost of revenue | $ | 7.2 | | $ | 6.8 | | $ | 7.8 | | $ | 20.4 | | $ | 19.9 |
| Research and development | | 7.2 | | | 6.0 | | | 7.3 | | | 20.5 | | | 19.9 |
| Selling and marketing | | 4.8 | | | 4.8 | | | 5.7 | | | 14.7 | | | 15.3 |
| General and administrative | | 17.9 | | | 19.8 | | | 17.4 | | | 56.2 | | | 51.4 |
| Total share-based compensation | $ | 37.1 | | $ | 37.4 | | $ | 38.2 | | $ | 111.8 | | $ | 106.5 |
SUPPLEMENTAL FINANCIAL DATA
| | Quarters Ended | | Nine Months Ended |
| | October 2, 2026 | | July 3, 2026 | | October 3, 2025 | | October 2, 2026 | | October 3, 2025 |
| Net cash provided by operating activities | $ | 516.4 | | $ | 459.7 | | $ | 418.7 | | $ | 1,215.2 | | $ | 1,205.3 |
| Free cash flow | $ | 488.6 | | $ | 425.4 | | $ | 372.4 | | $ | 1,131.2 | | $ | 933.2 |
| Cash paid for income taxes | $ | 46.1 | | $ | 50.8 | | $ | 17.4 | | $ | 143.5 | | $ | 103.9 |
| | | | | | | | | | |
| Depreciation and amortization (1) | $ | 135.0 | | $ | 141.3 | | $ | 146.5 | | $ | 563.0 | | $ | 471.1 |
| Less: Amortization of intangible assets | | 11.7 | | | 11.7 | | | 12.4 | | | 35.1 | | | 37.4 |
| Depreciation and amortization (excl. amortization of intangible assets) (1) | $ | 123.3 | | $ | 129.6 | | $ | 134.1 | | $ | 527.9 | | $ | 433.7 |
| | | | | | | | | | |
| (1) Accelerated depreciation and amortization related to the 2025 and 2026 Manufacturing Realignment Programs | $ | — | | $ | — | | $ | 0.8 | | $ | 136.5 | | $ | 15.3 |
| | | | | | | | | | | | | | | |
NON-GAAP MEASURES
To supplement the consolidated financial results prepared in accordance with GAAP, onsemi uses certain non-GAAP measures, which are adjusted from the most directly comparable GAAP measures to exclude items related to the amortization of acquisition-related intangibles, restructuring-related cost of revenue charges, expensing of appraised inventory fair market value step-up, inventory valuation adjustments, in-process research and development expenses, restructuring, asset impairments and other, net, goodwill impairment charges, gains and losses on debt prepayment, non-cash interest expense, actuarial (gains) losses on pension plans and other pension benefits, third party acquisition and divestiture-related costs, tax impact of these items and certain other non-recurring items, as necessary. Management does not consider the effects of these items in evaluating the core operational activities of onsemi. Management uses these non-GAAP measures internally to make strategic decisions, forecast future results and evaluate onsemi’s current performance. In addition, the Company believes that most analysts covering onsemi use the non-GAAP measures to evaluate onsemi’s performance. Given management’s and other relevant parties’ use of these non-GAAP measures, onsemi believes these measures are important to investors in understanding onsemi’s current and future operating results as seen through the eyes of management. In addition, management believes these non-GAAP measures are useful to investors in enabling them to better assess changes in onsemi’s core business across different time periods. These non-GAAP measures are not prepared in accordance with, and should not be considered alternatives or necessarily superior to, GAAP financial data and may be different from non-GAAP measures used by other companies. Because non-GAAP financial measures are not standardized, it may not be possible to compare these financial measures with other companies’ non-GAAP financial measures, even if they have similar names.
Non-GAAP Gross Profit and Gross Margin
The use of non-GAAP gross profit and gross margin allows management to evaluate, among other things, the gross profit and gross margin of the Company’s core businesses and trends across different reporting periods on a consistent basis, independent of non-cash and non-recurring items including, generally speaking, restructuring-related cost of revenue charges, amortization of intangible assets, amortization of appraised inventory fair market value step-up, impact of business wind down and non-recurring facility costs. In addition, it is an important component of management’s internal performance measurement and incentive and reward process as it is used to assess the current and historical financial results of the business and for strategic decision making, preparing budgets, obtaining targets and forecasting future results. Management presents this non-GAAP financial measure to enable investors and analysts to evaluate our operating performance independent of certain non-cash items and the effects of certain variables unrelated to our overall operating performance.
Non-GAAP Operating Income and Operating Margin
The use of non-GAAP operating income and operating margin allows management to evaluate, among other things, the operating income and operating margin of the Company’s core businesses and trends across different reporting periods on a consistent basis, independent of non-cash and non-recurring items including, generally speaking, restructuring-related cost of revenue charges, expensing of appraised inventory fair market value step-up, impact of business wind down, non-recurring facility costs, amortization and impairments of intangible assets, third party acquisition and divestiture-related costs, restructuring charges, asset impairments and certain other special items as necessary. In addition, it is an important component of management’s internal performance measurement and incentive and reward process as it is used to assess the current and historical financial results of the business and for strategic decision making, preparing budgets, obtaining targets and forecasting future results. Management presents this non-GAAP financial measure to enable investors and analysts to evaluate our operating performance independent of certain non-cash items and the effects of certain variables unrelated to our overall operating performance.
Non-GAAP Net Income Attributable to ON Semiconductor Corporation and Non-GAAP Diluted Earnings Per Share
The use of non-GAAP net income attributable to ON Semiconductor Corporation and non-GAAP diluted earnings per share allows management to evaluate the operating results of onsemi’s core businesses and trends across different reporting periods on a consistent basis, independent of non-cash and non-recurring items including, generally, the restructuring related cost of revenue charges, amortization and impairments of intangible assets, expensing of appraised inventory fair market value step-up, impact of business wind down, non-recurring facility costs, restructuring, asset impairments, gains and losses on debt prepayment, actuarial (gains) losses on pension plans and other pension benefits, third party acquisition and divestiture-related costs, discrete tax items and other non-GAAP tax adjustments and certain other special items, as necessary. In addition, these measures are important components of management’s internal performance measurement and incentive and reward process, as they are used to assess the current and historical financial results of the business and for strategic decision making, preparing budgets, setting targets and forecasting future results. For our non-GAAP reporting we apply a projected, normalized non-GAAP effective tax rate of 15% for 2026 and 16% for 2025. We calculate this non-GAAP effective tax rate on an annual basis. We may update this non-GAAP effective tax rate at any time for a variety of reasons, including, but not limited to, the rapidly evolving global tax environment, significant changes in our geographic earnings mix or changes to our strategy or business operations. Management presents these non-GAAP financial measures to enable investors and analysts to understand the results of operations of onsemi’s core businesses and, to the extent comparable, to compare our results of operations on a more consistent basis against those of other companies in our industry.
Free Cash Flow
The use of free cash flow allows management to evaluate, among other things, the ability of the Company to make interest or principal payments on its debt. Free cash flow is defined as the difference between cash flow from operating activities and capital expenditures disclosed under investing activities in the consolidated statement of cash flows. Free cash flow is not an alternative to cash flow from operating activities as a measure of liquidity. It is an important component of management’s internal performance measurement and incentive and reward process as it is used to assess the current and historical financial results of the business and for strategic decision making, preparing budgets, obtaining targets and forecasting future results. Management presents this non-GAAP financial measure to enable investors and analysts to evaluate our financial performance independent of the cash capital expenditures.
Non-GAAP Diluted Share Count
The use of non-GAAP diluted share count allows management to evaluate, among other things, the potential dilution due to the outstanding restricted stock units excluding the dilution from the convertible notes that is covered by hedging activity up to a certain threshold. In periods when the quarterly average stock price per share exceeds $52.97 for the 0% Notes, $103.87 for the 0.50% Notes, and $161.30 for the 2031 0% Notes, the non-GAAP diluted share count includes the anti-dilutive impact of the Company’s hedge transactions issued concurrently with the 0% Notes, the 0.50% Notes, and the 2031 0% Notes, respectively. At an average stock price per share between $52.97 and $74.34 for the 0% Notes, $103.87 and $156.78 for the 0.50% Notes, and $161.30 and $211.54 for the 2031 0% Notes, the hedging activity offsets the potentially dilutive effect of the 0% Notes, the 0.50% Notes, and the 2031 0% Notes, respectively. In periods when the quarterly average stock price exceeds $74.34 for the 0% Notes, $156.78 for the 0.50% Notes, and $211.54 for the 2031 0% Notes, the dilutive impact of the warrants issued concurrently with such notes is included in the diluted shares outstanding.

More To Explore
Investor Contact
[email protected]
+1 (602) 244 3437
Parag Agarwal
Vice President, Investor Relations and Corporate Development
Matt Fahey
Senior Manager, Investor Relations and Corporate Development
Transfer Agent
Computershare Trust Company, N.A.
P.O. Box 30170
College Station, TX 77842-3170 USA
+1 (312) 360 5175
www.computershare.com/investor
Email Alerts
Stay Informed with Email Alerts
Sign Up
Hello, world! This is a toast message.
Hello, world! This is a toast message.

Privacy Preference Center
Your Opt Out Preference Signal is Honored
-
Your Privacy
-
Strictly Necessary Cookies
-
Functional Cookies
-
Targeting Cookies
-
Performance Cookies
Your Privacy
When you visit any website, it may store or retrieve information on your browser, mostly in the form of cookies. This information might be about you, your preferences or your device and is mostly used to make the site work as you expect it to. The information does not usually directly identify you, but it can give you a more personalized web experience. Because we respect your right to privacy, you can choose not to allow some types of cookies. Click on the different category headings to find out more and change our default settings. However, blocking some types of cookies may impact your experience of the site and the services we are able to offer.
More information
Strictly Necessary Cookies
Always Active
These cookies are necessary for the website to function and cannot be switched off in our systems. They are usually only set in response to actions made by you which amount to a request for services, such as setting your privacy preferences, logging in or filling in forms. You can set your browser to block or alert you about these cookies, but some parts of the site will not then work. These cookies do not store any personally identifiable information.
Functional Cookies
Functional Cookies
These cookies enable the website to provide enhanced functionality and personalisation. They may be set by us or by third party providers whose services we have added to our pages. If you do not allow these cookies then some or all of these services may not function properly.
Targeting Cookies
Targeting Cookies
These cookies may be set through our site by our advertising partners. They may be used by those companies to build a profile of your interests and show you relevant adverts on other sites. They do not store directly personal information, but are based on uniquely identifying your browser and internet device. If you do not allow these cookies, you will experience less targeted advertising.
Performance Cookies
Performance Cookies
These cookies allow us to count visits and traffic sources so we can measure and improve the performance of our site. They help us to know which pages are the most and least popular and see how visitors move around the site. All information these cookies collect is aggregated and therefore anonymous. If you do not allow these cookies we will not know when you have visited our site, and will not be able to monitor its performance.
Cookie List
Leg.Interest
checkbox label label
checkbox label label
checkbox label label
Clear
checkbox label label
Apply Cancel
Reject All Allow All