Nextdoor Holdings, Inc. operates a neighborhood social network platform that connects verified residents with local businesses, news publishers, and public agencies. The company provides a digital ecosystem for local engagement, featuring a personalized feed, real-time safety alerts, local news aggregation, and a marketplace for buying, selling, and donating items. Key products include the Nextdoor Ads Platform, which offers hyperlocal advertising solutions, and the Ask feature, which uses artificial intelligence to summarize neighbor recommendations. The platform serves a diverse user base including individual neighbors, small and large businesses, and civic organizations such as fire departments and municipal offices. Nextdoor operates in the United States, United Kingdom, and Canada. The company partners with local news publishers and alert providers such as Waze, Weather.com, and the U.S. Geological Survey to deliver timely local information. Its technology stack utilizes geospatial data and machine learning to personalize content and optimize ad delivery for local audiences.

Summarised from the company's own disclosures, fiscal year ended Feb 2026

Industry Internet Content & Information Homepage nextdoor.com
Sector Communication Services IR page investors.nextdoor.com/home/default.aspx
Tags
neighborhood social network, local advertising, hyperlocal targeting, community marketplace, local news aggregation, safety alerts, geospatial technology, business pages, civic engagement, local recommendations, Nextdoor, Nextdoor Ads Platform, Nextdoor Ads Manager, Ask, For Sale & Free, Fave Award, Waze, Weather.com, U.S. Geological Survey
Press page —

Metrics

Valuation  
Market cap $ 774.154M
Market cap (USD) $ 774.154M
P/E -42.46
PEG —
P/BV 1.88
P/S 2.72
P/OCF 20.60
P/FCF 21.24
Dividend yield —
Turnover / mcap —
Returns  
ROE -12.3%
ROI -13.9%
ROIC -13.8%
Profit margin -21.0%
Growth  
Revenue growing Yes
Profits growing Yes
Revenue up 3y Yes
Revenue up 5y Yes
Earnings growth 3y (net profit CAGR) —
Quality  
Profitable No
Margin expanding Yes
Buying back stock No
Diluting (TTM) No
Debt/Equity —
Podcast bulls (TTM) Sign up
Podcast bears (TTM) Sign up
Podcast sentiment (TTM) Sign up
Podcast sentiment % (TTM) Sign up
News sentiment (TTM) 23
Quality score -11.1%
Insiders  
Buys, 1w Sign up
Buys, 1m Sign up
Buys, 1y Sign up
Sells, 1w Sign up
Sells, 1m Sign up
Sells, 1y Sign up

Sign up to see this company's insider trades

Figure FY 2025 FY 2024 FY 2023 FY 2022 FY 2021 FY 2020
Revenue 257.646M 247.276M 218.309M 212.765M 192.197M 123.284M
Net profit -54.204M -98.063M -147.765M -137.916M -95.325M -75.234M
Free cash flow 5.891M -20.606M -59.54M -63.664M -60.114M -46.627M

Figure FY 2025 FY 2024 FY 2023 FY 2022 FY 2021 FY 2020
Share price 2.1 2.37 1.89 2.06 7.89 —
Price performance 12m -0.11 0.25 -0.08 -0.74 — —

Filed figures

Figure Dec 2019 Dec 2020 Dec 2021 Dec 2022 Dec 2023 Dec 2024 Dec 2025
Balance sheet detail
Trade receivables (USD) — 21.8M 29.7M 29.8M 26.2M 31.2M 34.4M
↳ YoY growth +36.0% +0.3% -11.9% +18.8% +10.3%
↳ 5y CAGR +9.5%
Lease liabilities (USD) — 39.6M 68.7M 61.6M 66.6M 40.7M 32.3M
Cash and deposits (USD) 84M 83.6M 522M 55.2M 60.2M 45.6M 63.3M
Intangible assets (USD) — 6.99M 4.84M 3.07M 1.3M 257,000 —
Right-of-use assets (USD) — 37.8M 59.4M 52.6M 57M 14.4M 11.6M
Cash flow detail
Operating cash flow (USD) — -41.6M -51.3M -60.5M -59.3M -20.2M 6.47M
Purchases of property, plant and equipment (USD) — -5.02M -8.85M -3.16M -267,000 -404,000 -580,000
Change in receivables (cash effect) (USD) — -3.17M -8.17M -168,000 3.49M -5.15M -3.21M
Change in payables (cash effect) (USD) — 15,000 2.76M -1.58M -2.64M -1.65M 2.22M
Share buybacks (cash effect) (USD) — 0.00 -12.2M -77.2M 0.00 -75.5M -18.9M
Income taxes paid (cash effect) (USD) — -30,000 -313,000 -1.2M -2.41M -1M -500,000
Share-based compensation (USD) — 22.6M 47.5M 64.4M 83M 74.1M 65.3M
Operating cash flow before change in receivables (USD) — -38.4M -43.1M -60.3M -62.8M -15.1M 9.68M
Free cash flow (OCF - PPE - intangibles) (USD) — -46.6M -60.1M -63.7M -59.5M -20.6M 5.89M
Income detail
Research and development expense (USD) — 69.2M 97.1M 127M 150M 128M 135M
↳ 5y CAGR +14.3%
Total comprehensive income (USD) — -76.1M -95.1M -140M -145M -98.1M -53.6M
Comprehensive income to owners (USD) — -76.1M -95.1M -140M -145M -98.1M -53.6M
Provision for credit losses (USD) — 291,000 317,000 71,000 46,000 — —
Credit cost ratio (credit losses / average receivables) (%) — — 1.2% 0.2% 0.2% — —
Reported Mar 15, 2022 Feb 28, 2023 Mar 15, 2022 Feb 28, 2023 Feb 27, 2024 Feb 27, 2025 Feb 18, 2026

Operating KPIs — quarters

KPI Dec 21 Mar 22 Jun 22 Sep 22 Dec 22 Dec 23 Jun 24 Sep 24
Weekly active users — — — — — 41.8M — —
↳ YoY growth (company-stated) +32.0% +33.0% +26.0% +17.0% +5.0% +8.0% +13.0%
↳ QoQ growth (company-stated) +9.0% +1.0% +4.0% +4.0% +3.0%
Reported Mar 1, 2022 May 10, 2022 Aug 9, 2022 Nov 8, 2022 Feb 28, 2023 Feb 27, 2024 Aug 7, 2024 Nov 6, 2024

Sign up to see institutional holdings

Sign Up

Podcast Mentions

Sign up to see podcast mentions and sentiment

Sign Up

Nextdoor Reports Third Quarter 2026 Results Bull 4 Bear 0 Results

Written by: Team Nextdoor

_Delivered Q3 Results Ahead of Guidance
__Drove Third Consecutive Quarter of Sequential Platform WAU Growth
_Improved Net Loss Margin 18 Points and Adjusted EBITDA Margin 7 Points Year Over Year

SAN FRANCISCO, CA, November 5, 2026 — Nextdoor Holdings, Inc. (Nasdaq: NXDR), the essential neighborhood network, today announced results for the third quarter ended September 30, 2026.

Nextdoor's highlighted metrics for the third quarter ended September 30, 2026 include:

  • Revenue of $79 million increased 14% year-over-year.
  • Platform Weekly Active Users (Platform WAU) of 24.5 million increased 14% year-over-year.
  • Net loss was less than $1 million, compared to a net loss of $13 million in the year-ago period.
  • Adjusted EBITDA was $10 million, compared to $4 million in the year-ago period, reflecting 7 percentage points of year-over-year margin improvement.
  • Cash, cash equivalents, and marketable securities were $382 million as of September 30, 2026.

"Q3 was another record quarter for Nextdoor, and the strongest proof yet that our transformation is well underway,” said Nextdoor CEO and Co-Founder Nirav Tolia. “Platform WAU grew for the third straight quarter to 24.5 million, revenue grew 14%, and our net loss narrowed to less than $1 million from $13 million a year ago. This progress comes from hundreds of improvements that compound on one another, and from a team that kept building long before the numbers confirmed it. In a world where more of the internet is becoming synthetic, what becomes scarce is real people, verified to a real place, helping one another. We’re carrying this momentum into the fourth quarter and beyond."

"Q3 was a strong quarter of steady progress, with Adjusted EBITDA above our guidance range and Adjusted EBITDA margin up 7 points from a year ago,” said Nextdoor CFO Indrajit Ponnambalam. “Our fourth quarter outlook puts full-year revenue growth in line with the low-teens range we provided last quarter. And with $28 million of operating cash flow so far this year, we’re able to keep investing in the business while opportunistically returning capital to shareholders through our buyback.”

For more detailed information on our operating and financial results for the third quarter ended September 30, 2026, please reference our Nextdoor Investor Update posted to our Investor Relations website located at investors.nextdoor.com.

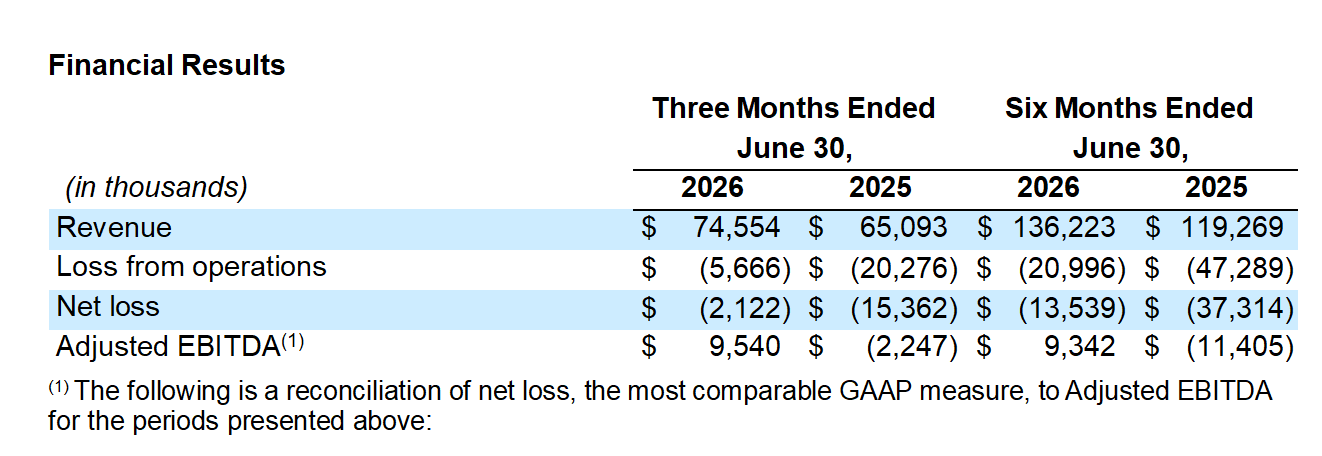
Financial Results

Three Months Ended September 30, Nine Months Ended September 30,
(in thousands) 2026 2025 2026 2025
Revenue $ 78,771 $ 68,898 $ 214,994 $ 188,167
Loss from operations $ (4,199) $ (17,229) $ (25,195) $ (64,518)
Net loss $ (659) $ (12,857) $ (14,198) $ (50,171)
Adjusted EBITDA(1) $ 10,303 $ 4,385 $ 19,645 $ (7,020)

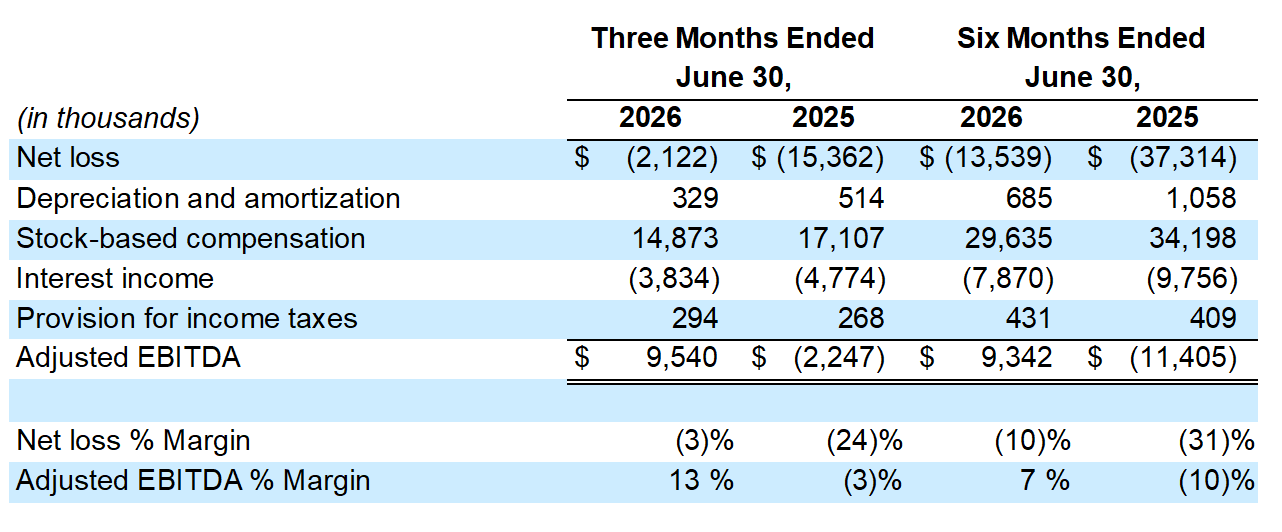
(1) The following is a reconciliation of net loss, the most comparable GAAP measure, to Adjusted EBITDA for the periods presented above:

Three Months Ended September 30, Nine Months Ended September 30,
(in thousands) 2026 2025 2026 2025
Net loss $ (659) $ (12,857) $ (14,198) $ (50,171)
Depreciation and amortization 338 475 1,023 1,533
Stock-based compensation 14,348 16,600 43,983 50,798
Interest income (3,831) (4,624) (11,701) (14,380)
Provision for income taxes 107 131 538 540
Restructuring charges — 4,660 — 4,660
Adjusted EBITDA $ 10,303 $ 4,385 $ 19,645 $ (7,020)
Net loss % Margin (1) % (19) % (7) % (27) %
Adjusted EBITDA % Margin 13 % 6 % 9 % (4) %

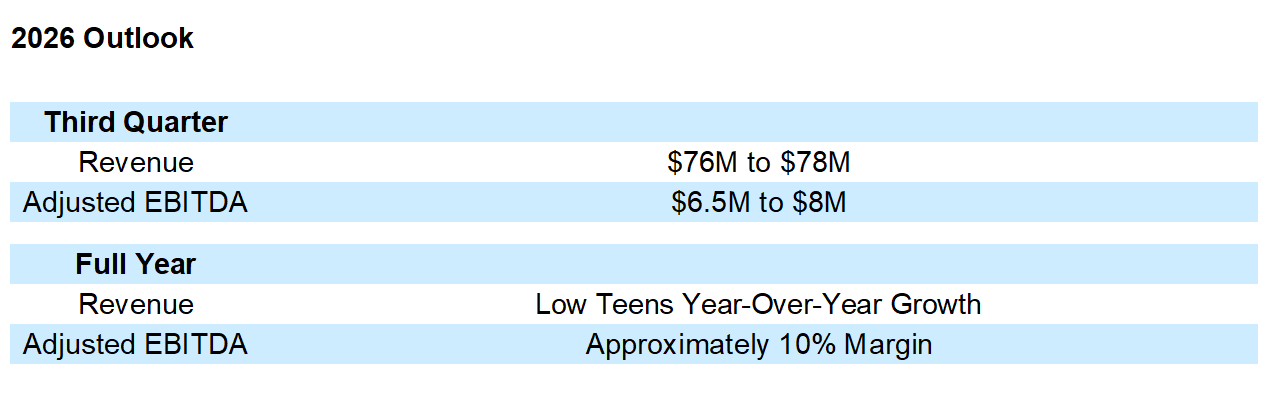
2026 Outlook

Fourth Quarter
Revenue $78M to $80M
Adjusted EBITDA $10M to $11M
Full Year
Revenue $293M to $295M
Adjusted EBITDA $30M to $31M

Nextdoor will host a conference call at 5:30 a.m. PT/8:30 a.m. ET on November 5, 2026 to discuss these results and outlook. A live webcast of our third quarter 2026 earnings call will be available in the Events & Presentations section of Nextdoor’s Investor Relations website located at investors.nextdoor.com. After the live event, the audio recording for the webcast can be accessed on the same website for approximately one year.

Nextdoor uses its Investor Relations website (investors.nextdoor.com), its X handle (x.com/Nextdoor), its LinkedIn Home Page (linkedin.com/company/nextdoor-com), and Nirav Tolia’s LinkedIn posts (linkedin.com/in/niravtolia/) and X posts (x.com/niravtolia) as a means of disseminating or providing notification of, among other things, news or announcements regarding its business or financial performance, investor events, press releases, and earnings releases, and as a means of disclosing material nonpublic information and for complying with its disclosure obligations under Regulation FD.

Non-GAAP Financial Measures

We have not reconciled our Adjusted EBITDA outlook to GAAP net loss because certain items that impact GAAP net loss are uncertain or out of our control and cannot be reasonably predicted. In particular, stock-based compensation expense is impacted by the future fair market value of our common stock and other factors, all of which are difficult to predict, subject to frequent change, or not within our control. The actual amount of these expenses during 2026 will have a significant impact on our future GAAP financial results. Accordingly, a reconciliation of Adjusted EBITDA outlook to net loss is not available without unreasonable efforts.

To supplement our condensed consolidated financial statements, which are prepared in accordance with GAAP, we present certain non-GAAP financial measures, such as Adjusted EBITDA and Adjusted EBITDA margin, in this press release. Our use of non-GAAP financial measures has limitations as an analytical tool, and these measures should not be considered in isolation or as a substitute for analysis of financial results as reported under GAAP.

We use non-GAAP financial measures in conjunction with financial measures prepared in accordance with GAAP for planning purposes, including in the preparation of our annual operating budget, as a measure of our core operating results and the effectiveness of our business strategy, and in evaluating our financial performance. Non-GAAP financial measures provide consistency and comparability with past financial performance, facilitate period-to-period comparisons of core operating results, and also facilitate comparisons with other peer companies, many of which use similar non-GAAP financial measures to supplement their GAAP results. In addition, Adjusted EBITDA is widely used by investors and securities analysts to measure a company's operating performance. We exclude the following items from one or more of our non-GAAP financial measures: stock-based compensation expense (non-cash expense calculated by companies using a variety of valuation methodologies and subjective assumptions), depreciation and amortization (non-cash expense), interest income, provision for income taxes, and, if applicable, restructuring charges and acquisition-related costs.

Investors are cautioned that there are material limitations associated with the use of non-GAAP financial measures as an analytical tool. In particular, (1) stock-based compensation expense has recently been, and will continue to be for the foreseeable future, a significant recurring expense for our business and an important part of our compensation strategy, (2) although depreciation and amortization expense are non-cash charges, the assets subject to depreciation and amortization may have to be replaced in the future, and our non-GAAP measures do not reflect cash capital expenditure requirements for such replacements or for new capital expenditure requirements, and (3) Adjusted EBITDA does not reflect: (a) changes in, or cash requirements for, our working capital needs; (b) interest expense (if any), or the cash requirements necessary to service interest or principal payments on debt (if any), which reduces cash available to us; or (c) tax payments that may represent a reduction in cash available to us. The non-GAAP measures we use may be different from non-GAAP financial measures used by other companies, limiting their usefulness for comparison purposes. We compensate for these limitations by providing specific information regarding the GAAP items excluded from these non-GAAP financial measures.

About Nextdoor

Nextdoor (Nasdaq: NXDR) is the essential neighborhood network for over 110 million verified neighbors, offering trusted local news, real-time safety alerts, neighbor recommendations, for sale and free listings, and events. Nextdoor connects neighbors to the people, places, and information that matter most in their local communities. In addition, businesses, news publishers, and public agencies use Nextdoor to share important information and engage with neighborhoods at scale. Download the app or join the neighborhood at nextdoor.com. For more information and media assets, visit nextdoor.com/newsroom.

Safe Harbor Statement

This press release contains forward-looking statements regarding our future business expectations, including statements regarding projected financial results. These forward-looking statements are only predictions and may differ materially from actual results due to a variety of factors, as more fully detailed under the caption "Risk Factors" in our Quarterly Report on Form 10-Q for the quarter ended September 30, 2026, expected to be filed with the Securities and Exchange Commission (“SEC”) on November 5, 2026, and our other SEC filings, which are or will be available on the Investor Relations page of our website at investors.nextdoor.com and on the SEC’s website at www.sec.gov. All forward-looking statements contained herein are based on information available to us as of the date hereof and you should not rely upon forward-looking statements as predictions of future events. We undertake no obligation to update any of these forward-looking statements for any reason after the date of this press release or to conform these statements to actual results or revised expectations, except as required by law. Undue reliance should not be placed on the forward-looking statements in this press release.

Written by: Team Nextdoor

Millions of neighbor votes recognize the local businesses communities love, with winners featured in their neighborhood’s Local Faves hub

SAN FRANCISCO--October 14, 2026 - Nextdoor Holdings, Inc. (Nasdaq: NXDR), the essential neighborhood network, today announced the U.S. winners of the 2026 Fave Awards, recognizing the local businesses neighbors love most. Winners were decided by neighbor voting, making this year’s list incredibly useful. Votes cast by neighbors between Sept. 4 and Sept. 30 were counted, and the full winners list is live at nextdoor.com/fave_awards_winners .

Nextdoor neighbors in the U.S. cast about 5 million votes for about 750,000 local businesses across 20 categories. Neighborhoods across the U.S. now have their own lists of the businesses their neighbors rely on most. Fave Awards are given once a year, and voting starts fresh each time.

What sets the Fave Awards apart is where the recommendations come from: neighbors in the communities where these businesses operate. Instead of a single national ranking or anonymous reviews from across the internet, the awards reflect local word of mouth, so each neighborhood gets its own list of businesses, from restaurants to plumbers, that its neighbors know and trust. Businesses cannot pay Nextdoor for Faves or votes, and no purchase or payment of any kind increases a business’s chance of winning. The recognition comes from neighbors.

"Congratulations to all of this year's Fave Awards winners," said Nirav Tolia, Nextdoor CEO and Co-Founder. "Every business on these lists was voted in by the neighbors who live around it. That is a high bar, and the ones who cleared it have earned the trust and loyalty of their community."

Top-voted winners include Stan’s Donut Shop in Santa Clara, Calif.; Tower Cafe in Sacramento, Calif.; Round Rock Donuts in Round Rock, Texas; Portofino Pizza and Pasta in Parker, Colo.; and Original Word of Mouth in Venice, Fla.

While the Fave Awards are held once a year, businesses can collect Faves year-round, with each Fave signaling that a neighbor vouches for their business on Nextdoor. The more Faves a business has, the more that business stands out in Search and in the Local Faves hub on Nextdoor. Faves on Nextdoor now number nearly 78 million in the U.S.

For businesses that earn a Fave Award, the recognition goes even further. Winners receive a Fave Awards trophy badge that appears on their Nextdoor Business Page and higher ranking in neighbor search results, whether or not they have claimed their page. Winners will also receive a storefront sticker and a downloadable Winner's Kit, so they can share the news with their own customers.

Neighbors can see the winners for their area by logging in to Nextdoor or visiting nextdoor.com/fave_awards_winners. You can learn more about the Nextdoor Fave Awards by visiting: https://business.nextdoor.com/en-us/small-business/fave-awards .

About NextdoorNextdoor (Nasdaq: NXDR) is the essential neighborhood network for over 110 million verified neighbors, offering trusted local news, real-time safety alerts, neighbor recommendations, for sale and free listings, and events. Nextdoor connects neighbors to the people, places, and information that matter most in their local communities. In addition, businesses, news publishers, and public agencies use Nextdoor to share important information and engage with neighborhoods at scale. Download the app or join the neighborhood at nextdoor.com . For more information and media assets, visit nextdoor.com/newsroom .

Written by: Team Nextdoor

Nextdoor’s Halloween Guide Now Features Local Events and Happenings, Plus Details on What Neighbors Are Handing Out at Their Homes. Live October 8 in the U.S., U.K. and Canada

SAN FRANCISCO, Calif., October 8, 2026 – Nextdoor Holdings, Inc. (NYSE: NXDR), the essential neighborhood network, today announced the return of its annual Treat Map for a 14th year. Built around the idea that Halloween is bigger than any one house, this year’s map helps neighbors discover the homes, local events and businesses bringing the holiday to life. In the U.S., the Treat Map is sponsored by Reese’s and features Reese’s Trick-or-Treatiest Street in America, the brand’s nationwide search celebrating the communities that go all in on Halloween.

From October 8 through October 31, neighbors in the U.S., U.K. and Canada can add a pin to the Treat Map. For the first time, neighbors choose what kind of pin to add: a home, to let trick-or-treaters know they’re handing out treats or showing off decorations, or a local spot, like a Halloween event or a nearby attraction.New tags describe what visitors can expect, including the option to pin “Decorations,” “Halloween event” or “Local business.” Adding a home pin is easier than ever this year. Rather than starting from a blank post, neighbors see suggested template wording.

The map is also filterable for the first time. A household handing out non-food treats can say so, and a parent planning a route can filter the map to show only those homes. The same works for pet treats and for doors that open early, before the older kids are out.

In the U.S., the map includes Reese’s Trick-or-Treatiest Street in America, featuring the Top 150 Streets identified through Reese’s extensive data and community insights on top neighborhoods for Halloween spirit and activities. Neighbors can open the destinations directly from the Treat Map as they plan their Halloween routes.

As with previous years, adding a pin is optional and neighbors decide what to share. The map is designed to help neighbors plan their Halloween, and it doesn’t collect location data beyond what neighbors choose to share in their pins. Pin details are provided by neighbors and aren’t verified by Nextdoor.

“Halloween is one of the few nights a year when an entire street comes together. The Treat Map has always been about helping neighbors make the most of that night. This year, it goes beyond porches to help people discover everything happening in their neighborhood, from the haunted house two blocks over to the bakery handing out cider,” said CEO and Co-Founder Nirav Tolia.

“Halloween magic comes to life street by street, porch by porch and neighborhood by neighborhood,” said Melissa Blette, Senior Brand Manager, Reese’s Brand at The Hershey Company. “Through Reese’s Trick-or-Treatiest Street in America and our partnership with Nextdoor, we’re celebrating the traditions, togetherness and community spirit that make Halloween unforgettable, while helping families discover the streets that truly go all in.”

Neighbors can join the fun, pin their homes, and find the Treat Map by opening the Nextdoor app or visiting https://nextdoor.com/treat_map . The full list of Reese’s Top 150 Trick-or-Treatiest Street is also available at hersheyland.com/trickortreatiest .

About Nextdoor:

Nextdoor (NYSE: NXDR) is the essential neighborhood network for over 110 million verified neighbors, offering trusted local news, real-time safety alerts, neighbor recommendations, for sale and free listings, and events. Nextdoor connects neighbors to the people, places, and information that matter most in their local communities. In addition, businesses, news publishers, and public agencies use Nextdoor to share important information and engage with neighborhoods at scale. Download the app or join the neighborhood at nextdoor.com . For more information and media assets, visit: nextdoor.com/newsroom .

About The Hershey Company:

The Hershey Company is an industry-leading snacks company with a purpose to make more moments of goodness and a vision to lead next generation snacking. Hershey brings together more than 20,000 employees worldwide to deliver delicious, high-quality products across more than 85 brands in approximately 65 countries, generating more than $11.7 billion in annual revenues. Hershey brings its full portfolio to market as ONE Hershey, spanning confection, salty and functional snacking categories with beloved brands like Hershey’s, Reese’s, Kisses, KIT KAT®, Jolly Rancher, Twizzlers and Ice Breakers; salty snacks including SkinnyPop, LesserEvil, Pirate’s Booty and Dot’s Homestyle Pretzels; and a protein portfolio including ONE Brands and Fulfil.

Media Contact:

Kelsey Grady
[email protected]

Tag(s): Treat Map

Team Nextdoor

More from the blog

View All Posts


Product news

3 min read | October 1, 2024

Nextdoor’s Annual Treat Map is Back!
------------------------------------

Read More


Product news

4 min read | October 5, 2023

Nextdoor’s Treat Map Returns to Help Neighbors Plan for the Thrills, Chills and Spills of Halloween
---------------------------------------------------------------------------------------------------

Read More
Product news

5 min read | October 1, 2021

Nextdoor’s annual Treat Map is here to help neighbors celebrate Halloween
-------------------------------------------------------------------------

Read More

Subscribe to email updates

Stay up-to-date on what's happening at this blog and get additional Nextdoor content.

Email *

logo_nextdoor_wordmark

Copyright © 2026

US Flag

US Flag United States UK Flag United Kingdom Canada Flag Canada (EN) Canada Flag Canada (FR)

  • Get the app

Prompts

Nextdoor Holdings, Inc. (ticker NXDR), listed in United States.

Company History

Date Change Detail
Aug 16, 2021 Renamed KHOSLA VENTURES ACQUISITION CO. II → NEXTDOOR HOLDINGS, INC.
— Former tickers KIND

ETFs Holding Nextdoor Holdings, Inc.

ETF Weight in ETF Shares Market value As of
FSML 0.36% 199,500 $ 452.865K Jun 30, 2026
FSEV 0.27% 7,960 $ 18.069K Jun 30, 2026
FEAC 0.06% 6,911 $ 15.688K Jun 30, 2026
FESM 0.05% 1,371,344 $ 3.113M Jun 30, 2026
AVSC 0.03% 418,932 $ 854.621K Nov 16, 2026
RESM 0.02% 341 $ 774.07 Jun 30, 2026
DFAS 0.00% 782,577 $ 1.604M Nov 12, 2026
DXUV 0.00% 88,274 $ 180.962K Nov 12, 2026
DFSU 0.00% 19,393 $ 39.756K Nov 12, 2026
DFAC 0.00% 590,953 $ 1.211M Nov 12, 2026
DFAU 0.00% 58,737 $ 120.411K Nov 12, 2026
DCOR 0.00% 142,204 $ 291.518K Nov 12, 2026
DFUS 0.00% 65,131 $ 133.519K Nov 12, 2026
AVUS 0.00% 9,735 $ 19.859K Nov 16, 2026