NVIDIA Vera Rubin NVL72 and NVIDIA Vera CPUs Are Now Generally Available on OCI, With Plans to Introduce HGX Rubin NVL8 Systems to Help Organizations Accelerate Frontier Model Training, Improve Inference Efficiency and Scale Agentic Workloads October…
NVIDIA Vera Rubin NVL72 and NVIDIA Vera CPUs Are Now Generally Available on OCI, With Plans to Introduce HGX Rubin NVL8 Systems to Help Organizations Accelerate Frontier Model Training, Improve Inference Efficiency and Scale Agentic Workloads
October 27, 2026
NVIDIA and Oracle today announced plans to expand Oracle Cloud Infrastructure
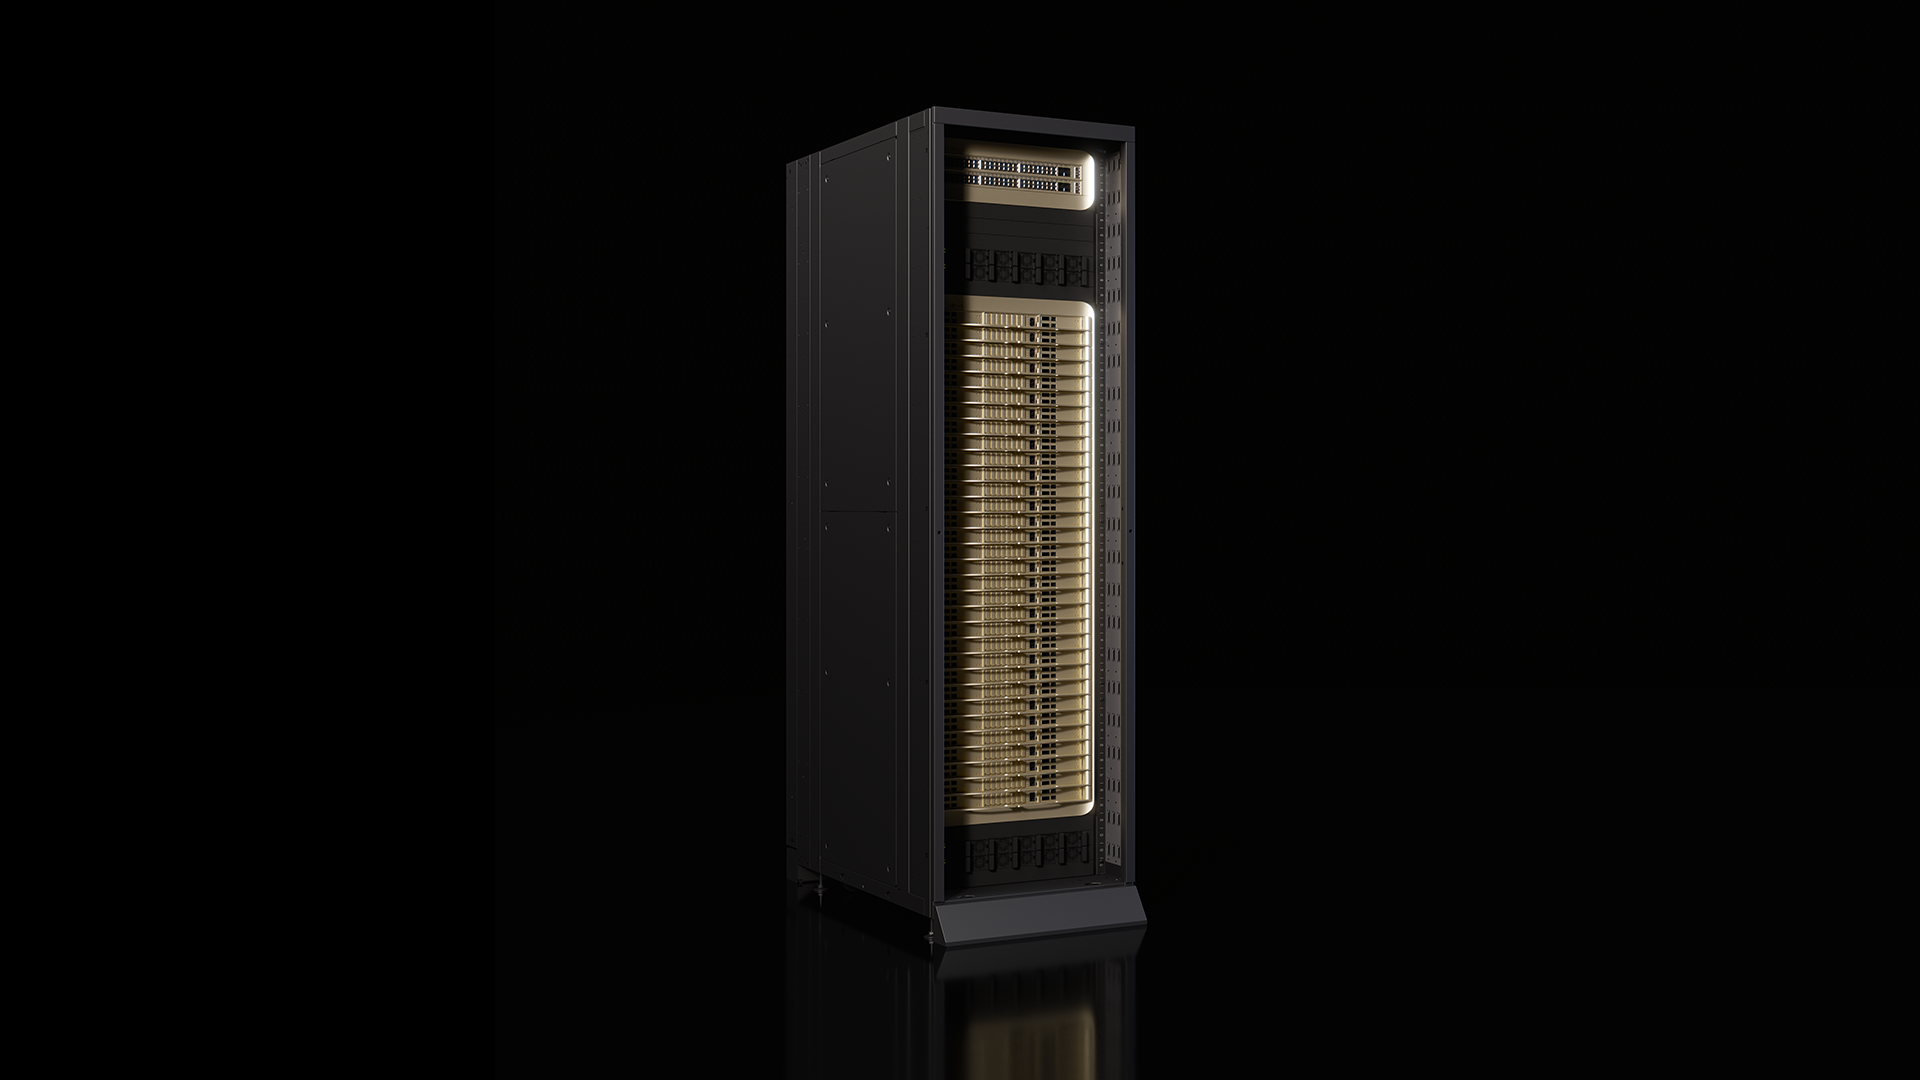
(OCI) Superclusters with NVIDIA Vera Rubin NVL72
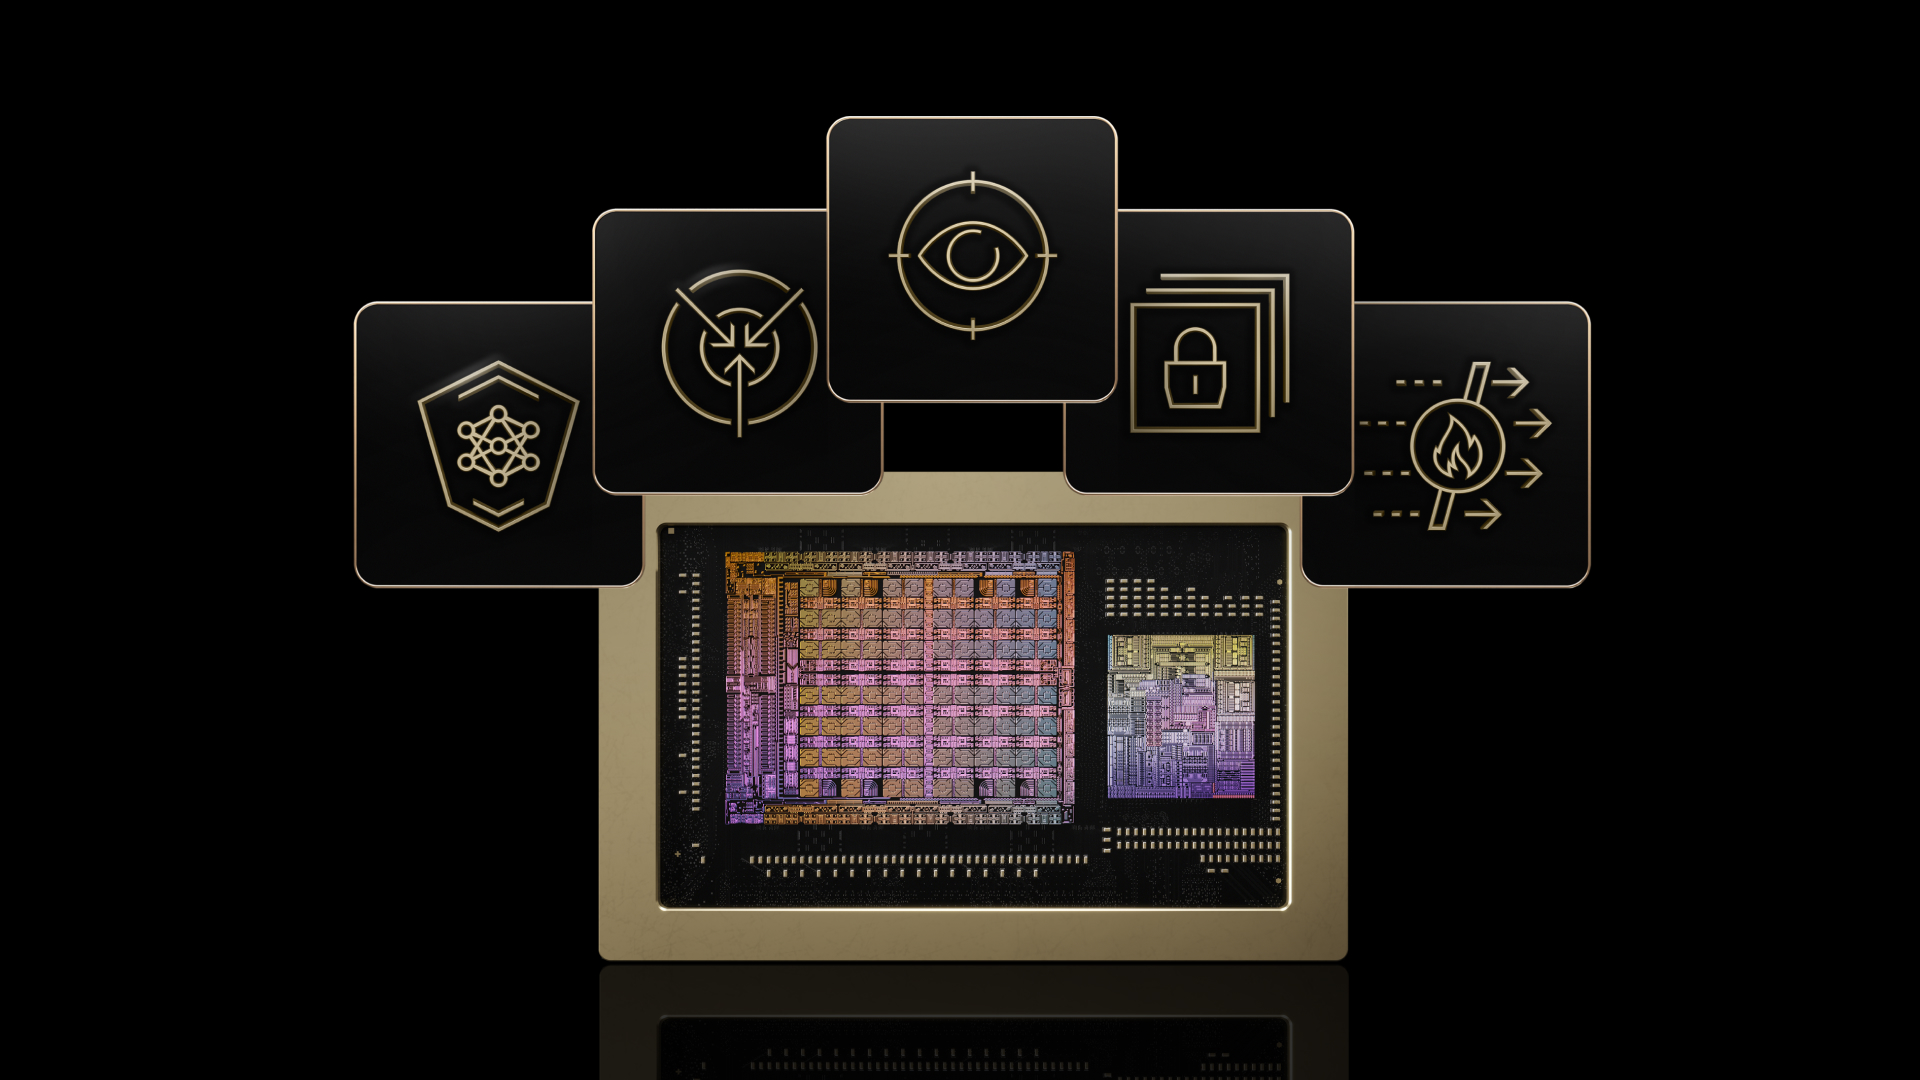
systems to multi-gigawatt scale, supporting growing customer demand for AI training, inference and agentic applications. Oracle and NVIDIA also expanded their AI infrastructure collaboration with the general availability of NVIDIA Vera Rubin NVL72 and NVIDIA Vera CPUs
on OCI.
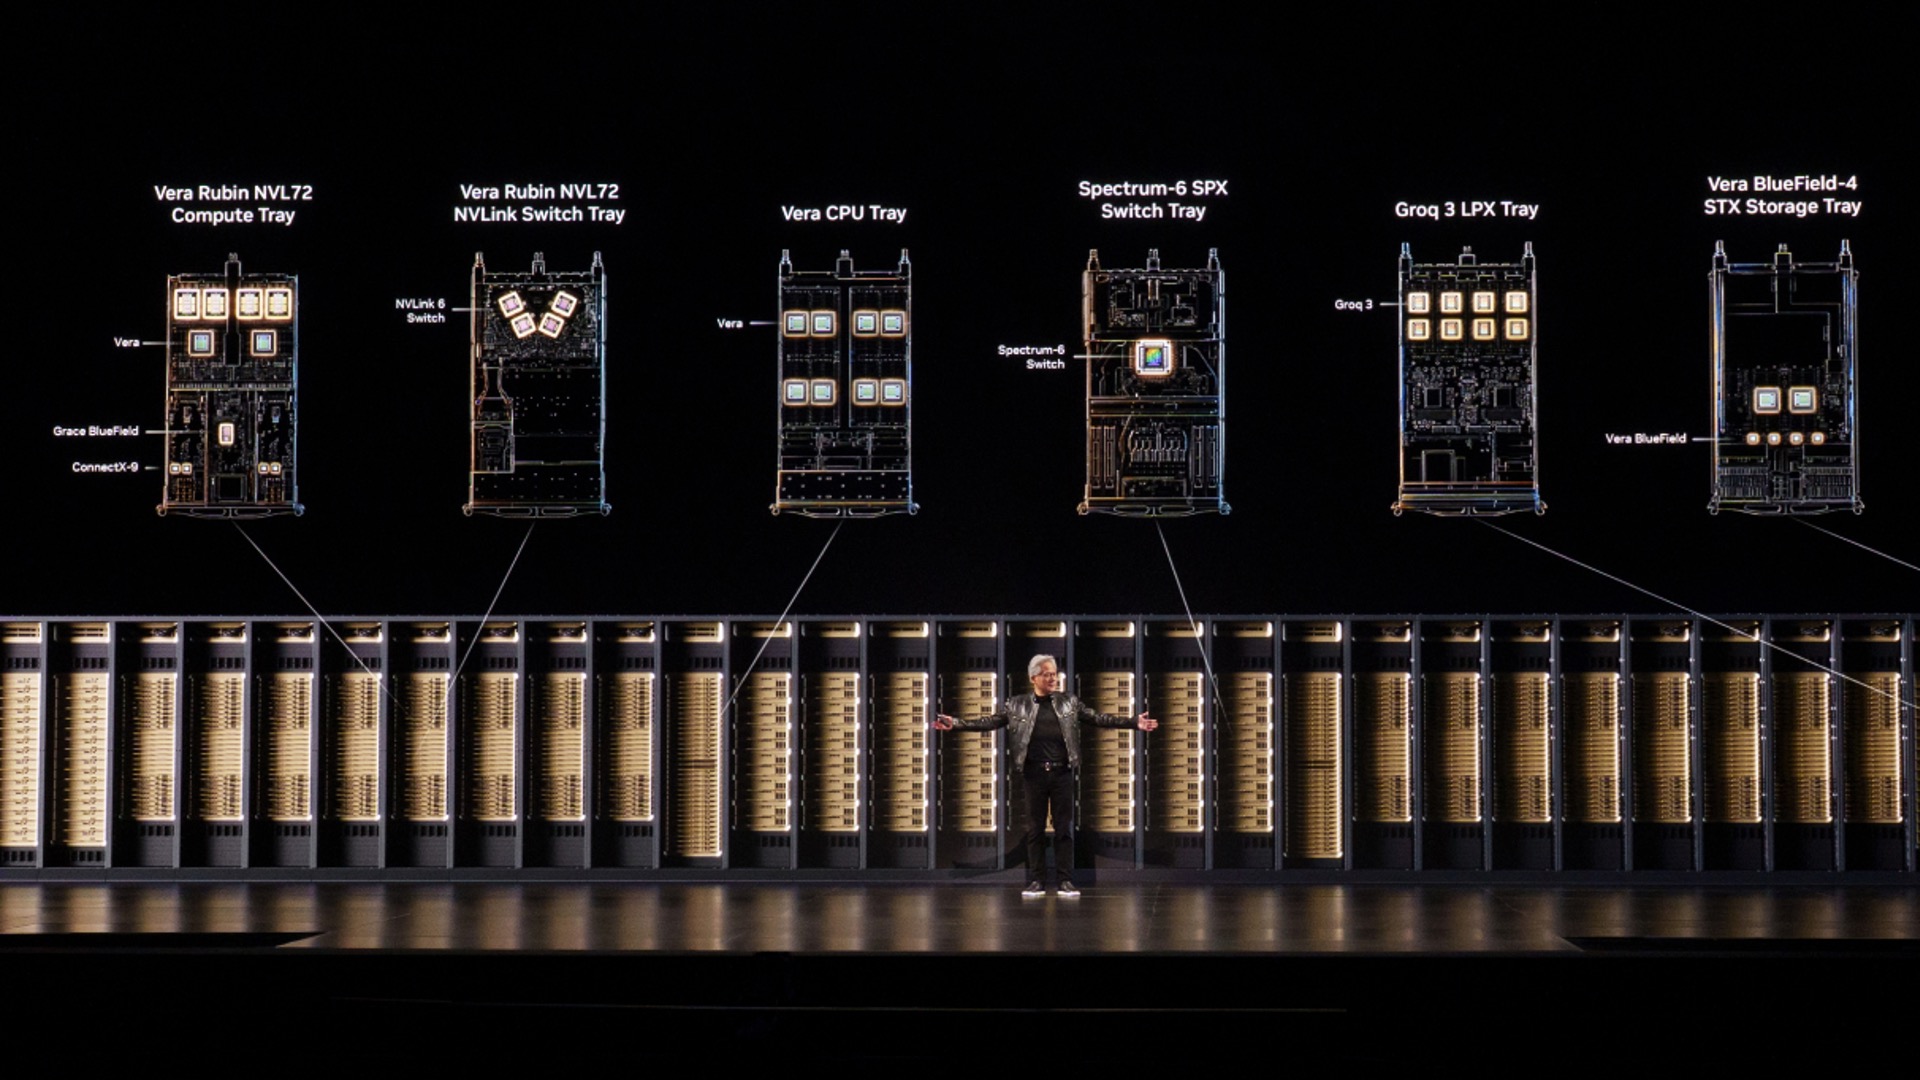
The expanded collaboration gives customers infrastructure for both the GPU-intensive work of training and serving frontier models and the CPU-intensive tasks agents perform between model calls, including executing tools, testing code and retrieving data. Customers can scale CPU and GPU resources independently to match their workloads, helping reduce idle capacity and put more of their infrastructure to productive use.
OCI Superclusters Help Organizations Bring Frontier AI to Market Faster at Multi-Gigawatt Scale
OCI Superclusters
combine NVIDIA NVL72 rack-scale systems, Oracle Acceleron
networking with NVIDIA Spectrum-X
™ Ethernet networking featuring NVIDIA Spectrum™-6 switches and NVIDIA BlueField®-4 DPUs, and gigawatt-class power and cooling to train and serve the largest AI models. Each rack connects 72 GPUs through NVIDIA NVLink
™ scale-up networking, while OCI’s resilient, multiplanar network scales across hundreds of thousands of GPUs.
The planned Vera Rubin expansion builds on OCI’s existing NVIDIA-powered infrastructure, including NVIDIA GB200
and GB300
NVL72 systems. NVIDIA’s common CUDA® software foundation and continued software optimization help customers support evolving models and workloads across hardware generations.
OCI also plans to introduce NVIDIA HGX Rubin NVL8, delivering eight Rubin GPUs connected through NVLink in an x86-based server configuration.
The planned platform features two 64-core Intel Xeon 6 CPUs, 4TB of DDR5 memory and 6.4 Tbps of high-speed RDMA networking, providing a flexible deployment option for AI training, fine-tuning and inference. HGX Rubin NVL8 enables customers to adopt next-generation Rubin GPU technology in a smaller eight-GPU configuration while maintaining compatibility with x86-based applications.
This flexibility enables customers to adapt their AI infrastructure to different models and workloads as their needs evolve, using accelerated computing capacity across both training and inference to make better use of their infrastructure investments.
OpenAI has demonstrated how this infrastructure supports frontier AI. In Abilene, OpenAI has trained and served GPT-6 Astra on an OCI Supercluster with more than 100,000 NVIDIA Blackwell GPUs
.
“As our frontier models advance, we need infrastructure that can keep pace,” said Sreekanth Pothanis, engineering leader, compute infra at OpenAI. “NVIDIA Vera Rubin on OCI gives us the computing performance and scale to accelerate model training and serve increasingly demanding AI workloads.”
NVIDIA Vera CPUs on OCI Accelerate the Work Behind AI Agents
AI agents do more than generate responses. They call tools, execute code and retrieve information to complete tasks. Slow execution of those CPU-intensive operations can delay results and leave GPUs waiting between model calls.
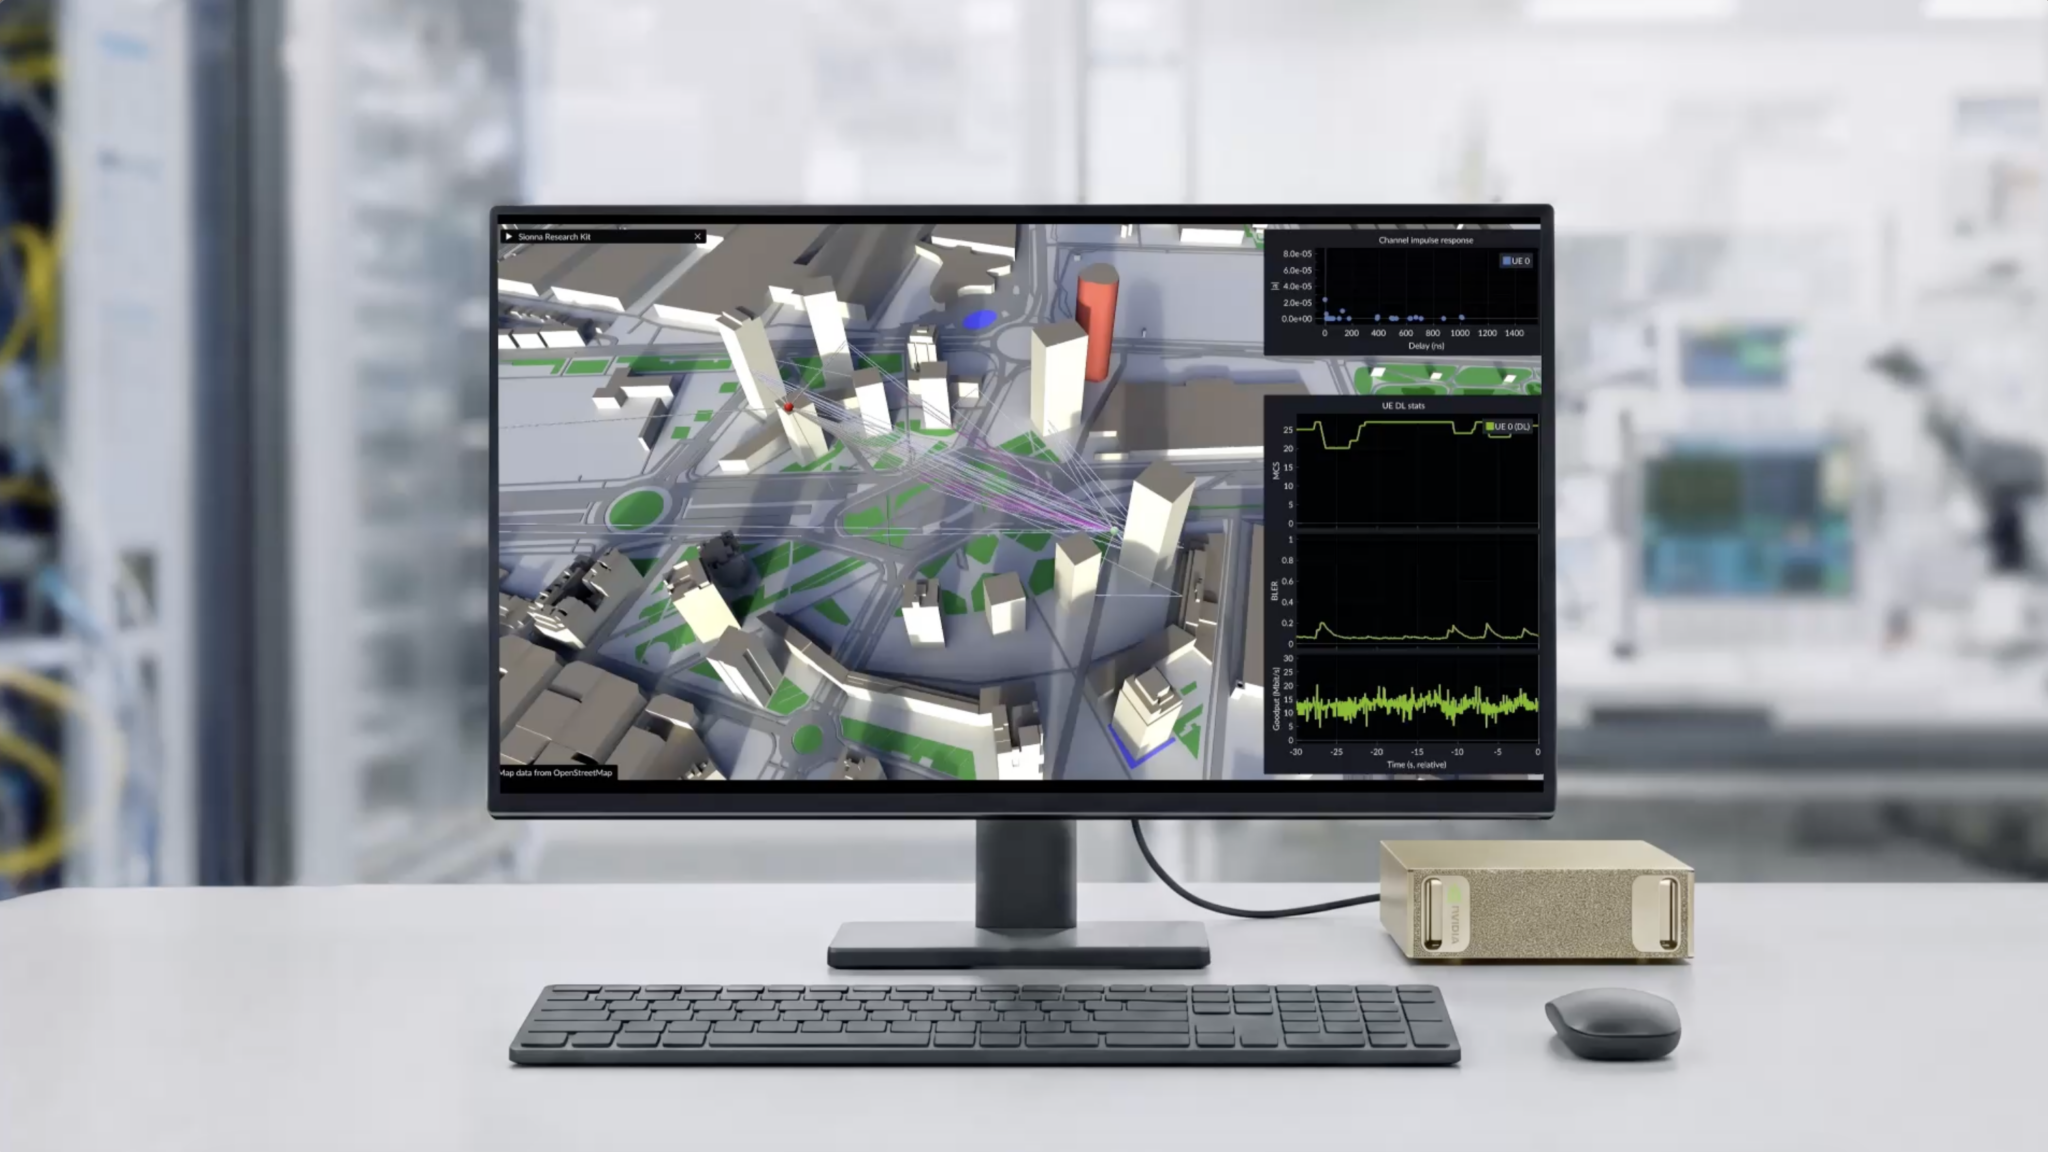
OCI Compute with NVIDIA Vera CPUs combines high single-thread performance with memory bandwidth to help agents complete CPU-intensive tasks faster. High single-thread performance accelerates individual tool calls and code execution, while high memory bandwidth keeps CPU cores supplied with data as agents run concurrent tasks. Together, these capabilities help reduce GPU idle time and maintain consistent performance as workloads scale. To further support these workloads, OCI Kubernetes Engine enables customers to scale CPU and GPU resources independently, while Oracle Acceleron provides hardware-based isolation for workloads running untrusted, AI-generated code.
Customers with early access to NVIDIA Vera CPUs on OCI, including OpenAI, are exploring their potential across a range of AI workloads.
“NVIDIA Vera CPUs on OCI deliver the world-class loaded performance needed to execute code and run tools across our rapidly growing agentic sandbox workloads,” said Uday Ruddarraju, chief technology officer of compute at OpenAI. “We are bringing Vera into production on OCI to support these workloads at scale.”
“Oracle Cloud Infrastructure gives customers the performance, security and scale to advance frontier AI,” said Mahesh Thiagarajan, president of Oracle Cloud Infrastructure at Oracle. “Our collaboration with NVIDIA extends those capabilities across training, inference and agentic AI. By combining NVIDIA Vera Rubin GPUs and Vera CPUs with Oracle Acceleron networking and AI-optimized data centers, we’re helping customers keep GPUs productive, secure and scale efficiently as their needs grow.”
“AI factories must be productive, durable and fungible — delivering efficient computing, remaining useful through continued software advances and serving different models and workloads as demand changes,” said Ian Buck, vice president of hyperscale and high-performance computing at NVIDIA. “With Oracle, we’re bringing Vera Rubin and Vera CPUs to OCI to help customers put more of their infrastructure to work today and sustain its value as AI evolves.”
Learn more about Oracle Acceleron
, Oracle Cloud Infrastructure Supercluster
, Oracle and NVIDIA’s multigenerational partnership
, and OCI Compute with NVIDIA Vera CPUs
.
About Oracle
Oracle offers integrated suites of applications plus secure, autonomous infrastructure in the Oracle Cloud. For more information about Oracle (NYSE: ORCL), please visit us at oracle.com
.
About Oracle AI World
Oracle AI World is where customers and partners discover the latest product and technology innovations, see how AI is being applied across industries, and connect with experts and peers. Attendees will gain practical tips and insights to drive immediate impact within their organizations and explore how Oracle is helping unlock the full potential of AI. Join the event to see new capabilities in action and hear from thought leaders and industry movers. Register now at oracle.com/ai-world
or follow the news and conversation at oracle.com/news
and linkedin.com/company/oracle
.
About NVIDIA
NVIDIA
(NASDAQ: NVDA) is the world leader in AI and accelerated computing.
Oracle Trademarks Statement
Oracle, Java, MySQL and NetSuite are registered trademarks of Oracle Corporation. NetSuite was the first cloud company—ushering in the new era of cloud computing.
Oracle Future Product Disclaimer
The preceding is intended to outline our general product direction. It is intended for information purposes only, and may not be incorporated into any contract. It is not a commitment to deliver any material, code, or functionality, and should not be relied upon in making purchasing decisions. The development, release, timing, and pricing of any features or functionality described for Oracle’s products may change and remains at the sole discretion of Oracle Corporation.
Oracle Forward-Looking Statements
Statements in this article relating to Oracle’s future plans, expectations, beliefs, and intentions are “forward-looking statements” and are subject to material risks and uncertainties. Many factors could affect Oracle’s current expectations and actual results, and could cause actual results to differ materially. A discussion of such factors and other risks that affect Oracle’s business is contained in Oracle’s Securities and Exchange Commission (SEC) filings, including Oracle’s most recent reports on Form 10-K and Form 10-Q under the heading “Risk Factors.” These filings are available on the SEC’s website or on Oracle’s website at oracle.com/investor
. All information in this article is current as of October 27, 2026 and Oracle undertakes no duty to update any statement in light of new information or future events.
NVIDIA Forward-Looking Statements
Certain statements in this press release including, but not limited to, statements as to: expectations with respect to growth, performance, availability, benefits and long-term value of NVIDIA’s products, services and technologies, and related trends and drivers; expectations with respect to NVIDIA’s third party arrangements, including with its collaborators and partners; expectations with respect to AI infrastructure capacity expansion and deployment, and related timing and benefits; expectations with respect to technology developments, and related trends and drivers; projected market growth and trends; expectations with respect to AI and related industries; and other statements that are not historical facts are forward-looking statements within the meaning of Section 27A of the Securities Act of 1933, as amended, and Section 21E of the Securities Exchange Act of 1934, as amended, which are subject to the “safe harbor” created by those sections based on management’s beliefs and assumptions and on information currently available to management and are subject to risks and uncertainties that could cause results to be materially different than expectations. Important factors that could cause actual results to differ materially include: global economic and political conditions; NVIDIA’s reliance on third parties to manufacture, assemble, package and test NVIDIA’s products; the impact of technological development and competition; development of new products and technologies or enhancements to NVIDIA’s existing products and technologies; market acceptance of NVIDIA’s products or NVIDIA’s partners’ products; design, manufacturing or software defects; changes in consumer preferences or demands; changes in industry standards and interfaces; unexpected loss of performance of NVIDIA’s products or technologies when integrated into systems; NVIDIA’s ability to realize the potential benefits of business investments or acquisitions; and changes in applicable laws and regulations, as well as other factors detailed from time to time in the most recent reports NVIDIA files with the Securities and Exchange Commission, or SEC, including, but not limited to, its Annual Report on Form 10-K and Quarterly Reports on Form 10-Q. Copies of reports filed with the SEC are posted on NVIDIA’s website and are available from NVIDIA without charge. These forward-looking statements are not guarantees of future performance and speak only as of the date hereof, and, except as required by law, NVIDIA disclaims any obligation to update these forward-looking statements to reflect future events or circumstances.
© 2026 NVIDIA Corporation. All rights reserved. NVIDIA, the NVIDIA logo, and other NVIDIA product and service names are trademarks and/or registered trademarks of NVIDIA Corporation in the U.S. and other countries and regions. Other company, product, and service names may be trademarks of the respective companies with which they are associated.
Media Contacts
Kacie Thomas
Corporate Communications
NVIDIA Corporation
[email protected]
Ben Wolfson
PR
Oracle
+1.510.480.5230
[email protected]
Downloads
More Images
Oracle and NVIDIA
Download / File Link
More News

October 28, 2026
October 26, 2026
October 21, 2026
October 21, 2026

October 21, 2026
About Oracle
Oracle offers integrated suites of applications plus secure, autonomous infrastructure in the Oracle Cloud. For more information about Oracle (NYSE: ORCL), please visit us at oracle.com
.
About Oracle AI World
Oracle AI World is where customers and partners discover the latest product and technology innovations, see how AI is being applied across industries, and connect with experts and peers. Attendees will gain practical tips and insights to drive immediate impact within their organizations and explore how Oracle is helping unlock the full potential of AI. Join the event to see new capabilities in action and hear from thought leaders and industry movers. Register now at oracle.com/ai-world
or follow the news and conversation at oracle.com/news
and linkedin.com/company/oracle
.
About NVIDIA
NVIDIA
(NASDAQ: NVDA) is the world leader in AI and accelerated computing.
Oracle Trademarks Statement
Oracle, Java, MySQL and NetSuite are registered trademarks of Oracle Corporation. NetSuite was the first cloud company—ushering in the new era of cloud computing.
Oracle Future Product Disclaimer
The preceding is intended to outline our general product direction. It is intended for information purposes only, and may not be incorporated into any contract. It is not a commitment to deliver any material, code, or functionality, and should not be relied upon in making purchasing decisions. The development, release, timing, and pricing of any features or functionality described for Oracle’s products may change and remains at the sole discretion of Oracle Corporation.
Oracle Forward-Looking Statements
Statements in this article relating to Oracle’s future plans, expectations, beliefs, and intentions are “forward-looking statements” and are subject to material risks and uncertainties. Many factors could affect Oracle’s current expectations and actual results, and could cause actual results to differ materially. A discussion of such factors and other risks that affect Oracle’s business is contained in Oracle’s Securities and Exchange Commission (SEC) filings, including Oracle’s most recent reports on Form 10-K and Form 10-Q under the heading “Risk Factors.” These filings are available on the SEC’s website or on Oracle’s website at oracle.com/investor
. All information in this article is current as of October 27, 2026 and Oracle undertakes no duty to update any statement in light of new information or future events.
NVIDIA Forward-Looking Statements
Certain statements in this press release including, but not limited to, statements as to: expectations with respect to growth, performance, availability, benefits and long-term value of NVIDIA’s products, services and technologies, and related trends and drivers; expectations with respect to NVIDIA’s third party arrangements, including with its collaborators and partners; expectations with respect to AI infrastructure capacity expansion and deployment, and related timing and benefits; expectations with respect to technology developments, and related trends and drivers; projected market growth and trends; expectations with respect to AI and related industries; and other statements that are not historical facts are forward-looking statements within the meaning of Section 27A of the Securities Act of 1933, as amended, and Section 21E of the Securities Exchange Act of 1934, as amended, which are subject to the “safe harbor” created by those sections based on management’s beliefs and assumptions and on information currently available to management and are subject to risks and uncertainties that could cause results to be materially different than expectations. Important factors that could cause actual results to differ materially include: global economic and political conditions; NVIDIA’s reliance on third parties to manufacture, assemble, package and test NVIDIA’s products; the impact of technological development and competition; development of new products and technologies or enhancements to NVIDIA’s existing products and technologies; market acceptance of NVIDIA’s products or NVIDIA’s partners’ products; design, manufacturing or software defects; changes in consumer preferences or demands; changes in industry standards and interfaces; unexpected loss of performance of NVIDIA’s products or technologies when integrated into systems; NVIDIA’s ability to realize the potential benefits of business investments or acquisitions; and changes in applicable laws and regulations, as well as other factors detailed from time to time in the most recent reports NVIDIA files with the Securities and Exchange Commission, or SEC, including, but not limited to, its Annual Report on Form 10-K and Quarterly Reports on Form 10-Q. Copies of reports filed with the SEC are posted on NVIDIA’s website and are available from NVIDIA without charge. These forward-looking statements are not guarantees of future performance and speak only as of the date hereof, and, except as required by law, NVIDIA disclaims any obligation to update these forward-looking statements to reflect future events or circumstances.
© 2026 NVIDIA Corporation. All rights reserved. NVIDIA, the NVIDIA logo, and other NVIDIA product and service names are trademarks and/or registered trademarks of NVIDIA Corporation in the U.S. and other countries and regions. Other company, product, and service names may be trademarks of the respective companies with which they are associated.
Media Contacts
Global contacts for media inquiries.
All Contacts
Stay Informed
Newsroom updates delivered to your inbox.
Subscribe
Corporate Information
Get Involved
News & Events
Sign Up for NVIDIA News
Subscribe
Follow NVIDIA
Facebook
LinkedIn
Instagram
YouTube
NVIDIA
USA - United States
Copyright © 2026 NVIDIA Corporation