Download as PDF September 28, 2026 Related Documents Audio Earnings Webcast 10-K Filing PDF HTML XBRL ZIP HTML Full-year revenue rises 12.5% to a record $74.4 million as operating income nearly doubles YoY and cash reaches $27.1 million; Company…
Download as PDF
September 28, 2026
Related Documents
Audio
Earnings Webcast
10-K Filing
PDF
HTML
XBRL
ZIP
HTML
Full-year revenue rises 12.5% to a record $74.4 million as operating income nearly doubles YoY and cash reaches $27.1 million; Company introduces fiscal 2027 guidance.
ENCINO, Calif., Sept. 28, 2026 (GLOBE NEWSWIRE) -- NETSOL Technologies, Inc. (Nasdaq: NTWK), a provider of AI-enabled solutions and services powering OEMs, dealerships and financial institutions to sell, finance and lease assets, reported its results for the fourth quarter of fiscal 2026 and full year ended June 30, 2026.
- Full-year revenue increased 12.5% to a record $74.4 million, exceeding guidance of $73 million; subscription and support revenue increased 8.7% to $35.8 million.
- Full-year gross margin increased 330 basis points to 52.6%; operating income nearly doubled to $6.9 million, with operating margin up 400 basis points to 9.3%.
- Full-year GAAP net income attributable to NETSOL was $2.95 million, or $0.25 per diluted share; consolidated net income increased 22.4% to $5.6 million.
- Full-year adjusted EBITDA increased 68.8% to $9.15 million on a consolidated basis and 61.0% to $6.01 million attributable to NETSOL shareholders.
- Full-year operating cash flow increased to $13.9 million from $0.4 million; year-end cash increased 56.3% to $27.1 million.
- Fourth-quarter revenue increased 12.5% to a record $20.7 million; subscription and support revenue increased 9.0% and services revenue increased 21.3%; gross margin expanded to 63.6% from 56.2%; operating income increased 40.2% to $4.5 million.
- Fiscal 2027 guidance: revenue growth of 13% to 16%; gross margin of approximately 50% or better; and consolidated adjusted EBITDA growth of 15% to 25%.
Fourth quarter fiscal 2026 financial results
Total net revenues for the fourth quarter of fiscal 2026 were $20.7 million, a quarterly record, compared with $18.4 million in the prior-year period, an increase of 12.5%. Total net revenues were $19.9 million on a constant currency basis.
Total subscription (SaaS and Cloud) and support revenues for the fourth quarter were $8.9 million, an increase of 9.0%, compared with $8.2 million in the prior-year period. Total subscription and support revenues on a constant currency basis were $8.2 million.
Services revenues for the fourth quarter were $11.7 million, an increase of 21.3%, compared with $9.7 million in the prior-year period. Services revenues on a constant currency basis were $11.6 million.
Gross profit for the fourth quarter was $13.2 million or 63.6% of net revenues, an increase of 27.3%, compared with $10.3 million or 56.2% of net revenues in the prior-year period. Gross profit for the fourth quarter was $12.5 million or 63.0% of net revenues as measured on a constant currency basis.
Income from operations for the fourth quarter was $4.5 million, an increase of 40.2%, compared with $3.2 million in the prior-year period, representing an operating margin of 21.6% compared with 17.4%. Income from operations for the fourth quarter was $4.1 million on a constant currency basis.
GAAP net income attributable to NETSOL was $3.8 million or $0.32 per diluted share, an increase of 45.9%, compared with $2.6 million or $0.22 per diluted share in the prior-year period.
Non-GAAP EBITDA was $4.7 million, compared with $4.7 million in the prior-year period (see note regarding “Use of Non-GAAP Financial Measures,” below).
Full fiscal year ended June 30, 2026 financial results
Total net revenues for the full fiscal year ended June 30, 2026, were $74.4 million, an increase of 12.5%, compared with $66.1 million in the prior year. Total net revenues were $73.4 million on a constant currency basis.
Total subscription (SaaS and Cloud) and support revenues for the full fiscal year were $35.8 million, an increase of 8.7%, compared with $32.9 million in the prior year, and represented approximately 48% of total net revenues. Total subscription and support revenues on a constant currency basis were $35.3 million.
Total services revenues were $33.6 million compared with $32.6 million in the prior year, representing a 3.3% increase, as the Company progressed major implementations. Total services revenues on a constant currency basis were $33.2 million.
Total license fees were $5.0 million compared with $0.6 million in the prior year, and included approximately $4.7 million associated with the renewal and amendment of an existing Transcend customer agreement. Total license fees on a constant currency basis were $4.9 million.
Gross profit for the full fiscal year was $39.1 million or 52.6% of net revenues, an increase of 20.2%, compared with $32.6 million or 49.3% of net revenues in the prior year. Gross profit was $38.2 million or 52.1% of net revenues as measured on a constant currency basis.
Income from operations for the full fiscal year was $6.9 million, an increase of 98.4%, compared with $3.5 million in the prior year, representing an operating margin of 9.3% compared with 5.3%. Income from operations was $6.4 million on a constant currency basis.
GAAP net income attributable to NETSOL for the full fiscal year totaled $2.95 million or $0.25 per diluted share, compared with $2.9 million or $0.25 per diluted share in the prior year. Fiscal 2025 included a $1.30 million gain on foreign currency exchange transactions and $1.87 million of interest income, while fiscal 2026 included a $0.39 million foreign currency exchange loss and $1.07 million of interest income; net income attributable to non-controlling interests increased to $2.65 million from $1.65 million. Consolidated net income increased 22.4% to $5.6 million. On a constant currency basis, GAAP net income attributable to NETSOL totaled $2.4 million or $0.21 per diluted share.
Non-GAAP EBITDA for the full fiscal year was $8.0 million, an increase of 22.8%, compared with $6.5 million in the prior year. Consolidated adjusted EBITDA was $9.15 million, an increase of 68.8%, compared with $5.42 million, and adjusted EBITDA attributable to NETSOL was $6.01 million, an increase of 61.0%, compared with $3.73 million in the prior year (see note regarding “Use of Non-GAAP Financial Measures,” below and Schedule 4).
Remaining performance obligations were $49.1 million at June 30, 2026, of which approximately $22.5 million is expected to be recognized as revenue within the next 12 months.
Cash flow and balance sheet
Net cash provided by operating activities for the full fiscal year was $13.9 million, compared with $0.4 million in the prior year. The increase included approximately $6.5 million contributed by contract liabilities reflecting advance billings. The Company invested $2.0 million in property and equipment and $2.7 million in capitalized software development during the year.
Cash and cash equivalents were $27.1 million at June 30, 2026, an increase of 56.3%, compared with $17.4 million at June 30, 2025. Working capital was $29.2 million at June 30, 2026. NETSOL stockholders’ equity was $41.6 million or $3.50 per share at June 30, 2026. Total debt and finance lease obligations were $8.4 million, with $0.21 million in long-term maturities.
Management commentary
Najeeb Ghauri, Founder and Chief Executive Officer of NETSOL Technologies, Inc., commented:
“Fiscal 2026 marked a clear step forward for NETSOL. We delivered record annual revenue, expanded margins and finished the year with strong operational momentum. The rebound from our first quarter demonstrates the capability and resilience of our teams, while the continued growth of subscription and support revenue reinforces the value of our long-term customer relationships.”
“We enter fiscal 2027 with real momentum, with product offerings that are doing more for our customers than at any point in our history, and with the visibility to introduce full-year guidance alongside our fourth quarter results. Our focus is on making growth more predictable and on translating consolidated performance more effectively into value for NETSOL shareholders. We will do that through the Transcend platform and practical AI across our products and operations, through selective partnerships and acquisitions where we see a clear strategic and financial return, and by evaluating structural options that may reduce the economic impact of minority interests over time."
Asad Ghauri, Global Head of Sales and Group Managing Director of Europe at NETSOL Technologies, Inc., commented:
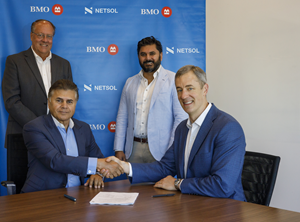
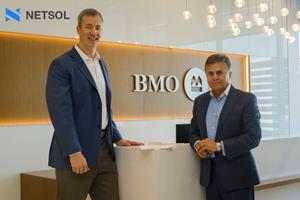
"Customer engagement remained strong across our established markets during the year, with growing demand for modern cloud platforms, AI-enabled finance solutions and digital retail. We expanded relationships for Transcend Finance with a number of existing customers, including a tier-one global auto captive, a long-standing customer and strategic partner of three decades, with whom we signed a $50 million contract extension; a tier-one U.S.-based auto captive that went live in China; Toyota Leasing Thailand, which upgraded its platform; a tier-one multinational bank in the United Kingdom that renewed its agreement; and most recently, BMO Equipment Finance in the United States, which moved from its legacy platform to Transcend Finance."
"We progressed major implementations and developed new opportunities across automotive finance, equipment finance and digital retail on the Transcend platform. Our commercial priorities are disciplined conversion of a qualified pipeline, expansion within our installed base and partnerships that extend our reach without compromising execution quality."
Sardar Abubakr, Chief Financial Officer of NETSOL Technologies, Inc., commented:
"Fiscal 2026 produced the strongest operating performance in several years. Revenue increased 12.5%, operating income nearly doubled and operating cash flow reached $13.9 million. The quality of the result is also important: fiscal 2025 included a $1.30 million foreign exchange gain and $1.87 million of interest and investment income, while fiscal 2026 included a $0.39 million foreign exchange loss and lower interest income. Despite that year-over-year headwind and a higher allocation to non-controlling interests, consolidated net income increased 22.4%."
“We ended the year with $27.1 million in cash and greater capacity to invest in products, customer delivery and selected strategic opportunities. Our efficiency program will continue through fiscal 2027. As of June 30, we employed approximately 1,370 people, compared with approximately 1,460 a year earlier, while revenue grew 12.5%. We are reviewing workforce structure, utilization, location strategy and the skills an AI-enabled delivery model requires. This is not a headcount-reduction exercise; it is a disciplined review of how we deploy people and direct capacity toward product innovation, customer delivery and growth.”
"For fiscal 2027, NETSOL currently expects total net revenue growth of 13% to 16% over fiscal 2026; gross margin of approximately 50% or better; and consolidated adjusted EBITDA growth of 15% to 25%, corresponding to approximately $10.5 million to $11.4 million. Our financial agenda for fiscal 2027 is straightforward: grow recurring revenue and its visibility, protect and improve margins, apply AI in practical and measurable ways, focus the portfolio on our highest-return opportunities, and strengthen the conversion of consolidated profit into value for NETSOL shareholders.”
Beginning with fiscal 2026 results, the Company is reporting contracted revenue, which it defines as revenue expected under existing signed agreements plus management's best estimate of change requests from those customers. Contracted revenue was approximately $60 million at June 30, 2026. Contracted revenue differs from remaining performance obligations, which include only amounts contracted under applicable accounting standards; it is not a GAAP measure, annual recurring revenue, backlog or a guaranteed revenue floor. The Company intends to report contracted revenue each quarter and to grow above it through Transcend deployments, expansion within existing customers, new customers and partnerships.
Conference call
NETSOL Technologies management will hold a conference call Monday, September 28, 2026, at 9:00 am Eastern Time (6:00 am Pacific Time) to discuss its results for the fourth quarter and full year ended June 30, 2026. A question-and-answer session will follow management’s prepared remarks.
Participant dial-in: 1-877-407-0789 or 1-201-689-8562
A live webcast of the conference call will be available here
. Information about the webcast will also be available on the Investor Relations section of NETSOL’s website at www.netsoltech.com
.
Telephone replay: Telephone replays will be made available approximately 3 hours after conference end time.
Replay dial-in: 1-844-512-2921 or 1-412-317-6671.
Replay expiration: Monday, October 12, 2026 at 11:59 PM ET.
Access ID: 13762610.
About NETSOL Technologies
NETSOL Technologies delivers state-of-the-art solutions for the asset finance and leasing industry, serving automotive and equipment OEMs, auto captives and financial institutions across over 30 countries. Since its inception in 1997, NETSOL has been at the cutting edge of technology, pioneering innovations with its asset finance solutions, and today leverages advanced AI and cloud services to meet the complex needs of the global market. Renowned for its deep industry expertise, customer-centric approach and commitment to excellence, NETSOL fosters strong partnerships with its customers, ensuring their success in an ever-evolving landscape. With a rich history of innovation, ethical business practices and a focus on sustainability, NETSOL is dedicated to empowering businesses worldwide, securing its position as the trusted partner for leading firms around the globe.
Forward-Looking Statements
This press release contains forward-looking statements within the meaning of the Private Securities Litigation Reform Act of 1995 regarding the company's products and services, expectations for future operations, fiscal 2027 guidance for revenues, gross margin and adjusted EBITDA, contracted revenue, remaining performance obligations and revenue visibility, AI-enabled products and productivity initiatives, the Company's efficiency program, capital allocation, potential strategic partnerships and acquisitions, potential structural actions concerning non-controlling interests, and other statements that are not historical facts. These forward-looking statements may be identified by terminology such as "expects," "anticipates," "believes," "intends," "plans," "projects," "targets," "guidance," "assumes," and similar expressions. These statements are not guarantees of future performance and are subject to a number of risks, uncertainties, and assumptions that are difficult to predict. The fiscal 2027 outlook assumes continued subscription growth, execution of contracted implementations, disciplined cost management and no material acquisitions. Factors that could cause actual results to differ materially include, but are not limited to, the timing of customer agreements, go-lives, contract signings and renewals, implementation milestones, the rate of adoption of AI-enabled product capabilities, foreign currency volatility, customer concentration and customer decisions, the timing of advance billings and collections, investment levels, competition, geopolitical and macroeconomic conditions, and other factors discussed in NETSOL's most recent Annual Report on Form 10-K and subsequent Quarterly Reports on Form 10-Q filed with the U.S. Securities and Exchange Commission. Readers are cautioned not to place undue reliance on these forward-looking statements, which speak only as of the date hereof. NETSOL undertakes no obligation to publicly update or revise any forward-looking statement, whether as a result of new information, future events, or otherwise, except as required by law.
Use of Non-GAAP financial measures
This press release includes references to non-GAAP EBITDA, non-GAAP adjusted EBITDA, gross, and non-GAAP adjusted EBITDA, net, which are non-GAAP financial measures. Non-GAAP EBITDA is net income before non-controlling interest, income taxes, depreciation and amortization, interest expense and interest income. Non-GAAP adjusted EBITDA, gross, further excludes foreign currency exchange gains and losses and non-cash stock-based compensation; non-GAAP adjusted EBITDA, net, further deducts the adjusted EBITDA attributable to non-controlling interests. Management believes these measures assist investors in evaluating operating performance and comparing results across periods. Non-GAAP measures should be considered in addition to, and not as substitutes for, the most directly comparable GAAP measures. Reconciliations of these measures to net income attributable to NETSOL, the most directly comparable GAAP measure, together with an explanation of how management uses these measures, are provided in Schedule 4 of the financial tables that follow.
**Investor Relations Contact:
**Investor Relations
(818) 222-9195
[email protected]

Source: NETSOL Technologies Inc.
Released September 28, 2026
CONTACT US
Corporate Headquarters
16000 Ventura Blvd
Suite 770
Encino, CA 91436
USA
[+1 818 222 9195](tel:+1 818 222 9195)
[email protected]
COMPANY
Products
Services
SUPPORT
Encino [+1 818 222 9195](tel:+1 818 222 9195)
London [+44 0 1403 282300](tel:+44 0 1403 282300)
Sydney [+61 2 9221 2081](tel:+61 2 9221 2081)
Beijing [+86 10 6568 2256](tel:+86 10 6568 2256)
Shanghai [+86 21 6020 6700](tel:+86 21 6020 6700)
Bangkok [+66 2685 3552 3](tel:+66 2685 3552 3)
Jakarta [+62 21 2929 5074](tel:+62 21 2929 5074)
Lahore [+92 42 111 44 88 00](tel:+92 42 111 44 88 00)
INVESTORS
Insights
FOLLOW
© 2026 NETSOL Technologies, Inc. All Rights Reserved. Terms of Use
| Privacy Policy
| Human Rights Policy
| Modern Slavery Act