November 4, 2026 Consolidated operating margin exceeds the high end of guidance Enterprise non-GAAP gross margin expands 220 basis points year over year to 53.2% Enterprise end customer demand remains strong while supply availability is…
November 4, 2026
Consolidated operating margin exceeds the high end of guidance
Enterprise non-GAAP gross margin expands 220 basis points year over year to 53.2%
Enterprise end customer demand remains strong while supply availability is constraining topline
ARR from subscription and services increases approximately 12% year over year to $42.5 million
Q3 share repurchases of $15 million for a total of over $131 million repurchased since the beginning of 2024
SAN JOSE, Calif.--(BUSINESS WIRE)-- NETGEAR, Inc. (NASDAQ: NTGR), a global leader in intelligent networking solutions designed to power extraordinary experiences, today reported financial results for the third quarter ended September 27, 2026.
Q3 2026
-
Net revenue of $167.3 million, down 9.3% as compared to Q3 prior year
-
GAAP gross margin of 40.1%, up 100 basis points year over year
Non-GAAP gross margin of 41.3%, up 170 basis points year over year
- GAAP operating income of $(13.7) million compared to $(7.1) million from Q3 prior year
Non-GAAP operating income of $3.3 million compared to $3.8 million from Q3 prior year
- GAAP EPS of $(0.45) compared to $(0.17) from Q3 prior year
Non-GAAP EPS of $0.13 compared to $0.12 from Q3 prior year
The accompanying schedules provide a reconciliation of financial measures computed on a GAAP basis to financial measures computed on a non-GAAP basis.
CJ Prober, Chief Executive Officer, commented, “We are encouraged by the continued progress in our transformation into a software-differentiated, Enterprise-led company. Our Enterprise business continues to benefit from strong customer demand, particularly across our line of ProAV managed switches, while our expanding software and services capabilities are strengthening our competitive differentiation and creating new opportunities for long-term profitable growth. While the underlying fundamentals of our Enterprise business continue to improve, manufacturing challenges at a key production partner have constrained our ability to fully translate customer demand into revenue during the quarter. We are working closely with our partner to improve production output and product availability and expect to be back to normal production levels by Q1 2027. When combined with our supply constraints, our strategy to harvest our consumer Service Provider products and optimize the Consumer segment for gross profit are intentionally constraining our topline revenue. We remain confident in our strategic direction and remain focused on translating the progress we are making across our business into sustainable growth, greater profitability, and long-term shareholder value.”
Bryan Murray, Chief Financial Officer, added, “Our third-quarter results demonstrate the continued progress toward a structurally more profitable business model, with Enterprise accounting for over 54% of our revenue and now approximately 70% of non-GAAP gross profit, underscoring the financial benefits of our strategic transformation. We delivered non-GAAP operating income of $3.3 million and a non-GAAP operating margin of 2.0%, exceeding the high end of our guidance range, while consolidated non-GAAP gross margin expanded approximately 170 basis points year over year to 41.3%. These results reflect the growing contribution from our higher-margin Enterprise business and continued financial discipline, even as manufacturing constraints impacted shipments during the quarter. We also maintained a strong balance sheet, ending the quarter with over $242 million in cash and short-term investments, while repurchasing approximately $15 million of common stock during Q3, bringing our cumulative share repurchases since the beginning of 2024 to more than $131 million. Looking ahead, we remain focused on improving manufacturing execution, managing Consumer profitability, and maintaining the financial flexibility to invest in our strategic priorities and drive sustainable long-term value creation.”
Enterprise Segment Results
- Revenue was $90.7 million, down 0.1% year over year
- Non-GAAP gross margin was 53.2%, up 220 basis points year over year
- Non-GAAP contribution margin was 24.5%, down 40 basis points year over year
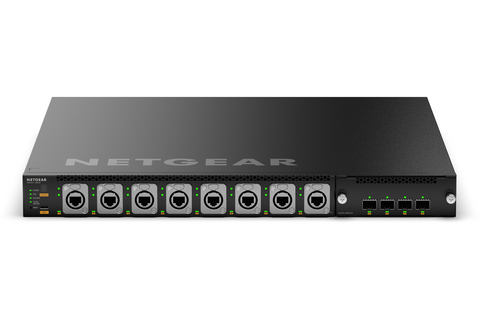
Mr. Prober continued, “Our Enterprise business continues to demonstrate encouraging underlying momentum, particularly across our Pro AV line of managed switches. Despite our supply constraints, end customer sell through increased approximately 6% year over year globally, led by double-digit growth from our managed switch products, with even more positive trends in both the Americas and Europe. While sell through and our reported revenue does not fully reflect end customer demand, these trends reinforce our confidence in the competitiveness of our solutions and the opportunities ahead. Enterprise backlog exited Q3 more than 2.5x times higher than the end of Q2, which was already at an elevated level due to shortages in the prior quarter as well. Our most immediate priority is restoring reliable product availability following the factory transition at one of our key manufacturing partners given we have secured critical components to support our production plans. Given the elevated cost of supply and our pricing leverage in this category, we implemented an additional price increase for our Enterprise products that will take effect in November.”
Consumer Segment Results
- Revenue was $76.6 million, down 18.2% year over year
- Non-GAAP gross margin was 27.2%, down 120 basis points year over year
- Non-GAAP contribution margin was (1.9)%, down 390 basis points year over year
Mr. Prober continued, “In Consumer, we continued to execute our transformation with discipline, prioritizing gross profit in core home networking while managing the service provider business for value as we navigate the higher cost supply environment. Partner manufacturing challenges also impacted the availability of supply for a portion of our Consumer router product portfolio. Although revenue remained constrained for these reasons, the recurring revenue component of our home networking business continued to perform well, driving 12% year-over-year growth in our total annual recurring revenue. Consistent with the pricing actions in our Enterprise business, we are implementing a price increase for the products in this segment that will take effect in early 2027. In Q3, we also implemented a restructuring to drive efficiencies in this segment, and those cost reduction efforts will benefit our financial results beginning in 2027. We also continue to monitor developments in the U.S. regulatory environment that could positively influence the competitive landscape for home networking products. NETGEAR's position as a trusted U.S.-based company, our focus on security, and our established brands provide a strong foundation for capitalizing on these regulatory tail winds. Looking ahead, we remain confident in the strength of our Consumer brands, product portfolio, innovation roadmap and market position. While competitive pressures and rising component costs are expected to persist in the near term, we remain focused on optimizing profitability, expanding our higher-margin recurring services offerings, and positioning the business to capitalize on opportunities from the evolving regulatory landscape.”
Business Outlook
Mr. Murray continued, "Within Enterprise, we continue to see encouraging underlying demand, particularly for our Pro AV managed switches. However, our near-term revenue outlook remains constrained by manufacturing output and the timing of product availability, which we expect to persist into the first quarter of 2027. Our guidance reflects the uncertainty surrounding improvements in production execution which we expect will still fall short of customer demand for the fourth quarter. Within Consumer, we expect to continue to optimize this business for gross profit with increasing impact from component costs, with some additional impact from supply constraints. For service provider and related products, we expect revenue of approximately $17 million and, while it reflects our focus on optimizing contribution profits, this would represent an approximate 28% year over year decline for this category. Taking these factors into account, we expect fourth-quarter net revenue of $160 million to $175 million.
Turning to profitability, we anticipate approximately 150 basis points of consolidated gross margin pressure in the fourth quarter compared to the prior quarter, primarily driven by rising memory costs and increasing transportation costs associated with our production recovery efforts. While our pricing actions and cost mitigation efforts have offset the rising component cost headwinds within the Enterprise business, we expect elevated component costs to continue weighing on margins within the Consumer business in the fourth quarter. In addition, ongoing manufacturing challenges could affect our product mix and the timing of shipments, creating further uncertainty around near-term gross margin performance. Taking these factors into account, we expect fourth-quarter GAAP operating margin to be in the range of (8.7)% to (5.7)% and non-GAAP operating margin to be in the range of 0% to 3%. Our GAAP tax expense is expected to be in the range of a benefit of $0.5 million to an expense of $0.5 million, and our non-GAAP tax expense is expected to be in the range of zero to $1.0 million for the fourth quarter of 2026.”
A reconciliation between the Business Outlook on a GAAP and non-GAAP basis is provided in the following table:
|
|
|
|
|
|
|
Three months ending |
|
|
|
|
December 31, 2026 |
|
|
| (In millions, except for percentage data) |
|
Operating Margin Rate |
|
Tax Expense |
|
|
|
|
|
| GAAP |
|
(8.7)% - (5.7)% |
|
$(0.5) - $0.5 |
| Estimated adjustments for1: |
|
|
|
|
| Stock-based compensation expense |
|
6.3% |
|
- |
| Amortization of intangible assets |
|
0.8% |
|
- |
| Restructuring and other charges |
|
1.6% |
|
- |
| Non-GAAP tax adjustments |
|
- |
|
$0.5 |
| Non-GAAP |
|
0.0% - 3.0% |
|
$0.0 - $1.0 |
|
|
|
|
|
| 1 Business outlook does not include estimates for any currently unknown income and expense items which, by their nature, could arise late in a quarter, including: litigation reserves, net; acquisition-related charges; impairment charges; restructuring and other charges and discrete tax benefits or detriments that cannot be forecasted (e.g., windfalls or shortfalls from equity awards or items related to the resolution of uncertain tax positions). New material income and expense items such as these could have a significant effect on our guidance and future GAAP results. |
|
|
|
|
Investor Conference Call / Webcast Details
NETGEAR will review the third quarter results and discuss management's expectations for the fourth quarter of 2026 today, Wednesday, November 4, 2026, at 5 p.m. ET (2 p.m. PT). The toll-free dial-in number for the live audio call is (833) 461-5787. The international dial-in number for the live audio call is (585) 542-9983. The conference ID for the call is 677 851 425. A live webcast of the conference call will be available on NETGEAR's Investor Relations website at http://investor.netgear.com
. A replay of the call will be available via the web at http://investor.netgear.com
.
About NETGEAR, Inc.
Founded in 1996 and headquartered in the USA, NETGEAR® (NASDAQ: NTGR) is a global leader in innovative networking technologies for businesses, homes, and service providers. NETGEAR delivers a wide range of award-winning, intelligent solutions designed to unleash the full potential of connectivity and power extraordinary experiences. For businesses, NETGEAR offers reliable, easy-to-use, high-performance networking solutions, including switches, routers, access points, software, and AV over IP technologies, tailored to meet the diverse needs of small and medium enterprises.
© 2026 NETGEAR, Inc. NETGEAR and the NETGEAR logo are trademarks or registered trademarks of NETGEAR, Inc. and its affiliates in the United States and/or other countries. Other brand and product names are trademarks or registered trademarks of their respective holders. The information contained herein is subject to change without notice. NETGEAR shall not be liable for technical or editorial errors or omissions contained herein. All rights reserved.
Source: NETGEAR-F
Safe Harbor Statement under the Private Securities Litigation Reform Act of 1995 for NETGEAR, Inc.:
This press release contains forward-looking statements within the meaning of the U.S. Private Securities Litigation Reform Act of 1995. The words “anticipate,” “expect,” “believe,” “will,” “may,” “should,” “estimate,” “project,” “outlook,” “forecast” or other similar words are used to identify such forward-looking statements. However, the absence of these words does not mean that the statements are not forward-looking. The forward-looking statements represent NETGEAR, Inc.’s expectations or beliefs concerning future events based on information available at the time such statements were made and include statements regarding: NETGEAR’s future operating performance and financial condition, including expectations regarding growth, revenue, operating margin and gross margin; creating long-term value for shareholders; positioning NETGEAR for long term success; long-term potential and profitable growth; continued end user demand for NETGEAR’s ProAV line of managed switches; revenue from service provider and related products; expectations regarding continuing market demand for the NETGEAR’s products and services; and expectations regarding expected tax benefits or tax expenses. These statements are based on management's current expectations and are subject to certain risks and uncertainties, including the following: future demand for NETGEAR’s products and services may be lower than anticipated; NETGEAR may be unsuccessful, or experience delays, in manufacturing and distributing its new and existing products and services; consumers may choose not to adopt NETGEAR’s new product and services offerings or adopt competing products and services; NETGEAR may fail to manage costs, including the cost of key components, the cost of air freight and ocean freight, and the cost of developing new products and manufacturing and distribution of its existing offerings; NETGEAR may fail to successfully continue to effect operating expense savings; changes in the level of NETGEAR's cash resources and NETGEAR’s planned usage of such resources; changes in NETGEAR’s stock price and developments in the business that could increase NETGEAR’s cash needs; fluctuations in foreign exchange rates; loss of services of key personnel may affect NETGEAR’s ability to executive on business strategy effectively; and the actions and financial health of NETGEAR’s customers, including NETGEAR’s ability to collect receivables as they become due. Further, certain forward-looking statements are based on assumptions as to future events that may not prove to be accurate. Therefore, actual outcomes and results may differ materially from what is expressed or forecast in such forward-looking statements. Further information on potential risk factors that could affect NETGEAR and its business are detailed in NETGEAR’s periodic filings with the Securities and Exchange Commission, including, but not limited to, those risks and uncertainties listed in the section entitled "Part II - Item 1A. Risk Factors" in NETGEAR’s quarterly report on Form 10-Q for the fiscal quarter ended June 28, 2026, filed with the Securities and Exchange Commission on August 6, 2026. Given these circumstances, you should not place undue reliance on these forward-looking statements. NETGEAR undertakes no obligation to release publicly any revisions to any forward-looking statements contained herein to reflect events or circumstances after the date hereof or to reflect the occurrence of unanticipated events, except as required by law.
Non-GAAP Financial Information:
To supplement our unaudited selected financial data presented on a basis consistent with Generally Accepted Accounting Principles (“GAAP”), we disclose certain non-GAAP financial measures that exclude certain charges, including non-GAAP gross profit, non-GAAP gross margin, non-GAAP research and development, non-GAAP sales and marketing, non-GAAP general and administrative, non-GAAP total operating expenses, non-GAAP operating income (loss), non-GAAP operating margin, non-GAAP other income (expenses), net, non-GAAP net income (loss) and non-GAAP net income (loss) per diluted share, as well as segment gross profit, segment gross margin, segment operating expenses (consisting of segment research and development, and sales and marketing), segment contribution income (loss) and segment contribution margin. These supplemental measures exclude adjustments for amortization of intangible assets, stock-based compensation expense, acquisition related expenses, restructuring and other charges, litigation reserves, net, gain/loss on investments and others, and adjust for effects related to non-GAAP tax adjustments. These non-GAAP measures are not in accordance with or an alternative for GAAP, and may be different from non-GAAP measures used by other companies. We believe that these non-GAAP measures have limitations in that they do not reflect all of the amounts associated with our results of operations as determined in accordance with GAAP and that these measures should only be used to evaluate our results of operations in conjunction with the corresponding GAAP measures. The presentation of this additional information is not meant to be considered in isolation or as a substitute for the most directly comparable GAAP measures. We compensate for the limitations of non-GAAP financial measures by relying upon GAAP results to gain a complete picture of our performance.
In calculating non-GAAP financial measures, we exclude certain items to facilitate a review of the comparability of our operating performance on a period-to-period basis because such items are not, in our view, related to our ongoing operational performance. We use non-GAAP measures to evaluate the operating performance of our business, for comparison with forecasts and strategic plans, and for benchmarking performance externally against competitors. In addition, management’s incentive compensation is determined using certain non-GAAP measures. Since we find these measures to be useful, we believe that investors benefit from seeing results “through the eyes” of management in addition to seeing GAAP results. We believe that these non-GAAP measures, when read in conjunction with our GAAP financials, provide useful information to investors by offering:
- the ability to make more meaningful period-to-period comparisons of our on-going operating results;
- the ability to better identify trends in our underlying business and perform related trend analyses;
- a better understanding of how management plans and measures our underlying business; and
- an easier way to compare our operating results against analyst financial models and operating results of competitors that supplement their GAAP results with non-GAAP financial measures.
The following are explanations of the adjustments that we incorporate into non-GAAP measures, as well as the reasons for excluding them in the reconciliations of these non-GAAP financial measures:
Amortization of intangible assets consists primarily of non-cash charges that can be impacted by, among other things, the timing and magnitude of acquisitions. We consider our operating results without these charges when evaluating our ongoing performance and forecasting our earnings trends, and therefore exclude such charges when presenting non-GAAP financial measures. We believe that the assessment of our operations excluding these costs is relevant to our assessment of internal operations and comparisons to the performance of our competitors.
Stock-based compensation expense consists of non-cash charges for the estimated fair value of restricted stock units and shares under the employee stock purchase plan granted to employees. We believe that the exclusion of these charges provides for more accurate comparisons of our operating results to peer companies due to the varying available valuation methodologies, subjective assumptions and the variety of award types. In addition, we believe it is useful to investors to understand the specific impact stock-based compensation expense has on our operating results.
Other items consist of certain items that are the result of either unique or unplanned events, including, when applicable: acquisition related expenses, restructuring and other charges, litigation reserves, net, and gain/loss on investments and others. It is difficult to predict the occurrence or estimate the amount or timing of these items in advance. Although these events are reflected in our GAAP financial statements, these unique transactions may limit the comparability of our on-going operations with prior and future periods. The amounts result from events that often arise from unforeseen circumstances, which often occur outside of the ordinary course of continuing operations. Therefore, the amounts do not accurately reflect the underlying performance of our continuing business operations for the period in which they are incurred.
Non-GAAP tax adjustments consist of adjustments that we incorporate into non-GAAP measures in order to provide a more meaningful measure on non-GAAP net income (loss). We believe providing financial information with and without the income tax effects relating to our non-GAAP financial measures, as well as adjustments for valuation allowances on deferred tax assets, provides our management and users of the financial statements with better clarity regarding both current period performance and the on-going performance of our business. Non-GAAP income tax expense (benefit) is computed on a current and deferred basis with non-GAAP income (loss) consistent with use of non-GAAP income (loss) as a performance measure. The Non-GAAP tax provision (benefit) is calculated by adjusting the GAAP tax provision (benefit) for the impact of the non-GAAP adjustments, with specific tax provisions such as state income tax and Base-erosion and Anti-Abuse Tax recomputed on a non-GAAP basis, as well as adjustments for valuation allowances on deferred tax assets. The tax valuation allowance is a non-cash adjustment primarily reflecting our expectations of, and assumptions as to, future operating results and applicable tax laws, that are not directly attributable to the current quarter’s operating performance. For interim periods, the non-GAAP income tax provision (benefit) is calculated based on the forecasted annual non-GAAP tax rate before discrete items and adjusted for interim discrete items.
|
|
|
|
|
|
|
|
|
|
|
|
|
|
|
|
|
|
| NETGEAR, INC.CONDENSED CONSOLIDATED BALANCE SHEETS(In thousands)(Unaudited) |
|
|
|
|
|
|
|
|
|
|
|
|
|
|
|
|
|
|
|
|
September 27, 2026 |
|
|
|
December 31, 2025 |
|
|
|
|
|
|
|
|
|
|
| ASSETS |
|
|
|
|
|
|
|
|
| Current assets: |
|
|
|
|
|
|
|
|
| Cash and cash equivalents |
|
$ |
178,420 |
|
|
$ |
209,904 |
|
| Short-term investments |
|
|
63,672 |
|
|
|
113,132 |
|
| Accounts receivable, net |
|
|
156,357 |
|
|
|
142,045 |
|
| Inventories |
|
|
169,366 |
|
|
|
176,456 |
|
| Prepaid expenses and other current assets |
|
|
38,742 |
|
|
|
31,745 |
|
| Total current assets |
|
|
606,557 |
|
|
|
673,282 |
|
| Property and equipment, net |
|
|
24,188 |
|
|
|
26,001 |
|
| Operating lease right-of-use assets |
|
|
28,887 |
|
|
|
36,715 |
|
| Intangible assets, net |
|
|
34,228 |
|
|
|
38,480 |
|
| Goodwill |
|
|
45,022 |
|
|
|
45,022 |
|
| Other non-current assets |
|
|
16,376 |
|
|
|
16,771 |
|
| Total assets |
|
$ |
755,258 |
|
|
$ |
836,271 |
|
|
|
|
|
|
|
|
|
|
| LIABILITIES AND STOCKHOLDERS’ EQUITY |
|
|
|
|
|
|
|
|
| Current liabilities: |
|
|
|
|
|
|
|
|
| Accounts payable |
|
$ |
49,272 |
|
|
$ |
43,749 |
|
| Accrued employee compensation |
|
|
21,414 |
|
|
|
34,731 |
|
| Other accrued liabilities |
|
|
147,769 |
|
|
|
144,028 |
|
| Deferred revenue |
|
|
25,207 |
|
|
|
26,904 |
|
| Income taxes payable |
|
|
1,207 |
|
|
|
809 |
|
| Total current liabilities |
|
|
244,869 |
|
|
|
250,221 |
|
| Non-current income taxes payable |
|
|
7,621 |
|
|
|
7,176 |
|
| Non-current operating lease liabilities |
|
|
31,782 |
|
|
|
41,016 |
|
| Other non-current liabilities |
|
|
32,516 |
|
|
|
40,035 |
|
| Total liabilities |
|
|
316,788 |
|
|
|
338,448 |
|
| Stockholders’ equity: |
|
|
|
|
|
|
|
|
| Preferred stock: $0.001 par value; 5,000,000 shares authorized; none issued or outstanding |
|
|
— |
|
|
|
— |
|
| Common stock: $0.001 par value; 200,000,000 shares authorized; shares issued and outstanding: 26,676,847 as of September 27, 2026 and 27,943,198 as of December 31, 2025 |
|
|
27 |
|
|
|
28 |
|
| Additional paid-in capital |
|
|
1,068,880 |
|
|
|
1,036,545 |
|
| Accumulated other comprehensive income (loss) |
|
|
(140 |
) |
|
|
196 |
|
| Accumulated deficit |
|
|
(630,297 |
) |
|
|
(538,946 |
) |
| Total stockholders’ equity |
|
|
438,470 |
|
|
|
497,823 |
|
| Total liabilities and stockholders’ equity |
|
$ |
755,258 |
|
|
$ |
836,271 |
|
|
|
|
|
|
|
|
|
|
|
|
|
|
|
|
|
|
|
|
|
|
|
|
|
|
|
|
|
|
|
| NETGEAR, INC.CONDENSED CONSOLIDATED STATEMENTS OF OPERATIONS(In thousands, except per share and percentage data)(Unaudited) |
|
|
|
|
|
|
|
|
|
|
|
|
|
|
|
|
|
|
|
|
|
|
|
|
|
|
|
|
|
|
|
|
|
|
|
|
|
|
|
|
|
|
|
|
Three Months Ended |
|
|
|
|
|
|
|
|
|
|
|
Nine Months Ended |
|
|
|
|
|
|
|
|
September 27, 2026 |
|
|
|
June 28, 2026 |
|
|
|
September 28, 2025 |
|
|
|
September 27, 2026 |
|
|
|
September 28, 2025 |
|
|
|
|
|
|
|
|
|
|
|
|
|
|
|
|
|
|
|
|
|
|
| Net revenue |
|
$ |
167,345 |
|
|
$ |
168,562 |
|
|
$ |
184,561 |
|
|
$ |
494,726 |
|
|
$ |
517,153 |
|
| Cost of revenue |
|
|
100,252 |
|
|
|
100,776 |
|
|
|
112,309 |
|
|
|
295,545 |
|
|
|
324,597 |
|
| Gross profit |
|
|
67,093 |
|
|
|
67,786 |
|
|
|
72,252 |
|
|
|
199,181 |
|
|
|
192,556 |
|
| Gross margin |
|
|
40.1 |
% |
|
|
40.2 |
% |
|
|
39.1 |
% |
|
|
40.3 |
% |
|
|
37.2 |
% |
| Operating expenses: |
|
|
|
|
|
|
|
|
|
|
|
|
|
|
|
|
|
|
|
|
| Research and development |
|
|
22,288 |
|
|
|
22,332 |
|
|
|
23,328 |
|
|
|
66,285 |
|
|
|
62,482 |
|
| Sales and marketing |
|
|
33,031 |
|
|
|
33,310 |
|
|
|
33,762 |
|
|
|
98,011 |
|
|
|
92,856 |
|
| General and administrative |
|
|
19,921 |
|
|
|
19,804 |
|
|
|
20,619 |
|
|
|
58,908 |
|
|
|
59,372 |
|
| Litigation reserves, net |
|
|
— |
|
|
|
(1 |
) |
|
|
98 |
|
|
|
499 |
|
|
|
136 |
|
| Restructuring and other charges |
|
|
5,554 |
|
|
|
782 |
|
|
|
1,514 |
|
|
|
11,212 |
|
|
|
7,118 |
|
| Total operating expenses |
|
|
80,794 |
|
|
|
76,227 |
|
|
|
79,321 |
|
|
|
234,915 |
|
|
|
221,964 |
|
| Loss from operations |
|
|
(13,701 |
) |
|
|
(8,441 |
) |
|
|
(7,069 |
) |
|
|
(35,734 |
) |
|
|
(29,408 |
) |
| Operating margin |
|
|
(8.2 |
)% |
|
|
(5.0 |
)% |
|
|
(3.8 |
)% |
|
|
(7.2 |
)% |
|
|
(5.7 |
)% |
| Other income, net |
|
|
1,037 |
|
|
|
1,701 |
|
|
|
3,028 |
|
|
|
4,319 |
|
|
|
15,175 |
|
| Loss before income taxes |
|
|
(12,664 |
) |
|
|
(6,740 |
) |
|
|
(4,041 |
) |
|
|
(31,415 |
) |
|
|
(14,233 |
) |
| Provision (benefit) for income taxes |
|
|
(390 |
) |
|
|
513 |
|
|
|
736 |
|
|
|
1,152 |
|
|
|
3,006 |
|
| Net loss |
|
$ |
(12,274 |
) |
|
$ |
(7,253 |
) |
|
$ |
(4,777 |
) |
|
$ |
(32,567 |
) |
|
$ |
(17,239 |
) |
|
|
|
|
|
|
|
|
|
|
|
|
|
|
|
|
|
|
|
|
|
| Net loss per share |
|
|
|
|
|
|
|
|
|
|
|
|
|
|
|
|
|
|
|
|
| Basic |
|
$ |
(0.45 |
) |
|
$ |
(0.27 |
) |
|
$ |
(0.17 |
) |
|
$ |
(1.19 |
) |
|
$ |
(0.60 |
) |
| Diluted |
|
$ |
(0.45 |
) |
|
$ |
(0.27 |
) |
|
$ |
(0.17 |
) |
|
$ |
(1.19 |
) |
|
$ |
(0.60 |
) |
|
|
|
|
|
|
|
|
|
|
|
|
|
|
|
|
|
|
|
|
|
| Weighted average shares used to compute net loss per share: |
|
|
|
|
|
|
|
|
|
|
|
|
|
|
|
|
|
|
|
|
| Basic |
|
|
27,057 |
|
|
|
27,041 |
|
|
|
28,638 |
|
|
|
27,352 |
|
|
|
28,756 |
|
| Diluted |
|
|
27,057 |
|
|
|
27,041 |
|
|
|
28,638 |
|
|
|
27,352 |
|
|
|
28,756 |
|
|
|
|
|
|
|
|
|
|
|
|
|
|
|
|
|
|
|
|
|
|
|
|
|
|
|
|
|
|
|
| NETGEAR, INC.CONDENSED CONSOLIDATED STATEMENTS OF CASH FLOWS(In thousands)(Unaudited) |
|
|
|
|
|
|
|
|
|
|
|
Nine Months Ended |
|
|
|
|
|
|
|
|
September 27, 2026 |
|
|
|
September 28, 2025 |
|
|
|
|
|
|
|
|
|
|
| Cash flows from operating activities: |
|
|
|
|
|
|
|
|
| Net loss |
|
$ |
(32,567 |
) |
|
$ |
(17,239 |
) |
| Adjustments to reconcile net income (loss) to net cash provided by operating activities: |
|
|
|
|
|
|
|
|
| Depreciation and amortization |
|
|
11,186 |
|
|
|
5,109 |
|
| Stock-based compensation |
|
|
28,060 |
|
|
|
20,979 |
|
| Accretion of discounts and imputed interests, net |
|
|
2,010 |
|
|
|
(970 |
) |
| Deferred income taxes |
|
|
153 |
|
|
|
(214 |
) |
| Provision for excess and obsolete inventory |
|
|
5,641 |
|
|
|
2,878 |
|
| Other |
|
|
82 |
|
|
|
(171 |
) |
| Changes in assets and liabilities: |
|
|
|
|
|
|
|
|
| Accounts receivable, net |
|
|
(14,311 |
) |
|
|
(3,670 |
) |
| Inventories |
|
|
1,449 |
|
|
|
(6,901 |
) |
| Prepaid expenses and other assets |
|
|
(7,576 |
) |
|
|
1,329 |
|
| Accounts payable |
|
|
5,863 |
|
|
|
(936 |
) |
| Accrued employee compensation |
|
|
(13,316 |
) |
|
|
4,253 |
|
| Other accrued liabilities |
|
|
1,676 |
|
|
|
(10,093 |
) |
| Deferred revenue |
|
|
(1,501 |
) |
|
|
(2,898 |
) |
| Income taxes payable |
|
|
843 |
|
|
|
(9,365 |
) |
| Net cash used in operating activities |
|
|
(12,308 |
) |
|
|
(17,909 |
) |
| Cash flows from investing activities: |
|
|
|
|
|
|
|
|
| Purchases of short-term investments |
|
|
(40,197 |
) |
|
|
(89,579 |
) |
| Proceeds from maturities of short-term investments |
|
|
90,000 |
|
|
|
90,000 |
|
| Purchases of property and equipment |
|
|
(6,696 |
) |
|
|
(14,631 |
) |
| Purchases of long-term investments |
|
|
(60 |
) |
|
|
(165 |
) |
| Payments made in connection with business acquisitions, net of cash acquired |
|
|
— |
|
|
|
(12,185 |
) |
| Net cash provided by (used in) investing activities |
|
|
43,047 |
|
|
|
(26,560 |
) |
| Cash flows from financing activities: |
|
|
|
|
|
|
|
|
| Repurchases of common stock, including excise tax |
|
|
(48,033 |
) |
|
|
(35,662 |
) |
| Restricted stock unit withholdings |
|
|
(10,633 |
) |
|
|
(11,758 |
) |
| Proceeds from exercise of stock options |
|
|
— |
|
|
|
5,266 |
|
| Proceeds from issuance of common stock under employee stock purchase plan |
|
|
4,275 |
|
|
|
3,652 |
|
| Principal payments on deferred purchase price for acquisitions |
|
|
(7,834 |
) |
|
|
— |
|
| Net cash used in financing activities |
|
|
(62,225 |
) |
|
|
(38,502 |
) |
| Net decrease in cash and cash equivalents and restricted cash |
|
|
(31,486 |
) |
|
|
(82,971 |
) |
| Cash and cash equivalents and restricted cash, at beginning of period |
|
|
212,006 |
|
|
|
288,551 |
|
| Cash and cash equivalents and restricted cash, at end of period |
|
$ |
180,520 |
|
|
$ |
205,580 |
|
| Reconciliation of cash, cash equivalents, and restricted cash to the condensed consolidated balance sheets |
|
|
|
|
|
|
|
|
| Cash and cash equivalents at end of period |
|
$ |
178,420 |
|
|
$ |
203,480 |
|
| Restricted cash included within other non-current assets at end of period |
|
|
2,100 |
|
|
|
2,100 |
|
| Total cash, cash equivalents, and restricted cash at end of period shown in the condensed consolidated statements of cash flows |
|
$ |
180,520 |
|
|
$ |
205,580 |
|
|
|
|
|
|
|
|
|
|
|
|
|
|
|
|
|
|
|
|
|
|
|
|
|
|
|
|
|
|
| NETGEAR, INC.RECONCILIATIONS OF GAAP MEASURES TO NON-GAAP MEASURES(In thousands, except percentage data)(Unaudited) |
|
|
|
|
|
|
|
|
|
|
|
|
|
|
|
|
|
|
|
|
|
|
|
|
|
|
|
|
|
|
|
|
|
|
|
|
|
|
|
| STATEMENT OF OPERATIONS DATA: |
|
|
|
|
|
|
|
|
|
|
|
|
|
|
|
|
|
|
|
|
|
|
|
|
|
|
|
|
|
|
|
|
|
|
|
|
|
|
|
|
|
Three Months Ended |
|
|
|
|
|
|
|
|
|
|
|
Nine Months Ended |
|
|
|
|
|
|
|
September 27, 2026 |
|
|
|
June 28, 2026 |
|
|
|
September 28, 2025 |
|
|
|
September 27, 2026 |
|
|
|
September 28, 2025 |
|
|
|
|
|
|
|
|
|
|
|
|
|
|
|
|
|
|
|
|
|
| GAAP gross profit |
$ |
67,093 |
|
|
$ |
67,786 |
|
|
$ |
72,252 |
|
|
$ |
199,181 |
|
|
$ |
192,556 |
|
| GAAP gross margin |
|
40.1 |
% |
|
|
40.2 |
% |
|
|
39.1 |
% |
|
|
40.3 |
% |
|
|
37.2 |
% |
| Amortization of intangible assets |
|
1,415 |
|
|
|
1,416 |
|
|
|
180 |
|
|
|
4,249 |
|
|
|
180 |
|
| Stock-based compensation expense |
|
547 |
|
|
|
616 |
|
|
|
562 |
|
|
|
1,664 |
|
|
|
1,440 |
|
| Non-GAAP gross profit |
$ |
69,055 |
|
|
$ |
69,818 |
|
|
$ |
72,994 |
|
|
$ |
205,094 |
|
|
$ |
194,176 |
|
| Non-GAAP gross margin |
|
41.3 |
% |
|
|
41.4 |
% |
|
|
39.6 |
% |
|
|
41.5 |
% |
|
|
37.5 |
% |
|
|
|
|
|
|
|
|
|
|
|
|
|
|
|
|
|
|
|
|
| GAAP research and development |
$ |
22,288 |
|
|
$ |
22,332 |
|
|
$ |
23,328 |
|
|
$ |
66,285 |
|
|
$ |
62,482 |
|
| Stock-based compensation expense |
|
(1,535 |
) |
|
|
(1,557 |
) |
|
|
(1,483 |
) |
|
|
(4,195 |
) |
|
|
(3,075 |
) |
| Acquisition related expenses |
|
(244 |
) |
|
|
(244 |
) |
|
|
(286 |
) |
|
|
(732 |
) |
|
|
(286 |
) |
| Non-GAAP research and development |
$ |
20,509 |
|
|
$ |
20,531 |
|
|
$ |
21,559 |
|
|
$ |
61,358 |
|
|
$ |
59,121 |
|
|
|
|
|
|
|
|
|
|
|
|
|
|
|
|
|
|
|
|
|
| GAAP sales and marketing |
$ |
33,031 |
|
|
$ |
33,310 |
|
|
$ |
33,762 |
|
|
$ |
98,011 |
|
|
$ |
92,856 |
|
| Amortization of intangible assets |
|
(1 |
) |
|
|
(2 |
) |
|
|
— |
|
|
|
(4 |
) |
|
|
— |
|
| Stock-based compensation expense |
|
(2,743 |
) |
|
|
(2,712 |
) |
|
|
(2,450 |
) |
|
|
(7,720 |
) |
|
|
(5,579 |
) |
| Non-GAAP sales and marketing |
$ |
30,287 |
|
|
$ |
30,596 |
|
|
$ |
31,312 |
|
|
$ |
90,287 |
|
|
$ |
87,277 |
|
|
|
|
|
|
|
|
|
|
|
|
|
|
|
|
|
|
|
|
|
| GAAP general and administrative |
$ |
19,921 |
|
|
$ |
19,804 |
|
|
$ |
20,619 |
|
|
$ |
58,908 |
|
|
$ |
59,372 |
|
| Stock-based compensation expense |
|
(5,010 |
) |
|
|
(5,135 |
) |
|
|
(4,313 |
) |
|
|
(14,481 |
) |
|
|
(10,885 |
) |
| Acquisition related expenses |
|
— |
|
|
|
— |
|
|
|
— |
|
|
|
— |
|
|
|
(705 |
) |
| Non-GAAP general and administrative |
$ |
14,911 |
|
|
$ |
14,669 |
|
|
$ |
16,306 |
|
|
$ |
44,427 |
|
|
$ |
47,782 |
|
|
|
|
|
|
|
|
|
|
|
|
|
|
|
|
|
|
|
|
|
| GAAP total operating expenses |
$ |
80,794 |
|
|
$ |
76,227 |
|
|
$ |
79,321 |
|
|
$ |
234,915 |
|
|
$ |
221,964 |
|
| Amortization of intangible assets |
|
(1 |
) |
|
|
(2 |
) |
|
|
— |
|
|
|
(4 |
) |
|
|
— |
|
| Stock-based compensation expense |
|
(9,288 |
) |
|
|
(9,404 |
) |
|
|
(8,246 |
) |
|
|
(26,396 |
) |
|
|
(19,539 |
) |
| Acquisition related expenses |
|
(244 |
) |
|
|
(244 |
) |
|
|
(286 |
) |
|
|
(732 |
) |
|
|
(991 |
) |
| Restructuring and other charges |
|
(5,554 |
) |
|
|
(782 |
) |
|
|
(1,514 |
) |
|
|
(11,212 |
) |
|
|
(7,118 |
) |
| Litigation reserves, net |
|
— |
|
|
|
1 |
|
|
|
(98 |
) |
|
|
(499 |
) |
|
|
(136 |
) |
| Non-GAAP total operating expenses |
$ |
65,707 |
|
|
$ |
65,796 |
|
|
$ |
69,177 |
|
|
$ |
196,072 |
|
|
$ |
194,180 |
|
|
|
|
|
|
|
|
|
|
|
|
|
|
|
|
|
|
|
|
|
| GAAP operating income (loss) |
$ |
(13,701 |
) |
|
$ |
(8,441 |
) |
|
$ |
(7,069 |
) |
|
$ |
(35,734 |
) |
|
$ |
(29,408 |
) |
| GAAP operating margin |
|
(8.2 |
)% |
|
|
(5.0 |
)% |
|
|
(3.8 |
)% |
|
|
(7.2 |
)% |
|
|
(5.7 |
)% |
| Amortization of intangible assets |
|
1,416 |
|
|
|
1,418 |
|
|
|
180 |
|
|
|
4,253 |
|
|
|
180 |
|
| Stock-based compensation expense |
|
9,835 |
|
|
|
10,020 |
|
|
|
8,808 |
|
|
|
28,060 |
|
|
|
20,979 |
|
| Acquisition related expenses |
|
244 |
|
|
|
244 |
|
|
|
286 |
|
|
|
732 |
|
|
|
991 |
|
| Restructuring and other charges |
|
5,554 |
|
|
|
782 |
|
|
|
1,514 |
|
|
|
11,212 |
|
|
|
7,118 |
|
| Litigation reserves, net |
|
— |
|
|
|
(1 |
) |
|
|
98 |
|
|
|
499 |
|
|
|
136 |
|
| Non-GAAP operating income (loss) |
$ |
3,348 |
|
|
$ |
4,022 |
|
|
$ |
3,817 |
|
|
$ |
9,022 |
|
|
$ |
(4 |
) |
| Non-GAAP operating margin |
|
2.0 |
% |
|
|
2.4 |
% |
|
|
2.1 |
% |
|
|
1.8 |
% |
|
|
(0.0 |
)% |
|
|
|
|
|
|
|
|
|
|
|
|
|
|
|
|
|
|
|
|
| GAAP other income, net |
$ |
1,037 |
|
|
$ |
1,701 |
|
|
$ |
3,028 |
|
|
$ |
4,319 |
|
|
$ |
15,175 |
|
| Gain/loss on investments and others |
|
72 |
|
|
|
32 |
|
|
|
42 |
|
|
|
82 |
|
|
|
(4,869 |
) |
| Non-GAAP other income, net |
$ |
1,109 |
|
|
$ |
1,733 |
|
|
$ |
3,070 |
|
|
$ |
4,401 |
|
|
$ |
10,306 |
|
|
|
|
|
|
|
|
|
|
|
|
|
|
|
|
|
|
|
|
|
|
|
|
|
|
|
|
|
|
|
|
|
|
|
|
|
|
|
|
|
| NETGEAR, INC.RECONCILIATIONS OF GAAP MEASURES TO NON-GAAP MEASURES (CONTINUED)(In thousands, except per share data)(Unaudited) |
|
|
|
|
|
|
|
|
|
|
|
|
|
|
|
|
|
|
|
|
|
|
|
|
|
|
|
|
|
|
|
|
|
|
|
|
|
|
|
| STATEMENT OF OPERATIONS DATA (CONTINUED): |
|
|
|
|
|
|
|
|
|
|
|
|
|
|
|
|
|
|
|
|
|
|
|
|
|
|
|
|
|
|
|
|
|
|
|
|
|
|
|
|
|
Three Months Ended |
|
|
|
|
|
|
|
|
|
|
|
Nine Months Ended |
|
|
|
|
|
|
|
September 27, 2026 |
|
|
|
June 28, 2026 |
|
|
|
September 28, 2025 |
|
|
|
September 27, 2026 |
|
|
|
September 28, 2025 |
|
|
|
|
|
|
|
|
|
|
|
|
|
|
|
|
|
|
|
|
|
| GAAP net income (loss) |
$ |
(12,274 |
) |
|
$ |
(7,253 |
) |
|
$ |
(4,777 |
) |
|
$ |
(32,567 |
) |
|
$ |
(17,239 |
) |
| Amortization of intangible assets |
|
1,416 |
|
|
|
1,418 |
|
|
|
180 |
|
|
|
4,253 |
|
|
|
180 |
|
| Stock-based compensation expense |
|
9,835 |
|
|
|
10,020 |
|
|
|
8,808 |
|
|
|
28,060 |
|
|
|
20,979 |
|
| Acquisition related expenses |
|
244 |
|
|
|
244 |
|
|
|
286 |
|
|
|
732 |
|
|
|
991 |
|
| Restructuring and other charges |
|
5,554 |
|
|
|
782 |
|
|
|
1,514 |
|
|
|
11,212 |
|
|
|
7,118 |
|
| Litigation reserves, net |
|
— |
|
|
|
(1 |
) |
|
|
98 |
|
|
|
499 |
|
|
|
136 |
|
| Gain/loss on investments and others |
|
72 |
|
|
|
32 |
|
|
|
42 |
|
|
|
82 |
|
|
|
(4,869 |
) |
| Non-GAAP tax adjustments |
|
(1,186 |
) |
|
|
(867 |
) |
|
|
(2,692 |
) |
|
|
(2,381 |
) |
|
|
(1,695 |
) |
| Non-GAAP net income (loss) |
$ |
3,661 |
|
|
$ |
4,375 |
|
|
$ |
3,459 |
|
|
$ |
9,890 |
|
|
$ |
5,601 |
|
|
|
|
|
|
|
|
|
|
|
|
|
|
|
|
|
|
|
|
|
| NET INCOME (LOSS) PER DILUTED SHARE: |
|
|
|
|
|
|
|
|
|
|
|
|
|
|
|
|
|
|
|
| GAAP net income (loss) per diluted share |
$ |
(0.45 |
) |
|
$ |
(0.27 |
) |
|
$ |
(0.17 |
) |
|
$ |
(1.19 |
) |
|
$ |
(0.60 |
) |
| Amortization of intangible assets |
|
0.05 |
|
|
|
0.05 |
|
|
|
0.01 |
|
|
|
0.15 |
|
|
|
0.01 |
|
| Stock-based compensation expense |
|
0.36 |
|
|
|
0.36 |
|
|
|
0.30 |
|
|
|
1.00 |
|
|
|
0.69 |
|
| Acquisition related expenses |
|
0.01 |
|
|
|
0.01 |
|
|
|
0.01 |
|
|
|
0.03 |
|
|
|
0.03 |
|
| Restructuring and other charges |
|
0.20 |
|
|
|
0.03 |
|
|
|
0.05 |
|
|
|
0.40 |
|
|
|
0.24 |
|
| Litigation reserves, net |
|
— |
|
|
|
— |
|
|
|
— |
|
|
|
0.02 |
|
|
|
— |
|
| Gain/loss on investments and others |
|
— |
|
|
|
— |
|
|
|
— |
|
|
|
— |
|
|
|
(0.16 |
) |
| Non-GAAP tax adjustments |
|
(0.04 |
) |
|
|
(0.02 |
) |
|
|
(0.08 |
) |
|
|
(0.06 |
) |
|
|
(0.02 |
) |
| Non-GAAP net income (loss) per diluted share 1 |
$ |
0.13 |
|
|
$ |
0.16 |
|
|
$ |
0.12 |
|
|
$ |
0.35 |
|
|
$ |
0.19 |
|
|
|
|
|
|
|
|
|
|
|
|
|
|
|
|
|
|
|
|
|
| Shares used in computing GAAP net income (loss) per diluted share |
|
27,057 |
|
|
|
27,041 |
|
|
|
28,638 |
|
|
|
27,352 |
|
|
|
28,756 |
|
| Shares used in computing non-GAAP net income (loss) per diluted share |
|
27,667 |
|
|
|
27,881 |
|
|
|
29,782 |
|
|
|
28,186 |
|
|
|
30,219 |
|
|
|
|
|
|
|
|
|
|
|
|
|
|
|
|
|
|
|
|
|
| 1 The per share reconciliation of GAAP to non-GAAP may not aggregate due to both calculations utilizing a different share basis. The net loss per diluted share calculation uses a lower share count as it excludes potentially dilutive shares included in the net income per diluted share calculation. |
|
|
|
|
|
|
|
|
|
|
|
|
|
|
|
|
|
|
|
|
|
|
|
|
|
|
|
|
|
|
|
|
|
|
|
|
|
|
|
|
|
|
|
|
|
|
|
|
|
|
|
|
|
|
| NETGEAR, INC.SUPPLEMENTAL FINANCIAL INFORMATION(In thousands, except per share data, DSO, inventory turns, weeks of channel inventory, headcount and percentage data)(Unaudited) |
|
|
|
|
|
|
|
|
|
|
|
|
|
|
|
|
|
|
|
|
|
|
|
|
|
|
|
|
|
|
|
Three Months Ended |
|
|
|
|
|
|
|
|
|
|
|
|
|
|
September 27, 2026 |
|
|
June 28, 2026 |
|
|
March 29, 2026 |
|
|
December 31, 2025 |
|
|
September 28, 2025 |
|
|
|
|
|
|
|
|
|
|
|
|
|
|
|
| Cash, cash equivalents and short-term investments |
$ |
242,092 |
|
$ |
267,879 |
|
$ |
296,509 |
|
$ |
323,036 |
|
$ |
326,383 |
| Cash, cash equivalents and short-term investments per diluted share |
$ |
8.75 |
|
$ |
9.61 |
|
$ |
10.33 |
|
$ |
10.97 |
|
$ |
10.96 |
|
|
|
|
|
|
|
|
|
|
|
|
|
|
|
| Accounts receivable, net |
$ |
156,357 |
|
$ |
152,820 |
|
$ |
142,155 |
|
$ |
142,045 |
|
$ |
159,880 |
| Days sales outstanding (DSO) |
|
85 |
|
|
83 |
|
|
79 |
|
|
73 |
|
|
79 |
|
|
|
|
|
|
|
|
|
|
|
|
|
|
|
| Inventories |
$ |
169,366 |
|
$ |
174,933 |
|
$ |
169,305 |
|
$ |
176,456 |
|
$ |
166,561 |
| Ending inventory turns |
|
2.4 |
|
|
2.3 |
|
|
2.2 |
|
|
2.5 |
|
|
2.7 |
|
|
|
|
|
|
|
|
|
|
|
|
|
|
|
| Weeks of channel inventory: |
|
|
|
|
|
|
|
|
|
|
|
|
|
|
| U.S. retail channel |
|
13.1 |
|
|
12.6 |
|
|
11.5 |
|
|
11.0 |
|
|
11.9 |
| U.S. distribution channel |
|
3.1 |
|
|
4.0 |
|
|
5.0 |
|
|
5.0 |
|
|
3.5 |
| EMEA distribution channel |
|
5.2 |
|
|
5.6 |
|
|
4.8 |
|
|
4.6 |
|
|
5.5 |
| APAC distribution channel |
|
8.9 |
|
|
10.9 |
|
|
12.7 |
|
|
13.7 |
|
|
8.3 |
|
|
|
|
|
|
|
|
|
|
|
|
|
|
|
| Deferred revenue (current and non-current) |
$ |
29,609 |
|
$ |
29,449 |
|
$ |
30,224 |
|
$ |
31,110 |
|
$ |
32,464 |
|
|
|
|
|
|
|
|
|
|
|
|
|
|
|
| Headcount |
|
819 |
|
|
822 |
|
|
786 |
|
|
784 |
|
|
753 |
| Non-GAAP diluted shares |
|
27,667 |
|
|
27,881 |
|
|
28,701 |
|
|
29,457 |
|
|
29,782 |
|
|
|
|
|
|
|
|
|
|
|
|
|
|
|
|
|
|
|
|
|
|
|
|
|
|
|
|
|
|
|
|
|
|
|
|
|
|
|
|
|
|
|
|
|
|
| NET REVENUE BY GEOGRAPHY |
|
|
|
|
|
|
|
|
|
|
|
|
|
|
|
|
|
|
|
|
|
|
|
|
|
|
|
|
|
|
|
|
|
|
|
|
|
|
|
|
|
|
|
|
|
|
|
|
|
|
|
|
|
|
|
|
|
|
|
|
|
|
|
|
Three Months Ended |
|
|
|
|
|
|
|
|
|
|
|
|
|
|
|
|
|
Nine Months Ended |
|
|
|
|
|
|
|
|
|
|
|
|
September 27, 2026 |
|
|
|
|
|
June 28, 2026 |
|
|
|
|
|
September 28, 2025 |
|
|
|
|
|
September 27, 2026 |
|
|
|
|
|
September 28, 2025 |
|
|
|
| Americas |
|
$ |
115,745 |
|
69 |
% |
|
$ |
116,526 |
|
69 |
% |
|
$ |
128,085 |
|
69 |
% |
|
$ |
338,134 |
|
68 |
% |
|
$ |
352,125 |
|
68 |
% |
| EMEA |
|
|
33,074 |
|
20 |
% |
|
|
36,423 |
|
22 |
% |
|
|
36,936 |
|
20 |
% |
|
|
102,972 |
|
21 |
% |
|
|
103,440 |
|
20 |
% |
| APAC |
|
|
18,526 |
|
11 |
% |
|
|
15,613 |
|
9 |
% |
|
|
19,540 |
|
11 |
% |
|
|
53,620 |
|
11 |
% |
|
|
61,588 |
|
12 |
% |
| Total |
|
$ |
167,345 |
|
100 |
% |
|
$ |
168,562 |
|
100 |
% |
|
$ |
184,561 |
|
100 |
% |
|
$ |
494,726 |
|
100 |
% |
|
$ |
517,153 |
|
100 |
% |
|
|
|
|
|
|
|
|
|
|
|
|
|
|
|
|
|
|
|
|
|
|
|
|
|
|
|
|
|
|
|
|
|
|
|
|
|
|
|
|
|
|
|
|
|
|
| SERVICE PROVIDER NET REVENUE |
|
|
|
|
|
|
|
|
|
|
|
|
|
|
|
|
|
|
|
|
|
|
|
|
|
|
|
|
|
|
|
Three Months Ended |
|
|
|
|
|
|
|
|
Nine Months Ended |
|
|
|
| Consumer Segment |
|
September 27, 2026 |
|
|
June 28, 2026 |
|
|
September 28, 2025 |
|
|
September 27, 2026 |
|
|
September 28, 2025 |
|
|
|
|
|
|
|
|
|
|
|
|
|
|
|
| Service provider net revenue1 |
$ |
20,795 |
|
$ |
23,777 |
|
$ |
26,975 |
|
$ |
64,804 |
|
$ |
83,900 |
| Other |
|
55,832 |
|
|
55,831 |
|
|
66,748 |
|
|
166,448 |
|
|
180,603 |
| Total Consumer segment net revenue |
$ |
76,627 |
|
$ |
79,608 |
|
$ |
93,723 |
|
$ |
231,252 |
|
$ |
264,503 |
|
|
|
|
|
|
|
|
|
|
|
|
|
|
|
| 1 Service provider net revenue includes cable net revenue sold from retail. Prior-period amounts have been recast to conform to the current-period presentation. |
|
|
|
|
|
|
|
|
|
|
|
|
|
|
|
|
|
|
|
|
|
|
|
|
|
|
|
|
|
|
|
|
|
|
|
|
|
|
|
|
|
|
|
|
|
|
|
|
|
|
|
|
|
|
|
|
|
| NETGEAR, INC.SUPPLEMENTAL FINANCIAL INFORMATION (CONTINUED)(In thousands, except percentage data)(Unaudited) |
|
|
|
|
|
|
|
|
|
|
|
|
|
|
|
|
|
|
|
|
|
|
|
|
|
|
|
|
|
|
|
|
|
|
|
|
|
|
|
|
|
|
|
|
|
|
|
|
|
|
|
|
|
|
|
| SEGMENT DATA: |
|
|
|
|
|
|
|
|
|
|
|
|
|
|
|
|
|
|
|
|
|
|
|
|
|
|
|
|
|
|
|
|
|
|
|
|
|
|
|
|
|
|
|
|
|
|
|
|
|
|
|
|
|
|
|
|
|
Three Months Ended |
|
|
|
|
|
|
|
|
|
|
|
|
|
|
|
|
|
|
|
|
|
|
|
|
|
|
|
September 27, 2026 |
|
|
|
|
|
|
|
|
June 28, 2026 |
|
|
|
|
|
|
|
|
September 28, 2025 |
|
|
|
|
|
|
|
|
|
Enterprise |
|
|
Consumer |
|
|
Total |
|
|
Enterprise |
|
|
Consumer |
|
|
Total |
|
|
Enterprise |
|
|
Consumer |
|
|
Total |
|
| Net revenue |
$ |
90,718 |
|
$ |
76,627 |
|
$ |
167,345 |
|
$ |
88,954 |
|
$ |
79,608 |
|
$ |
168,562 |
|
$ |
90,838 |
|
$ |
93,723 |
|
$ |
184,561 |
|
| Segment cost of revenue |
|
42,487 |
|
|
55,803 |
|
|
|
|
|
40,854 |
|
|
57,890 |
|
|
|
|
|
44,486 |
|
|
67,081 |
|
|
|
|
| Segment gross profit |
|
48,231 |
|
|
20,824 |
|
|
69,055 |
|
|
48,100 |
|
|
21,718 |
|
|
69,818 |
|
|
46,352 |
|
|
26,642 |
|
|
72,994 |
|
| Segment gross margin |
|
53.2 |
% |
|
27.2 |
% |
|
|
|
|
54.1 |
% |
|
27.3 |
% |
|
|
|
|
51.0 |
% |
|
28.4 |
% |
|
|
|
| Reconciliation of gross profit |
|
|
|
|
|
|
|
|
|
|
|
|
|
|
|
|
|
|
|
|
|
|
|
|
|
|
|
| Amortization of intangible assets |
|
|
|
|
|
|
|
(1,415 |
) |
|
|
|
|
|
|
|
(1,416 |
) |
|
|
|
|
|
|
|
(180 |
) |
| Stock-based compensation expense |
|
|
|
|
|
|
|
(547 |
) |
|
|
|
|
|
|
|
(616 |
) |
|
|
|
|
|
|
|
(562 |
) |
| Total Consolidated gross profit |
|
|
|
|
|
|
$ |
67,093 |
|
|
|
|
|
|
|
$ |
67,786 |
|
|
|
|
|
|
|
$ |
72,252 |
|
| Segment operating expenses |
|
25,980 |
|
|
22,246 |
|
|
|
|
|
25,050 |
|
|
23,452 |
|
|
|
|
|
23,737 |
|
|
24,790 |
|
|
|
|
| Contribution income (loss) |
|
22,251 |
|
|
(1,422 |
) |
|
20,829 |
|
|
23,050 |
|
|
(1,734 |
) |
|
21,316 |
|
|
22,615 |
|
|
1,852 |
|
|
24,467 |
|
| Contribution margin |
|
24.5 |
% |
|
(1.9 |
)% |
|
|
|
|
25.9 |
% |
|
(2.2 |
)% |
|
|
|
|
24.9 |
% |
|
2.0 |
% |
|
|
|
| Corporate and unallocated costs |
|
|
|
|
|
|
|
(17,481 |
) |
|
|
|
|
|
|
|
(17,294 |
) |
|
|
|
|
|
|
|
(20,650 |
) |
| Amortization of intangible assets |
|
|
|
|
|
|
|
(1,416 |
) |
|
|
|
|
|
|
|
(1,418 |
) |
|
|
|
|
|
|
|
(180 |
) |
| Stock-based compensation expense |
|
|
|
|
|
|
|
(9,835 |
) |
|
|
|
|
|
|
|
(10,020 |
) |
|
|
|
|
|
|
|
(8,808 |
) |
| Acquisition related expenses |
|
|
|
|
|
|
|
(244 |
) |
|
|
|
|
|
|
|
(244 |
) |
|
|
|
|
|
|
|
(286 |
) |
| Restructuring and other charges |
|
|
|
|
|
|
|
(5,554 |
) |
|
|
|
|
|
|
|
(782 |
) |
|
|
|
|
|
|
|
(1,514 |
) |
| Litigation reserves, net |
|
|
|
|
|
|
|
- |
|
|
|
|
|
|
|
|
1 |
|
|
|
|
|
|
|
|
(98 |
) |
| Other income, net |
|
|
|
|
|
|
|
1,037 |
|
|
|
|
|
|
|
|
1,701 |
|
|
|
|
|
|
|
|
3,028 |
|
| Income (loss) before income taxes |
|
|
|
|
|
|
$ |
(12,664 |
) |
|
|
|
|
|
|
$ |
(6,740 |
) |
|
|
|
|
|
|
$ |
(4,041 |
) |
|
|
|
|
|
|
|
|
|
|
|
|
|
|
|
|
|
|
|
|
|
Nine Months Ended |
|
|
|
|
|
|
|
|
|
|
|
|
|
|
|
|
|
|
September 27, 2026 |
|
|
|
|
|
|
|
|
September 28, 2025 |
|
|
|
|
|
|
|
|
|
Enterprise |
|
|
Consumer |
|
|
Total |
|
|
Enterprise |
|
|
Consumer |
|
|
Total |
|
| Net revenue |
$ |
263,474 |
|
$ |
231,252 |
|
$ |
494,726 |
|
$ |
252,650 |
|
$ |
264,503 |
|
$ |
517,153 |
|
| Segment cost of revenue |
|
122,999 |
|
|
166,633 |
|
|
|
|
|
131,052 |
|
|
191,925 |
|
|
|
|
| Segment gross profit |
|
140,475 |
|
|
64,619 |
|
|
205,094 |
|
|
121,598 |
|
|
72,578 |
|
|
194,176 |
|
| Segment gross margin |
|
53.3 |
% |
|
27.9 |
% |
|
|
|
|
48.1 |
% |
|
27.4 |
% |
|
|
|
| Reconciliation of gross profit |
|
|
|
|
|
|
|
|
|
|
|
|
|
|
|
|
|
|
| Amortization of intangible assets |
|
|
|
|
|
|
|
(4,249 |
) |
|
|
|
|
|
|
|
(180 |
) |
| Stock-based compensation expense |
|
|
|
|
|
|
|
(1,664 |
) |
|
|
|
|
|
|
|
(1,440 |
) |
| Total Consolidated gross profit |
|
|
|
|
|
|
$ |
199,181 |
|
|
|
|
|
|
|
$ |
192,556 |
|
| Segment operating expenses |
|
75,117 |
|
|
67,901 |
|
|
|
|
|
65,386 |
|
|
68,904 |
|
|
|
|
| Contribution income (loss) |
|
65,358 |
|
|
(3,282 |
) |
|
62,076 |
|
|
56,212 |
|
|
3,674 |
|
|
59,886 |
|
| Contribution margin |
|
24.8 |
% |
|
(1.4 |
)% |
|
|
|
|
22.2 |
% |
|
1.4 |
% |
|
|
|
| Corporate and unallocated costs |
|
|
|
|
|
|
|
(53,054 |
) |
|
|
|
|
|
|
|
(59,890 |
) |
| Amortization of intangible assets |
|
|
|
|
|
|
|
(4,253 |
) |
|
|
|
|
|
|
|
(180 |
) |
| Stock-based compensation expense |
|
|
|
|
|
|
|
(28,060 |
) |
|
|
|
|
|
|
|
(20,979 |
) |
| Acquisition related expenses |
|
|
|
|
|
|
|
(732 |
) |
|
|
|
|
|
|
|
(991 |
) |
| Restructuring and other charges |
|
|
|
|
|
|
|
(11,212 |
) |
|
|
|
|
|
|
|
(7,118 |
) |
| Litigation reserves, net |
|
|
|
|
|
|
|
(499 |
) |
|
|
|
|
|
|
|
(136 |
) |
| Other income, net |
|
|
|
|
|
|
|
4,319 |
|
|
|
|
|
|
|
|
15,175 |
|
| Income (loss) before income taxes |
|
|
|
|
|
|
$ |
(31,415 |
) |
|
|
|
|
|
|
$ |
(14,233 |
) |
NETGEAR Investor Relations
Steven C. Pelayo, CFA
[email protected]
Source: NETGEAR, Inc.
View All News
IR Contact
[[email protected]](mailto: [email protected])
Transfer Agent
Computershare
PO BOX 505000
Louisville, KY 40233
P: (877) 854-4593


Investor Email Alerts
Personal Information.
Email Address *Required Email Address is required. Email Address is invalid.
Investor Alert Options *
- News
- Quarterly Reports
- Annual Reports
- SEC Filings
- End of Day Stock Quote
- Events & Presentations
Investor Alert Options is required.
The captcha test has failed. Please try again.
Submit
Unsubscribe

© 2026 NETGEAR, Inc. - All rights reserved
Powered By Q4 Inc. 5.191.0.1 (opens in new window)