June 11, 2026 Table of Contents Data Integrity and Optical Performance in Mission-Critical Systems Fiber optic interconnect performance in mission-critical systems is governed not only by nominal bandwidth or initial insertion loss, but by the…
June 11, 2026
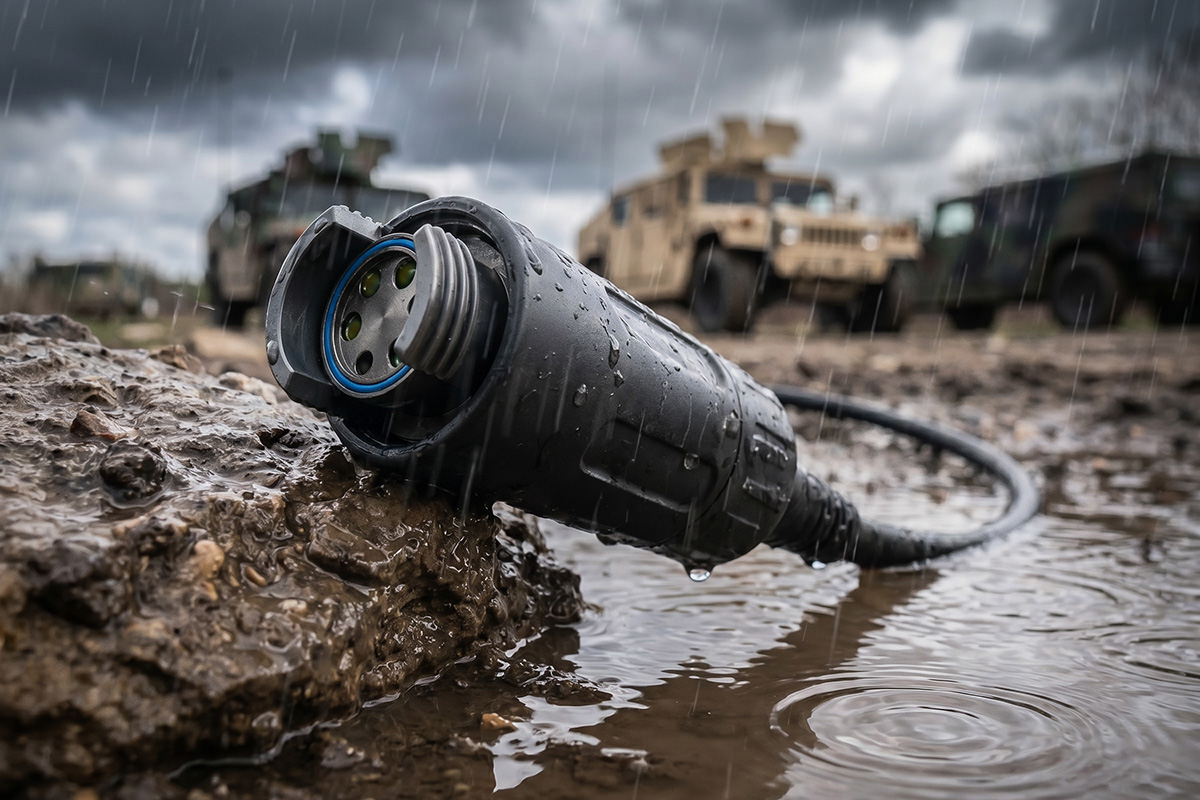
Table of Contents
Data Integrity and Optical Performance in Mission-Critical Systems
Fiber optic interconnect performance in mission-critical systems is governed not only by nominal bandwidth or initial insertion loss, but by the ability to maintain stable optical transmission over time and under operational stress.
In aerospace, defense, medical, and industrial environments, connectors are exposed to mechanical vibration, contamination, repeated mating cycles, and environmental variability. Under these conditions, connector architecture becomes a determining factor in preserving data integrity.
Today we will explore two fundamentally different optical interface approaches used in ruggedized fiber optic systems:
-
Expanded Beam (EBX)
architectures, which stabilize performance through non-contact optical coupling and reduced sensitivity to environmental conditions
-
MT/MPO/MTP
architectures, which maximize data throughput via precision alignment and high-density multi-fiber interfaces
Our analysis focuses on insertion loss behavior, alignment stability, environmental tolerance, and system-level data integrity. These parameters define how each architecture performs under real-world conditions and provide a basis for engineering-driven selection.

MTP/MPO are designed to support high density applications without sacrificing performance.
Consistent Performance With Ruggedized Fiber Optic
The role of fiber optic connectors in modern system design has evolved significantly. In high-performance applications, connectors must now be evaluated as active contributors to overall system behavior rather than passive transmission components.
In controlled environments, optical performance is largely a function of alignment precision and cleanliness at the interface. However, many mission-critical systems operate outside such conditions. Connectors may be exposed to repeated handling, contamination, vibration, and environmental extremes. Under these circumstances, the primary challenge of engineering is not maximizing peak performance but maintaining consistent optical behavior across real-world operating conditions.
Insertion loss, return loss, and alignment of integrity must therefore be understood as dynamic rather than static parameters. Connector design must ensure that optical coupling remains stable as environmental and mechanical conditions evolve.
Optical Performance in Ruggedized Systems
Ruggedized fiber optic connectivity can be defined as the design and implementation of cable and connector systems that preserve:
Insertion loss represents the attenuation of optical power across a connection. In mission-critical systems, it must be considered as a function of:
Similarly, data integrity must be evaluated not in terms of instantaneous performance, but in terms of sustained signal fidelity across operational use cases.
Connector architecture, therefore, becomes the primary variable that determines whether these performance objectives are met.
Expanded Beam Fiber Optics: Optical Stability Under Environmental Stress
Interface Architecture
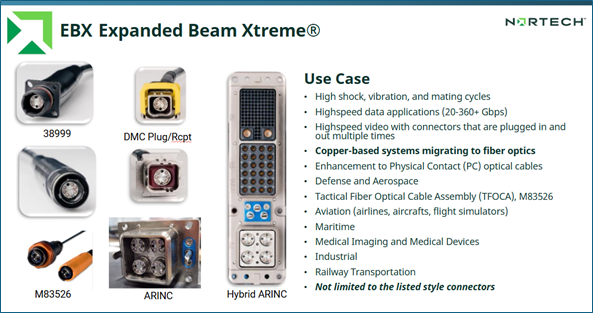
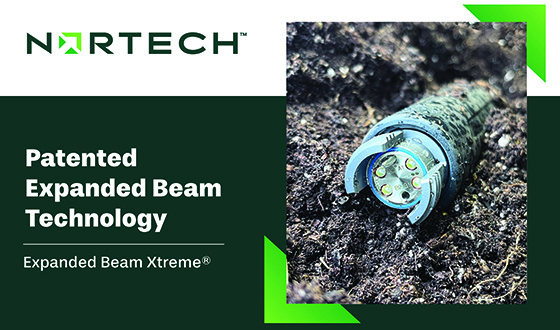
Expanded beam fiber optic connectors
utilize a non-contact optical interface. Light exiting the transmitting fiber is expanded and collimated using optical elements, transmitted across an air gap, and refocused into the receiving fiber.
This approach eliminates direct physical contact between fiber endfaces, replacing physical coupling with optical coupling.
Implications for Data Integrity
The expanded beam architecture fundamentally alters how environmental variables affect optical performance.
Because the light beam is expanded:
-
Particulate contamination occupies a smaller proportion of the optical field
-
The impact of dust, debris, or surface imperfections on signal transmission is reduced
-
Cleaning sensitivity is significantly decreased compared to contact-based interfaces
Because the interface is non-contact:
-
Mechanical wear at the optical interface is minimized
-
Optical performance degradation across mating cycles is reduced
-
Alignment is less sensitive to micro-scale mechanical variation
These characteristics contribute to stable insertion loss and consistent optical transmission behavior over time, which is essential in field-deployable and serviceable systems.
Performance Characteristics
Expanded beam systems are engineered to support:
-
Stable insertion loss across repeated mate/de-mate cycles
-
Low reflected loss, minimizing back-reflection effects
-
Reliable performance under vibration, shock, and environmental exposure
-
High mating-cycle durability and long operational life
This results in an interface optimized for predictability and stability, rather than maximum theoretical efficiency in ideal conditions.
Application Context
Expanded beam architectures are best suited for systems in which:
-
Environmental conditions cannot be fully controlled
-
Connectors are exposed to contamination or debris
-
Frequent mating cycles are required
-
Reliability over time is prioritized over initial insertion loss
MT/MPO/MTP Connectors: Precision Alignment and High-Density Transmission
Interface Architecture
MT/MPO/MTP connectors are based on a mechanically aligned, multi-fiber interface. Multiple optical fibers are positioned within a precision ferrule, allowing simultaneous transmission across multiple channels within a single connector. This architecture is designed to maximize channel density, bandwidth per connector and space and weight efficiency.
Alignment and Optical Coupling
The defining feature of the MT interface is precision alignment. Optical performance depends on accurate positioning of fiber cores relative to each other across the mating interface.
This alignment enables:
-
Efficient light transfer between fibers
-
Low insertion loss under properly controlled conditions
-
High data throughput across multiple channels
Because multiple fibers are involved, performance must be evaluated at the system level, where aggregate insertion loss is influenced by consistency across all channels.
Insertion Loss and System Performance
In MT-based systems, insertion loss is governed by:
-
Ferrule geometry and material precision
-
Fiber positioning accuracy
-
Endface polishing and surface quality
-
Cleanliness of the optical interface
When these factors are tightly controlled, MT/MPO/MTP connectors can achieve:
However, maintaining these characteristics requires disciplined manufacturing processes and environmental control.
High-Density System Implications
MT/MPO/MTP architecture enables:
These advantages are critical in applications where space, weight, and throughput must be optimized simultaneously.
Comparative Engineering Considerations
Expanded beam and MT/MPO/MTP architectures should be evaluated as different solutions to different engineering constraints.
Expanded Beam (EBX)
Expanded beam connectors are designed for environments where maintaining controlled interface conditions is not feasible. Their key characteristics include:
-
Optical coupling tolerant to contamination and debris
-
Reduced sensitivity to vibration and misalignment
-
Minimal interface wear across mating cycles
-
Stable insertion loss over time and under stress
These systems prioritize performance stability under real-world conditions.
MT / MPO / MTP
MT-based connectors are designed to maximize performance within controlled alignment conditions. Their characteristics include:
-
High-density multi-fiber connectivity
-
Precise fiber alignment for efficient optical coupling
-
Low insertion loss under controlled conditions
-
High aggregate data throughput
These systems prioritize density and transmission efficiency.
Engineering Tradeoff
The selection between these architectures is determined by the dominant design constraint:
-
Expanded beam is preferred when the system must tolerate environmental variability and maintain stable performance over time
-
MT/MPO/MTP is preferred when the system must maximize data throughput within constrained physical space
The decision is therefore driven by operating conditions, not by nominal connector specifications.
Choosing the Right Rugged Fiber Optic Solution
Ruggedized fiber optic connectivity is fundamentally concerned with preserving optical performance in environments where variability is unavoidable.
Expanded beam and MT/MPO/MTP connectors represent two distinct approaches to this challenge:
-
Expanded beam architectures stabilize optical performance through non-contact coupling and reduced environmental sensitivity
-
MT/MPO/MTP architectures achieve high-density transmission through precision alignment and controlled optical interfaces
Understanding how these systems behave under real operating conditions enables engineers to select the appropriate interconnect architecture for maintaining data integrity in mission-critical applications.
Frequently Asked Questions
- What is the primary difference between expanded beam and MT connectors?
- Expanded beam connectors use a non-contact optical interface designed to maintain stable performance in harsh environments. MT connectors use precise mechanical alignment to enable high-density, low-loss optical transmission.
- Why is insertion loss important in ruggedized fiber systems?
- Insertion loss determines how much signal power is lost across a connection. In mission-critical environments, maintaining consistent insertion loss over time is essential for preserving signal integrity.
- When should expanded beam connectors be used?
- They are best suited for environments with contamination, vibration, or frequent connection cycles where maintaining stable performance is more important than achieving the lowest initial loss.
- When should MT/MPO/MTP connectors be used?
- They are ideal for applications requiring high data throughput, compact form factors, and precise optical alignment under controlled conditions.
- Are expanded beam connectors better than MT connectors?
- Neither is universally “better.” Each architecture is optimized for different operating conditions. The correct selection depends on system requirements and environmental constraints.

Nortech Systems is a leading provider of design and manufacturing solutions for complex electromedical devices, electromechanical systems, assemblies, and components. Its manufacturing and supply chain capabilities are vertically integrated around wire, cable, and interconnect assemblies, printed circuit board assemblies, as well as system-level assembly, integration, and final test. Headquartered in Maple Grove, Minn., Nortech currently has six manufacturing locations and design centers across the U.S., Latin America, and Asia. Nortech Systems is traded on the NASDAQ Stock Market under the symbol NSYS.
Linkedin Facebook Youtube
Capabilities
Quick Links