News Price Data
NASDAQNSSC
Created with Highstock 1.3.5Dec '25Jan '26Feb '26Mar '26Apr '26May '26Jun '26Jul '26Aug '26Sep '26Oct '26Nov '26$30$35$40$45$50
Loading...
1dy
1mo
6mo
1yr
5yr
Currency in USD.
Quote data delayed by at least 15 minutes.
AMITYVILLE, N.Y., Nov. 2, 2026 /PRNewswire / -- NAPCO Security Technologies, Inc. (NASDAQ: NSSC), one of the leading manufacturers and designers of high-tech electronic security equipment, wireless communication devices for intrusion and fire alarm systems and the related recurring service revenues as well as a provider of school safety solutions, today announced financial results for its first quarter of fiscal year 2027. Results are reported in accordance with U.S. generally accepted accounting principles ("GAAP") and are also reported adjusting for certain items ("Non-GAAP"). A reconciliation between GAAP and Non-GAAP operating results is provided at the end of this press release.
First Quarter 2027 Financial Results as Compared to First Quarter 2026
- Net revenue increased 1.7% to a First Quarter record $50.0 million
- Recurring service revenue ("RSR") increased 11.5% to a Quarterly record $26.1 million, with over 90% gross margin
- RSR has a prospective annual run rate of approximately $106 million based on October 2026 recurring service revenues
- Equipment revenue decreased 7.3% to $23.9 million
- Gross profit margin increased to 58.7.% vs 56.6% in prior fiscal year quarter
- Net Income increased 6.9% YoY to a First Quarter record $13.0 million
- Diluted Net Income per share increased 5.9% to $0.36
- Non-GAAP Adjusted EBITDA increased 3.8% to a First Quarter record $15.5 million with an Adjusted EBITDA Margin of 31.0%, compared to $14.9 million with an Adjusted EBITDA Margin of 30.4% in the prior fiscal year quarter
- The board declared a quarterly dividend of $.17 per share, payable on January 4, 2027, to shareholders of record on December 14, 2026.
Kevin Buchel, CEO and President, commented, "Our Fiscal Q1 performance reflects continued positive financial results. We achieved record Q1 revenue of $50.0 million and record Q1 Adjusted EBITDA of $15.5 million, which was bolstered by our recurring service revenue. Our RSR continues to deliver gross margins of over 90% and has a prospective run rate of approximately $106 million, a $3 million increase from the run rate we reported in July 2026. While equipment revenue declined year-over-year, the decrease was driven by two locking distributors reducing their purchases during the quarter. Importantly, sell-through at both distributors grew year-over-year and strengthened meaningfully on a sequential basis. We view sell-through as the truest indicator of end-market demand, and these trends reinforce our confidence in the underlying health of the business.
We are pleased to continue our dividend program of which the quarterly dividend will be $0.17 per share, which will be paid on January 4, 2027, to shareholders of record on December 14, 2026."
| Three months ended September 30, | |||||||||
| (dollars in thousands) | |||||||||
| % Increase/ | |||||||||
| Financial Highlights | 2026 | 2025 | (decrease) | ||||||
| GAAP Results | |||||||||
| Net Revenue | $ | 49,980 | $ | 49,168 | 1.7 | % | |||
| Gross Profit | $ | 29,352 | $ | 27,846 | 5.4 | % | |||
| Gross Profit Margin | 58.7 | % | 56.6 | % | |||||
| Operating Income | $ | 14,117 | $ | 13,643 | 3.5 | % | |||
| Net Income | $ | 13,009 | $ | 12,165 | 6.9 | % | |||
| Diluted Earnings Per Share | $ | 0.36 | $ | 0.34 | 5.9 | % | |||
| Non-GAAP Results | |||||||||
| Adjusted EBITDA | $ | 15,509 | $ | 14,942 | 3.8 | % | |||
| Adjusted EBITDA Margin | 31.0 | % | 30.4 | % | |||||
| Adjusted EBITDA Per Share | $ | 0.43 | $ | 0.42 | 2.4 | % | |||
| Free Cash Flows | $ | 2,317 | $ | 11,444 | (79.8) | % | |||
| Free Cash Flows Margin | 4.6 | % | 23.3 | % |
Conference Call Information
Management will conduct a conference call at 11 a.m. ET today, November 2, 2026, and in order to participate please go to the Investor Relations section of the Company website at https://investor.napcosecurity.com /events-presentations or choose https://app.webinar.net/ndlaQ1yQy3W . Alternatively, interested parties may participate in the call by dialing (US) 1-800-836-8184 or (International) 1-646-357-8785. A replay of the webcast will be available on the Investor Relations section of the Company's website.
About NAPCO Security Technologies, Inc.
NAPCO Security Technologies, Inc., is one of the leading manufacturers and designers of high-tech electronic security devices, wireless recurring communication services for intrusion and fire alarm systems as well as a provider of school safety solutions, The Company consists of four Divisions: NAPCO, plus three wholly owned subsidiaries: Alarm Lock, Continental Instruments, and Marks USA. Headquartered in Amityville, New York, its products are installed by tens of thousands of security professionals worldwide in commercial, industrial, institutional, residential and government applications. NAPCO products have earned a reputation for innovation, technical excellence and reliability, positioning the Company for growth in the multi-billion dollar and rapidly expanding electronic security market. For additional information on NAPCO, please visit the Company's web site at http://www.napcosecurity.com .
Safe Harbor Statement
This press release contains forward-looking statements that are based on current expectations, estimates, forecasts and projections of future performance based on management's judgment, beliefs, current trends, and anticipated product performance. These forward-looking statements include, but are not limited to, statements relating to supply chain challenges and developments; the growth of recurring service revenues and annual run rate; the strength of our balance sheet; our expectations regarding future results; the introduction of new access control and locking products; the opportunities for school security products; the opportunities for fire alarm products; and our ability to execute our business strategies. Actual results, performance or achievements could differ materially from those anticipated in such forward-looking statements because of certain factors, including those risk factors set forth in the Company's filings with the Securities and Exchange Commission, such as our annual report on Form 10-K and quarterly reports on Form 10-Q. Other unknown or unpredictable factors or underlying assumptions subsequently proved to be incorrect could cause actual results to differ materially from those in the forward-looking statements. Although we believe that the expectations reflected in the forward-looking statements are reasonable, we cannot guarantee future results, level of activity, performance, or achievements. You should not place undue reliance on these forward-looking statements. All information provided in this press release is as of today's date, unless otherwise stated, and the Company undertakes no duty to update such information, except as required under applicable law.
*Non-GAAP Financial Measures
Certain non-GAAP measures are included in this press release, including non-GAAP operating income, non-GAAP net income, non-GAAP net income per share (diluted), non-GAAP net income margin, Adjusted EBITDA, Adjusted EBITDA per share (diluted), Adjusted EBITDA per share margin, Free Cash Flow and Free Cash Flow margin. We define non-GAAP net income as GAAP net income plus litigation settlement costs. We define Adjusted EBITDA as GAAP net income plus income tax expense, less net interest income (expense), stock-based compensation, non-recurring legal expenses, litigation settlement costs, and depreciation and amortization expenses. Non-GAAP net income margin is non-GAAP net income divided by revenue. Adjusted EBITDA margin is Adjusted EBITDA divided by revenue. We define Free Cash Flow (FCF) as net cash provided by operating activities less capital expenditures. FCF margin is the FCF divided by revenue. These non-GAAP measures are provided to enhance the user's overall understanding of our financial performance. By excluding these charges our non-GAAP results provide information to management and investors that is useful in assessing NAPCO's core operating performance and in comparing our results of operations on a consistent basis from period to period. Our use of non-GAAP financial measures has certain limitations in that such non-GAAP financial measures may not be directly comparable to those reported by other companies. For example, the terms used in this press release, such as Adjusted EBITDA, do not have a standardized meaning. Other companies may use the same or similarly named measures, but exclude different items, which may not provide investors with a comparable view of our performance in relation to other companies. The presentation of this information is not meant to be a substitute for the corresponding financial measures prepared in accordance with generally accepted accounting principles. Investors are encouraged to review the reconciliation of GAAP to non-GAAP financial measures set forth above.
| NAPCO SECURITY TECHNOLOGIES, INC. AND SUBSIDIARIES | |||||||
| CONDENSED CONSOLIDATED BALANCE SHEETS | |||||||
| (Unaudited) | |||||||
| September 30, 2026 | June 30, 2026 | ||||||
| (in thousands, except share data) | |||||||
| Assets | |||||||
| Current Assets | |||||||
| Cash and cash equivalents | $ | 123,882 | $ | 126,928 | |||
| Marketable securities | 10,734 | 10,637 | |||||
| Accounts and other receivable, net of allowance for credit losses of $129 and $101 as ofSeptember 30, 2026 and June 30, 2026, respectively | 29,248 | 35,975 | |||||
| Inventories | 34,130 | 30,118 | |||||
| Income tax receivable | 1,523 | — | |||||
| Prepaid expenses and other current assets | 3,838 | 4,325 | |||||
| Total Current Assets | 203,355 | 207,983 | |||||
| Inventories - non-current | 9,195 | 9,256 | |||||
| Property, plant and equipment, net | 9,202 | 9,238 | |||||
| Intangible assets, net | 2,919 | 2,990 | |||||
| Deferred income taxes | 1,777 | 4,105 | |||||
| Operating lease - Right-of-use asset | 4,838 | 4,906 | |||||
| Other assets | 185 | 190 | |||||
| Total Assets | $ | 231,471 | $ | 238,668 | |||
| Liabilities and Stockholders' Equity | |||||||
| Current Liabilities | |||||||
| Accounts payable | $ | 7,749 | $ | 6,925 | |||
| Accrued expenses | 9,275 | 8,546 | |||||
| Accrued litigation costs | — | 16,000 | |||||
| Accrued salaries and wages | 5,036 | 4,484 | |||||
| Dividends payable | 6,081 | 5,365 | |||||
| Accrued income taxes | — | 1,134 | |||||
| Total Current Liabilities | 28,141 | 42,454 | |||||
| Accrued income taxes | — | 33 | |||||
| Operating lease liability | 5,142 | 5,179 | |||||
| Total Liabilities | 33,283 | 47,666 | |||||
| Commitments and Contingencies (Note 13) | |||||||
| Stockholders' Equity | |||||||
| Common Stock, par value $0.01 per share; 100,000,000 shares authorized; 39,883,051 sharesissued; and 35,768,437 shares outstanding as of both September 30, 2026 and June 30, 2026,respectively. | 399 | 399 | |||||
| Additional paid-in capital | 25,628 | 25,355 | |||||
| Retained earnings | 228,331 | 221,403 | |||||
| Treasury Stock, at cost, 4,114,614 shares as of both September 30, 2026 and June 30, 2026 | (56,315) | (56,315) | |||||
| Accumulated other comprehensive income | 145 | 160 | |||||
| Total Stockholders' Equity | 198,188 | 191,002 | |||||
| Total Liabilities and Stockholders' Equity | $ | 231,471 | $ | 238,668 |
| NAPCO SECURITY TECHNOLOGIES, INC. AND SUBSIDIARIES | ||||||
| CONDENSED CONSOLIDATED STATEMENTS OF OPERATIONS | ||||||
| (Unaudited) | ||||||
| Three Months ended September 30, | ||||||
| 2026 | 2025 | |||||
| (in thousands, except for share and per share data) | ||||||
| Revenue: | ||||||
| Equipment revenue | $ | 23,850 | $ | 25,739 | ||
| Service revenue | 26,130 | 23,429 | ||||
| Total revenue | 49,980 | 49,168 | ||||
| Cost of Revenue: | ||||||
| Cost of equipment revenue | 18,043 | 19,046 | ||||
| Cost of service revenue | 2,585 | 2,276 | ||||
| Total cost of revenue | 20,628 | 21,322 | ||||
| Gross Profit | 29,352 | 27,846 | ||||
| Operating Expenses: | ||||||
| Research and development | 4,053 | 3,240 | ||||
| Selling, general, and administrative | 12,182 | 10,963 | ||||
| Litigation settlement | (1,000) | — | ||||
| Total operating expenses | 15,235 | 14,203 | ||||
| Operating Income | 14,117 | 13,643 | ||||
| Other Income: | ||||||
| Interest income, net | 1,117 | 854 | ||||
| Other income, net | 115 | 138 | ||||
| Income before Provision for Income Taxes | 15,349 | 14,635 | ||||
| Provision for Income Taxes | 2,340 | 2,470 | ||||
| Net Income | $ | 13,009 | $ | 12,165 | ||
| Income Per Share: | ||||||
| Basic | $ | 0.36 | $ | 0.34 | ||
| Diluted | $ | 0.36 | $ | 0.34 | ||
| Weighted Average Number of Shares Outstanding: | ||||||
| Basic | 35,768,000 | 35,658,000 | ||||
| Diluted | 35,881,000 | 35,865,000 |
| NAPCO SECURITY TECHNOLOGIES, INC. AND SUBSIDIARIES | |||||||
| CONDENSED CONSOLIDATED STATEMENTS OF CASH FLOWS | |||||||
| (unaudited) | |||||||
| Three Months ended September 30, | |||||||
| 2026 | 2025 | ||||||
| (in thousands) | |||||||
| Cash Flows from Operating Activities | |||||||
| Net Income | $ | 13,009 | $ | 12,165 | |||
| Adjustments to reconcile net income to net cash provided by operating activities: | |||||||
| Depreciation and amortization | 540 | 570 | |||||
| Realized gain on sales of marketable securities | (114) | (92) | |||||
| Charge (recovery) of credit losses | 28 | (1) | |||||
| Change to inventory reserve | (109) | (354) | |||||
| Deferred income taxes | 2,328 | 1,681 | |||||
| Stock-based compensation expense | 273 | 309 | |||||
| Changes in operating assets and liabilities: | |||||||
| Accounts and other receivable | 6,699 | (561) | |||||
| Inventories | (3,842) | (177) | |||||
| Prepaid expenses and other current assets | 487 | (305) | |||||
| Income tax receivable | (1,523) | (1,993) | |||||
| Other assets | 5 | 4 | |||||
| Accounts payable, accrued expenses, accrued litigation costs, accrued salaries and wages,accrued income taxes | (15,031) | 391 | |||||
| Net Cash Provided by Operating Activities | 2,750 | 11,637 | |||||
| Cash Flows from Investing Activities | |||||||
| Purchases of property, plant, and equipment | (433) | (193) | |||||
| Purchases of marketable securities | (3,570) | (2,540) | |||||
| Proceeds from sales of marketable securities | 3,572 | 8,407 | |||||
| Net Cash (Used In) Provided by Investing Activities | (431) | 5,674 | |||||
| Cash Flows from Financing Activates | |||||||
| Dividends paid | (5,365) | (4,992) | |||||
| Net Cash Used in Financing Activities | (5,365) | (4,992) | |||||
| Net (decrease) increase in Cash and Cash Equivalents | (3,046) | 12,319 | |||||
| Cash and Cash Equivalents - Beginning | 126,928 | 83,081 | |||||
| Cash and Cash Equivalents - Ending | $ | 123,882 | $ | 95,400 | |||
| Supplemental Cash Flow Information | |||||||
| Income taxes paid, net of refunds received | $ | 2,701 | $ | 3,104 | |||
| Non-Cash Investing and Financing Transactions | |||||||
| Dividends declared and not paid | $ | 6,081 | $ | 4,992 |
| NAPCO SECURITY TECHNOLOGIES, INC. | ||||||||||||
| RECONCILIATION OF GAAP TO NON-GAAP FINANCIAL DATA* | ||||||||||||
| (unaudited) | ||||||||||||
| (in thousands, except share and per share data) | ||||||||||||
| Non-GAAP Adjustments | ||||||||||||
| Litigation | Tax | |||||||||||
| GAAP | Settlement | Adjustments (1) | Non-GAAP | |||||||||
| Three months ended September 30, 2026 | ||||||||||||
| Revenue | $ | 49,980 | $ | — | $ | — | $ | 49,980 | ||||
| Gross Profit | 29,352 | — | — | 29,352 | ||||||||
| Operating Expenses | 15,235 | 1,000 | — | 16,235 | ||||||||
| Operating Income | 14,117 | (1,000) | — | 13,117 | ||||||||
| Net Income | 13,009 | (1,000) | 108 | 12,117 | ||||||||
| Non-GAAP adjusted net income margin | 24.2 | % | ||||||||||
| Non-GAAP adjusted net income per share - diluted | $ | 0.34 | ||||||||||
| Three months ended September 30, 2025 | ||||||||||||
| Revenue | $ | 49,168 | $ | — | $ | — | $ | 49,168 | ||||
| Gross Profit | 27,846 | — | — | 27,846 | ||||||||
| Operating Expenses | 14,203 | — | — | 14,203 | ||||||||
| Operating Income | 13,643 | — | — | 13,643 | ||||||||
| Net Income | 12,165 | — | — | 12,165 | ||||||||
| Non-GAAP adjusted net income margin | 24.7 | % | ||||||||||
| Non-GAAP adjusted net income per share - diluted | $ | 0.34 | ||||||||||
| Three months ended September 30, | ||||||||||||
| 2026 | 2025 | |||||||||||
| Denominator: | ||||||||||||
| Weighted average shares outstanding | ||||||||||||
| Basic, as reported | 35,768,000 | 35,658,000 | ||||||||||
| Effect of Dilutive Securities | 113,000 | 207,000 | ||||||||||
| Diluted, (Denominator) | 35,881,000 | 35,865,000 |
| 1. | The 'with or without' method is utilized to determine the income tax effect of all Non-GAAP adjustments. |
| NAPCO SECURITY TECHNOLOGIES, INC. | ||||||
| RECONCILIATION OF GAAP TO NON-GAAP FINANCIAL DATA* | ||||||
| (unaudited) | ||||||
| (in thousands, except share and per share data) | ||||||
| Three months ended September 30, | ||||||
| 2026 | 2025 | |||||
| Non-GAAP adjusted EBITDA: | ||||||
| Net income, as reported | $ | 13,009 | $ | 12,165 | ||
| Interest income, net | (1,117) | (854) | ||||
| Provision for income taxes | 2,340 | 2,470 | ||||
| Depreciation and amortization | 540 | 570 | ||||
| Non-GAAP EBITDA | 14,772 | 14,351 | ||||
| Adjustments: | ||||||
| Stock based compensation | 273 | 309 | ||||
| Nonrecurring legal expense(1) | 1,464 | 282 | ||||
| Litigation settlement(2) | (1,000) | — | ||||
| Total adjustments | 737 | 591 | ||||
| Non-GAAP adjusted EBITDA | $ | 15,509 | $ | 14,942 | ||
| Non-GAAP adjusted EBITDA margin | 31.0 | % | 30.4 | % | ||
| Non-GAAP per share data: | ||||||
| Non-GAAP adjusted EBITDA per share - diluted | $ | 0.43 | $ | 0.42 | ||
| Denominator: | ||||||
| Weighted average shares outstanding | ||||||
| Basic, as reported | 35,768,000 | 35,658,000 | ||||
| Effect of Dilutive Securities | 113,000 | 207,000 | ||||
| Diluted, (Denominator) | 35,881,000 | 35,865,000 |
| 1. | Nonrecurring Legal Expenses, which are net of any insurance reimbursements, are legal fees that are determined not to be of a normal recuring nature and expenses necessary to operate the business |
| 2. | Litigation settlement costs, which are net of any insurance reimbursements, were determined not to be of a recurring nature and costs that are not in the normal cost of business or necessary to operate the business |
| Three months ended September 30, | |||||||
| (dollars in thousands) | |||||||
| 2026 | 2025 | ||||||
| Free cash flow: | |||||||
| Net Cash Provided by Operating Activities | $ | 2,750 | $ | 11,637 | |||
| Less: Purchases of property, plant, and equipment | (433) | (193) | |||||
| Free Cash Flow(1) | $ | 2,317 | $ | 11,444 | |||
| Free Cash Flow Margin(1) | 4.6 | % | 23.3 | % |
| 1. | Free cash flow is calculated as net cash provided by operating activities less capital expenditures. Free cash flow margin is the free cash flow divided by revenue. |
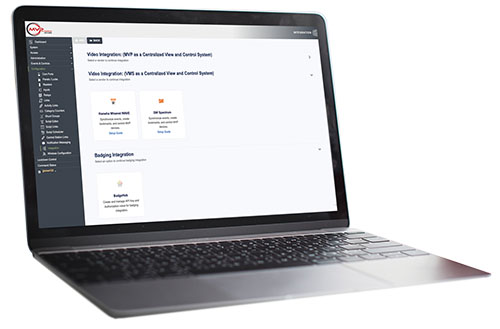 Amityville, NY & Ridgeland, MS – NAPCO Security Technologies today announced a new integration between its MVP-EZ and MVP Access cloud-based access control platform and BadgeHub, the credential management and badging platform from BadgePass.






 Amityville, NY – NAPCO Security Technologies, Inc. (NASDAQ: NSSC), a leading manufacturer of electronic security products, announced the creation of the Chief Revenue Officer (CRO) role and the appointment of Joseph C. Pipczynski, Jr. to the position, effective January 20, 2026. Joe Pipczynski will report to Kevin Buchel, President and Chief Operating Officer. In addition, Stephen Spinelli, Senior Vice President of Sales, will report directly to Mr. Pipczynski.