Novanta Inc. is a global supplier of precision technology solutions for medical, life science, and advanced industrial original equipment manufacturers. The company operates through two reportable segments: Automation Enabling Technologies and Medical Solutions. Its product portfolio includes laser beam steering and scanning solutions, laser sources, robotic and precision motion systems, robotic end-of-arm tooling, bearing spindles, and RFID solutions. Novanta serves customers in advanced industrial processes, medical robotics, ophthalmology, patient monitoring, drug delivery, and clinical laboratory testing. The company was founded in 1968 as General Scanning, Inc., merged with Lumonics Inc. in 1999 to form GSI Lumonics Inc., changed its name to GSI Group Inc. in 2005, and adopted the name Novanta Inc. in May 2016. Recent acquisitions include Keonn Technologies, Motion Solutions Parent Corp., MPH Medical Devices, ATI Industrial Automation, Schneider Electric Motion USA, ARGES GmbH, Zettlex Holdings, Laser Quantum, and W.O.M. World of Medicine.

Summarised from the company's own disclosures, fiscal year ended Feb 2026

Industry Electrical Equipment & Parts Homepage novanta.com
Sector Industrials IR page investors.novanta.com/overview/default.aspx
Tags
laser beam steering, robotic end-of-arm tooling, precision motion, bearing spindles, rfid solutions, medical robotics, ophthalmology, drug delivery, clinical laboratory testing, laser additive manufacturing, automation, metrology, Keonn Technologies, Motion Solutions Parent Corp., MPH Medical Devices, ATI Industrial Automation, Schneider Electric Motion USA, ARGES GmbH, Zettlex Holdings, Laser Quantum, W.O.M. World of Medicine
Press page novanta.com/news

Metrics

Valuation  
Market cap $ 5.378B
Market cap (USD) $ 5.378B
P/E 107.72
PEG —
P/BV 3.31
P/S 4.95
P/OCF 32.65
P/FCF 38.29
Dividend yield —
Turnover / mcap —
Returns  
ROE 5.2%
ROI 3.4%
ROIC 4.6%
Profit margin 5.5%
Growth  
Revenue growing Yes
Profits growing No
Revenue up 3y Yes
Revenue up 5y Yes
Earnings growth 3y (net profit CAGR) -10.1%
Quality  
Profitable Yes
Margin expanding No
Buying back stock No
Diluting (TTM) Yes
Debt/Equity 51.1%
Podcast bulls (TTM) Sign up
Podcast bears (TTM) Sign up
Podcast sentiment (TTM) Sign up
Podcast sentiment % (TTM) Sign up
News sentiment (TTM) 24
Quality score -11.1%
Insiders  
Buys, 1w Sign up
Buys, 1m Sign up
Buys, 1y Sign up
Sells, 1w Sign up
Sells, 1m Sign up
Sells, 1y Sign up

Sign up to see this company's insider trades

Figure FY 2025 FY 2024 FY 2023 FY 2022 FY 2021 FY 2020 FY 2019 FY 2018 FY 2017 FY 2016 FY 2015 FY 2014 FY 2013 FY 2012 FY 2011 FY 2010 FY 2009 FY 2008 FY 2007 FY 2006 FY 2005 FY 2004 FY 2003 FY 2002 FY 2001 FY 2000
Revenue 980.6M 949.245M 881.662M 860.903M 706.793M 590.623M 626.099M 614.337M 521.29M 384.758M 373.598M 364.706M 341.612M 271.498M 366.28M 383.516M 254.388M 288.468M 317.8M 313.609M 260.784M 330.012M 185.561M 159.07M 247.904M 373.864M
Net profit 53.829M 64.087M 72.878M 74.051M 50.331M 44.521M 40.773M 49.109M 60.051M 22.003M 35.615M -24.252M 7.309M 19.538M 28.973M -687K -71.33M -203.847M 19.044M 21.743M 9.657M 41.471M -2.17M -27.724M -14.698M 45.377M
Free cash flow 48.429M 141.35M 100.114M 71.136M 74.649M 129.715M 52.505M 74.989M 54.284M 39.326M 27.864M 36.874M 44.212M 24.122M 40.956M -7.397M -27.107M 20.951M 32.662M 26.694M 823K 32.987M 19.128M 8.765M -26.117M -20.362M

Figure FY 2025 FY 2024 FY 2023 FY 2022 FY 2021 FY 2020 FY 2019 FY 2018 FY 2017 FY 2016 FY 2015 FY 2014 FY 2013 FY 2012 FY 2011 FY 2010 FY 2009 FY 2008 FY 2007 FY 2006 FY 2005 FY 2004 FY 2003 FY 2002 FY 2001 FY 2000
Share price 118.99 152.77 168.41 135.87 176.33 118.22 88.44 63 50 21 — — — — — — — — — 2.25 — — — — — —
Price performance 12m -0.22 -0.09 0.24 -0.23 0.49 0.34 0.4 0.26 1.38 — — — — — — — — — — — — — — — — —

Filed figures

Figure Dec 2016 Dec 2017 Dec 2018 Dec 2019 Dec 2020 Dec 2021 Dec 2022 Dec 2023 Dec 2024 Dec 2025
Balance sheet detail
Trade receivables (USD) 63.8M 81.5M 84M 91.1M 75.1M 116M 138M 139M 151M 185M
↳ YoY growth +11.5% +27.8% +3.0% +8.5% -17.6% +54.0% +19.1% +1.2% +8.3% +22.4%
↳ 5y CAGR +4.9% +13.8% +9.3% +12.1% +5.6% +12.6% +11.1% +10.7% +10.6% +19.8%
Borrowings, current (USD) 7.37M 9.12M 4.54M 5.03M 5.51M 5.1M 4.8M 4.97M 4.69M 38.3M
Borrowings, non-current (USD) 70.6M 226M 203M 215M 195M 429M 431M 349M 412M 213M
Lease liabilities (USD) — — 7.28M 55.3M 54.6M 58.9M 53.9M 50.2M 54.4M 51.9M
Cash and deposits (USD) 68.1M 100M 82M 78.9M 125M 117M 100M 105M 114M 381M
Intangible assets (USD) 61.7M 155M 143M 166M 149M 221M 176M 145M 186M 181M
Right-of-use assets (USD) — — — 35.2M 34.4M 48.3M 43.3M 38.3M 42.9M 41.7M
Net debt (borrowings + leases - cash) (USD) 9.81M 135M 125M 197M 130M 376M 389M 300M 357M -78.1M
Cash flow detail
Operating cash flow (USD) 47.8M 63.4M 89.6M 63.2M 140M 94.6M 90.8M 120M 159M 64.1M
Purchases of property, plant and equipment (USD) -8.46M -9.09M -14.7M -10.7M -10.5M -20M -19.6M -20M -17.2M -15.6M
Purchases of intangible assets (USD) -3.98M — -1.6M — — — — — — —
Change in receivables (cash effect) (USD) -6.39M -2.08M -1.16M -3.6M 18M -25.4M -23.2M -127,000 -6.19M -27.3M
Change in inventories (cash effect) (USD) -2.92M -13.6M -15.6M -7.4M 22.1M -19.1M -48.5M 11.4M 4.78M -36.1M
Share buybacks (cash effect) (USD) -1.63M -370,000 -5.85M -10M -5.5M — -10M — — -39.3M
Interest paid (cash effect) (USD) -2.92M -5.83M -8.92M -8.39M -5.53M -6.21M -14.3M -25.3M -32.7M -22.6M
Income taxes paid (cash effect) (USD) -14.1M -21.1M -20.3M -14.3M -5.88M -11.3M -20.3M -36.9M -21.2M -36.7M
Share-based compensation (USD) 4.29M 5.49M 7.71M 9.34M 23.1M 25.6M 23.1M 25.6M 23.3M 29.5M
Operating cash flow before change in receivables (USD) 54.2M 65.5M 90.8M 66.8M 122M 120M 114M 120M 165M 91.3M
Free cash flow (OCF - PPE - intangibles) (USD) 35.3M 54.3M 75M 52.5M 130M 74.6M 71.1M 100M 141M 48.4M
Income detail
Research and development expense (USD) 32M 41.7M 51M 56M 61M 72.5M 85.8M 91.7M 95.5M 95.5M
↳ 5y CAGR +0.0% +13.2% +14.1% +14.1% +14.5% +17.8% +15.5% +12.4% +11.3% +9.4%
Total comprehensive income (USD) 13.1M 72.1M 46.4M 45.2M 50.4M 49.7M 54.9M 80.8M 58.2M 80.7M
Comprehensive income to owners (USD) 13.1M 69.9M 44.5M 45.2M 50.4M — — — — —
Provision for credit losses (USD) 135,000 283,000 66,000 33,000 158,000 121,000 532,000 175,000 223,000 897,000
Credit cost ratio (credit losses / average receivables) (%) 0.2% 0.4% 0.1% 0.0% 0.2% 0.1% 0.4% 0.1% 0.2% 0.5%
Reported Mar 6, 2017 Feb 28, 2018 Feb 26, 2020 Feb 26, 2020 Mar 1, 2021 Mar 1, 2022 Mar 1, 2023 Feb 28, 2024 Feb 25, 2025 Feb 23, 2026

Sign up to see institutional holdings

Sign Up

Podcast Mentions

Sign up to see podcast mentions and sentiment

Sign Up

Novanta Announces Financial Results Bull 4 Bear 0 Results

for the Third Quarter 2026

•Third Quarter 2026 GAAP Revenue increased 23% to $305 million

•Third Quarter 2026 GAAP Net Income was $2 million, and Adjusted EBITDA increased 38% to $80 million

•Third Quarter 2026 GAAP Diluted EPS was $0.05, and Adjusted Diluted EPS increased 21% to $1.05

BOSTON, November 9, 2026 -- Novanta Inc. (Nasdaq: NOVT) (“Novanta” or the “Company”), a trusted technology partner to medical and advanced technology equipment manufacturers, today reported financial results for the third quarter 2026.

Financial Highlights

Three Months Ended

(In millions, except per share amounts)

October 2,

September 26,

2026

2025

GAAP

Revenue

$

305.0

$

247.8

Operating Income

$

13.9

$

21.8

Net Income

$

2.0

$

10.7

Diluted EPS

$

0.05

$

0.30

Non-GAAP*

Adjusted Operating Income

$

65.1

$

47.4

Adjusted Diluted EPS

$

1.05

$

0.87

Adjusted EBITDA

$

80.3

$

58.1

*Reconciliations of GAAP to non-GAAP financial measures, as well as definitions for the non-GAAP financial measures included in this press release and the reasons for their use, are presented below.

Published on November 6, 2026

By Taylor Anepete, Human Resources Generalist  Creating opportunities for employees to connect doesn’t have to happen in a single event. Sometimes, the best approach is to spread the fun throughout the week so everyone has a chance to participate.  That was the idea behind this year’s Halloween Spirit Week at our site in Bedford, Massachusetts.…

Published

November 6, 2026

Reading time

3 minutes

Category

News

Share

By Taylor Anepete, Human Resources Generalist 

Creating opportunities for employees to connect doesn’t have to happen in a single event. Sometimes, the best approach is to spread the fun throughout the week so everyone has a chance to participate. 

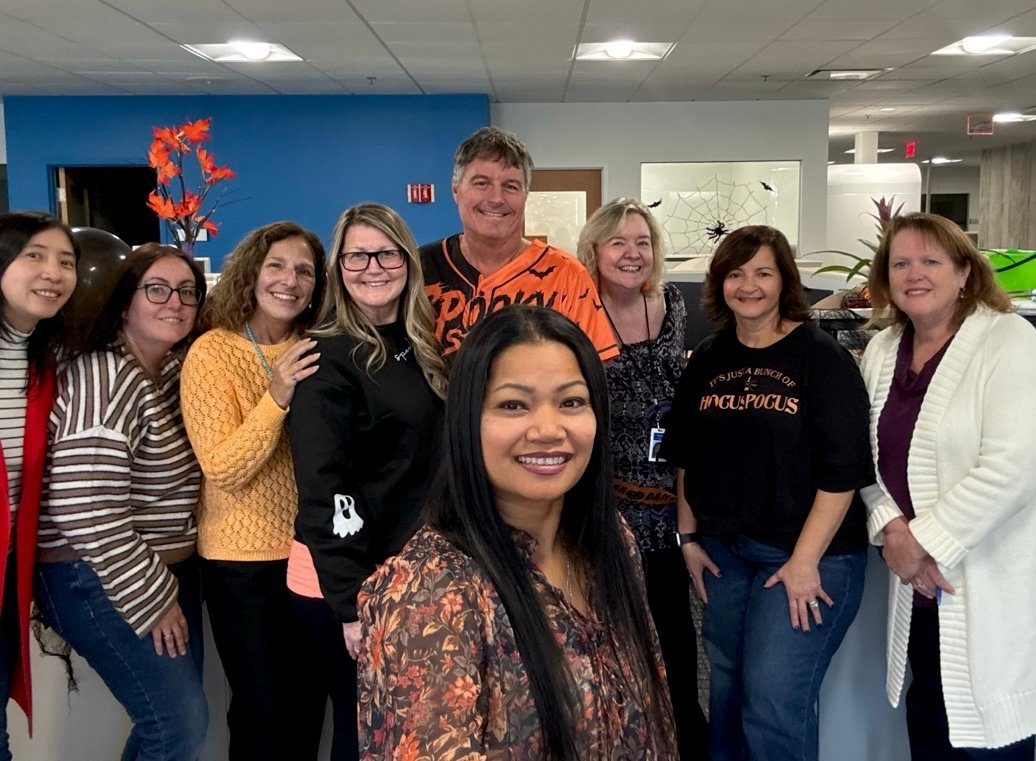
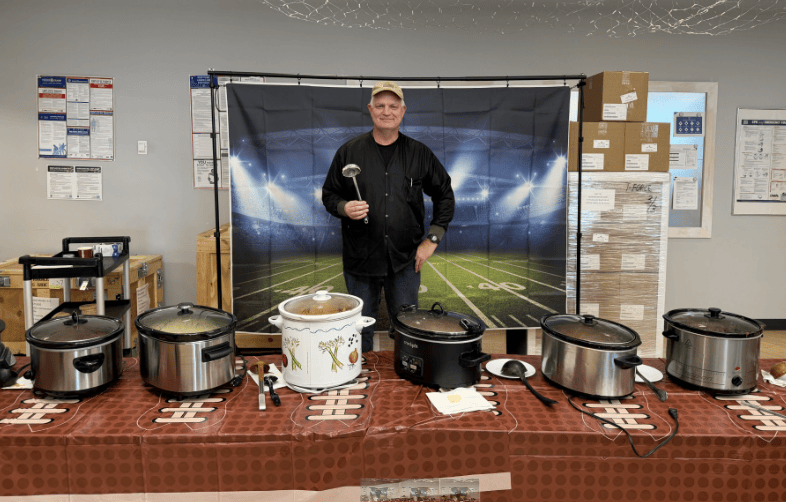
That was the idea behind this year’s Halloween Spirit Week at our site in Bedford, Massachusetts. Rather than focusing on one day, we planned activities across the entire week, making it easier for employees to join in based on their schedules and interests. 

The week began with Monster Match Monday, where employees showed off their most creative mismatched outfits. On Trick or Treat Tuesday, employees shared treats and surprises with coworkers, creating small moments of connection throughout the day. 

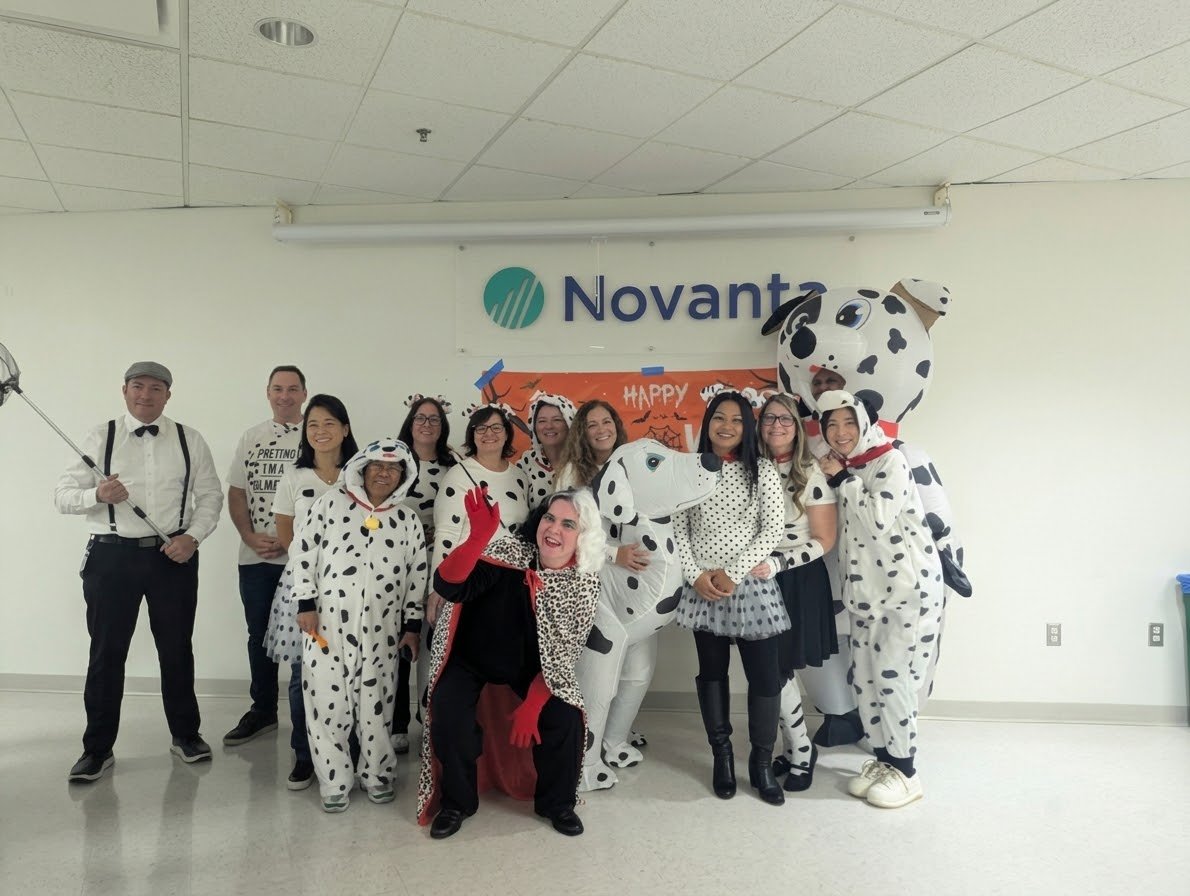
The Halloween Costume Contest on Wednesday brought creativity and friendly competition to the workplace. Employees embraced the challenge with a wide range of costumes, from historical figures to movie characters and modern technology-inspired looks. 

The winners included: 

  • Best Overall: John Wyatt, Production Planner, as Ben Franklin  

  • Best Group: The Shared Services Team as 101 Dalmatians 

  • Funniest: Amy Williams, Principal Talent Acquisition Partner, as Copilot 

  • Scariest: Me as a Devil 

  • Best Duo: Michele Mann, Manufacturing Assembly Test Technician IV, and Jon McPhail, Failure Analysis Technician, as characters from Back to the Future 

Employees continued the celebration on Thursday with Decade Day before wrapping up the week with a Pumpkin Carving Contest on Friday. Throughout the week, teams also decorated workspaces, shared photos of their children and pets, and participated in daily trivia activities. 

While the costumes, pumpkins, and friendly competition brought plenty of excitement, the biggest success was the strong participation throughout the week. Spreading activities across multiple days gave more employees the opportunity to get involved, connect with coworkers, and share in the fun. 

The result was a week filled with creativity, laughter, and connection that strengthened relationships across teams and made Halloween Spirit Week a success

Upcoming events

Stay informed about our latest events! Join us for exclusive insights, networking opportunities, and the unveiling of our newest innovations. Don’t miss out on the chance to connect with industry leaders and explore cutting-edge advancements.

Delivering Innovation that Matters.

About us

Industries

Capabilities

Investors

Careers & Culture

Products


© 2026 Novanta Inc. All Rights Reserved.

The Brain Behind the Operating Room Bull 0 Bear 0 Other

Published on November 5, 2026

By Andrew Park, Senior Manager of Product Management  Every surgical procedure depends on more than the people in the room.  Behind the displays, cameras, imaging systems, and medical devices is a network of technology that connects critical information and helps keep the operating room running smoothly.  Our Advanced Surgery business partners with leading medical technology…

Published

November 5, 2026

Reading time

3 minutes

Category

News

Topics

Share

By Andrew Park, Senior Manager of Product Management 

Every surgical procedure depends on more than the people in the room. 

Behind the displays, cameras, imaging systems, and medical devices is a network of technology that connects critical information and helps keep the operating room running smoothly. 

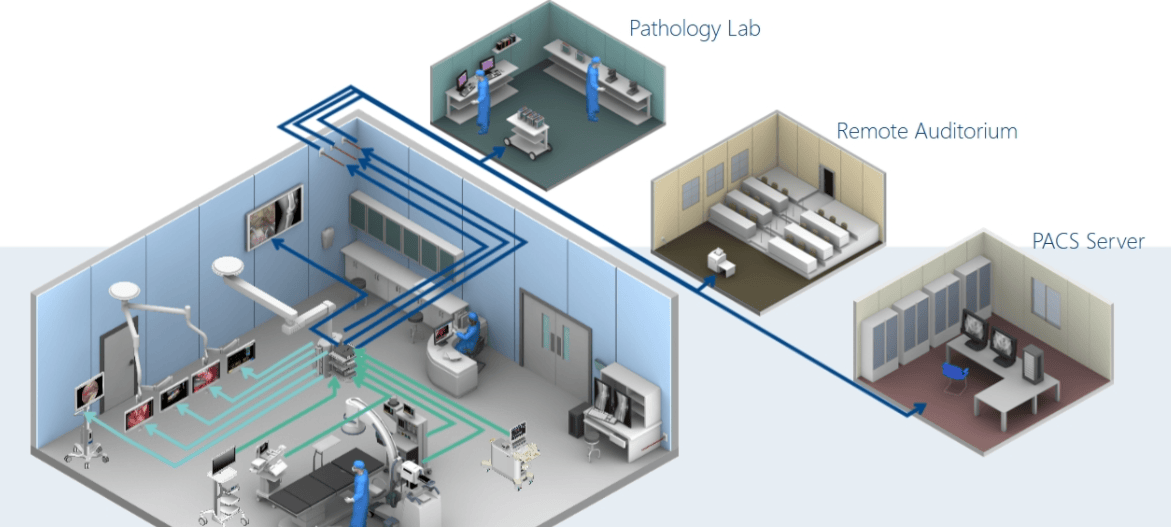
Our Advanced Surgery business partners with leading medical technology manufacturers to develop Integrated Operating Room (iOR) technologies that serve as the foundation for connected surgical environments. These technologies are integrated into platforms that help bring together the systems clinicians rely on every day. 

Connecting the Modern Operating Room 

Today’s operating rooms depend on video systems, imaging equipment, displays, communication tools, and device controls. 

Historically, many of these technologies operated independently. Working closely with OEM partners, we develop iOR technologies that help bring these capabilities together through centralized platforms that combine video management, device control, communication, advanced imaging features, and remote monitoring capabilities. 

By simplifying access to these technologies, OEM partners can deliver more efficient workflows and a more streamlined user experience for clinical teams. 

Making Advanced Technology Easier to Use 

As surgical technology becomes more sophisticated, ease of use becomes increasingly important. 

Healthcare organizations need systems that are intuitive to deploy, manage, and operate. Through close collaboration with OEM customers, we have focused on improving usability and simplifying configuration, administration, and maintenance. 

Many functions that once required specialized technical expertise can now be managed through intuitive graphical interfaces, helping reduce complexity for healthcare providers. 

Enabling Collaboration and Learning 

The value of integrated operating room technology extends beyond a single procedure. 

Technologies developed with our OEM customers support capabilities such as secure recording, streaming, and sharing of high-quality 4K video, creating opportunities for education, training, and collaboration. 

These capabilities allow healthcare organizations to review procedures, learn from complex cases, and share expertise across healthcare networks, helping extend knowledge beyond the operating room itself. 

Innovation Through Collaboration 

Much of our impact on advanced surgery happens behind the scenes. 

Our engineers collaborate closely with OEM customers to solve complex technical and clinical challenges while developing technologies that support modern surgical environments. 

One example is advanced FPGA technology that enables features such as real-time overlays, picture-in-picture displays, video walls, and advanced video routing. These capabilities help clinicians access and manage critical information more effectively during procedures. 

Together, these collaborations combine engineering expertise with customer insights to advance the future of connected surgery. 

Advancing Connected Healthcare 

As healthcare becomes increasingly connected, integrated operating room technologies help create the foundation for future innovation. 

By bringing devices, data, and workflows together, these technologies can help OEM partners support workflow automation, improve efficiency, generate valuable operational insights, and prepare for future AI-enabled capabilities. 

From simplifying workflows to supporting collaboration and future innovation, these technologies help clinicians focus on what matters most: delivering exceptional patient care. 

It’s another example of how our innovation helps enable healthcare technologies that improve lives around the world every day. 

Upcoming events

Stay informed about our latest events! Join us for exclusive insights, networking opportunities, and the unveiling of our newest innovations. Don’t miss out on the chance to connect with industry leaders and explore cutting-edge advancements.

Delivering Innovation that Matters.

About us

Industries

Capabilities

Investors

Careers & Culture

Products


© 2026 Novanta Inc. All Rights Reserved.

Prompts

Novanta Inc. (ticker NOVT), listed in United States.

Company History

Date Change Detail
May 12, 2016 Renamed GSI GROUP INC → NOVANTA INC
Jun 27, 2005 Renamed GSI LUMONICS INC → GSI GROUP INC
— Predecessor Predecessor GSI Group Inc (CIK 1050925) filed under its own registration; its figures are on its own company page, not shown here.

ETFs Holding Novanta Inc.

ETF Weight in ETF Shares Market value As of
CSMD 2.52% 80,235 $ 11.437M Jul 31, 2026
HUMN 1.40% 9,581 $ 1.105M Nov 17, 2026
ESSC 0.53% 1,338 $ 190.732K Jul 31, 2026
RCGE 0.39% 3,327 $ 380K Nov 18, 2026
SMDX 0.37% 4,101 $ 469.154K Nov 17, 2026
CLSE short -0.32% -19,900 $ -2.91M Aug 31, 2026
PSC 0.32% 45,291 $ 7.348M Jun 30, 2026
GVLU 0.30% 6,886 $ 787.758K Nov 17, 2026
SEIS 0.25% 8,802 $ 1.428M Jun 30, 2026
AVSC 0.13% 35,990 $ 4.146M Nov 16, 2026
JMEE 0.10% 25,803 $ 2.976M Nov 17, 2026
DFAS 0.10% 274,194 $ 32.196M Nov 12, 2026
MSSM 0.03% 1,362 $ 199.152K Aug 31, 2026
JSTC 0.02% 433 $ 49.535K Nov 17, 2026
DFSU 0.01% 2,415 $ 283.569K Nov 12, 2026
DFAC 0.01% 85,269 $ 10.012M Nov 12, 2026
DCOR 0.01% 40,997 $ 4.814M Nov 12, 2026
DXUV 0.01% 5,370 $ 630.545K Nov 12, 2026
EBI 0.01% 352 $ 51.469K Aug 31, 2026
DFAU 0.01% 7,780 $ 913.528K Nov 12, 2026
DFUS 0.01% 11,226 $ 1.318M Nov 12, 2026
DFUV 0.00% 1,595 $ 187.285K Nov 12, 2026
NTRL short 0.00% -434 $ 0.00 Nov 16, 2026

Securities

Ticker Type Class Market Exchange Last price Price date
NOVT canonical Common share — US nasdaq 142.19 USD 2026-09-30
NOVTU Unit — US nasdaq — —