FOR IMMEDIATE RELEASE SYMBOL: MZTI August 25, 2026 TRADED: Nasdaq THE MARZETTI COMPANY REPORTS FOURTH QUARTER AND FISCAL YEAR RESULTS WESTERVILLE, Ohio, August 25 - The Marzetti Company (Nasdaq: MZTI) reported results today for the company’s fiscal…
FOR IMMEDIATE RELEASE
SYMBOL: MZTI
August 25, 2026
TRADED: Nasdaq
THE MARZETTI COMPANY REPORTS FOURTH QUARTER AND FISCAL YEAR RESULTS
WESTERVILLE, Ohio, August 25 - The Marzetti Company (Nasdaq: MZTI) reported results today for
the company’s fiscal fourth quarter and fiscal year ended June 30, 2026.
Fourth Quarter Summary
•
Consolidated fourth quarter net sales declined 2.2% to $465.0 million. Excluding the prior-year quarter’s
$12.2 million in non-core sales attributed to a temporary supply agreement (“TSA”) with Winland Foods,
Inc., which concluded during the quarter ended March 31, 2026, consolidated net sales increased 0.4%.
•
Retail segment net sales increased 0.9% to $243.6 million, which includes $15.4 million of incremental
sales from Bachan’s, Inc., our newly acquired Japanese Barbecue Sauce brand known for its delicious,
authentic, clean-label products. The acquisition closed on May 1, 2026.
•
Foodservice segment net sales decreased 5.3% to $221.4 million on a reported basis. Excluding the noncore TSA sales of $12.2 million in the prior-year quarter, Foodservice segment net sales decreased 0.1%.
•
Consolidated gross profit increased $7.9 million to a fourth quarter record $114.0 million. Reported gross
profit margin improved 220 basis points to 24.5% driven by our ongoing cost savings programs.
•
SG&A expenses increased $12.3 million to $74.3 million. The higher SG&A expenses include a $10.5
million increase in acquisition-related costs in addition to $1.6 million in incremental noncash amortization
expense attributed to Bachan’s intangible assets.
•
Consolidated operating income grew $18.8 million to $57.7 million. In addition to the impacts of the
increased gross profit and higher SG&A expenses, consolidated operating income includes the benefit of an
$18.5 million gain on the sale of our property in Milpitas, California, the former location of the sauce and
dressing facility that we closed in fiscal 2026. The $18.5 million gain is reported as part of the
Restructuring, Impairment and Other line item. In the prior-year period, restructuring and impairment
charges of $5.1 million primarily relate to the Milpitas plant closure.
•
Fourth quarter net income was $1.76 per diluted share versus $1.18 per diluted share last year. In the
current-year quarter, the acquisition-related SG&A expenses decreased net income by $0.31 per diluted
share; the incremental noncash amortization expense for Bachan’s intangible assets reduced net income by
$0.05 per diluted share; and the net impact of all restructuring, impairment and other items, most of which
is the gain on the Milpitas property sale, increased net income by $0.66 per diluted share. In the prior-year
quarter, restructuring and impairment charges reduced net income by $0.15 per diluted share while
acquisition-related SG&A costs reduced net income by $0.01 per diluted share. Excluding these items, the
resulting Adjusted Net Income Per Diluted Share (“Adjusted Diluted EPS”) grew 9.0% to $1.46 in the
current-year quarter, versus $1.34 last year, driven by the higher gross profit.
MORE. . .
PAGE 2 / THE MARZETTI COMPANY REPORTS FOURTH QUARTER AND FISCAL YEAR RESULTS
CEO David A. Ciesinski commented, “We were pleased to report record gross profit and strong gross
margin improvement in our fiscal fourth quarter. In our Retail segment, the newly acquired Bachan’s brand
added $15.4 million in incremental sales. Retail scanner data sourced from Circana for the quarter ended June
shows continued strong performance for the Bachan’s brand, with sales up 8.7% and total distribution points up
16.6% as the brand continues to grow share in the barbecue sauce category. Retail net sales growth was
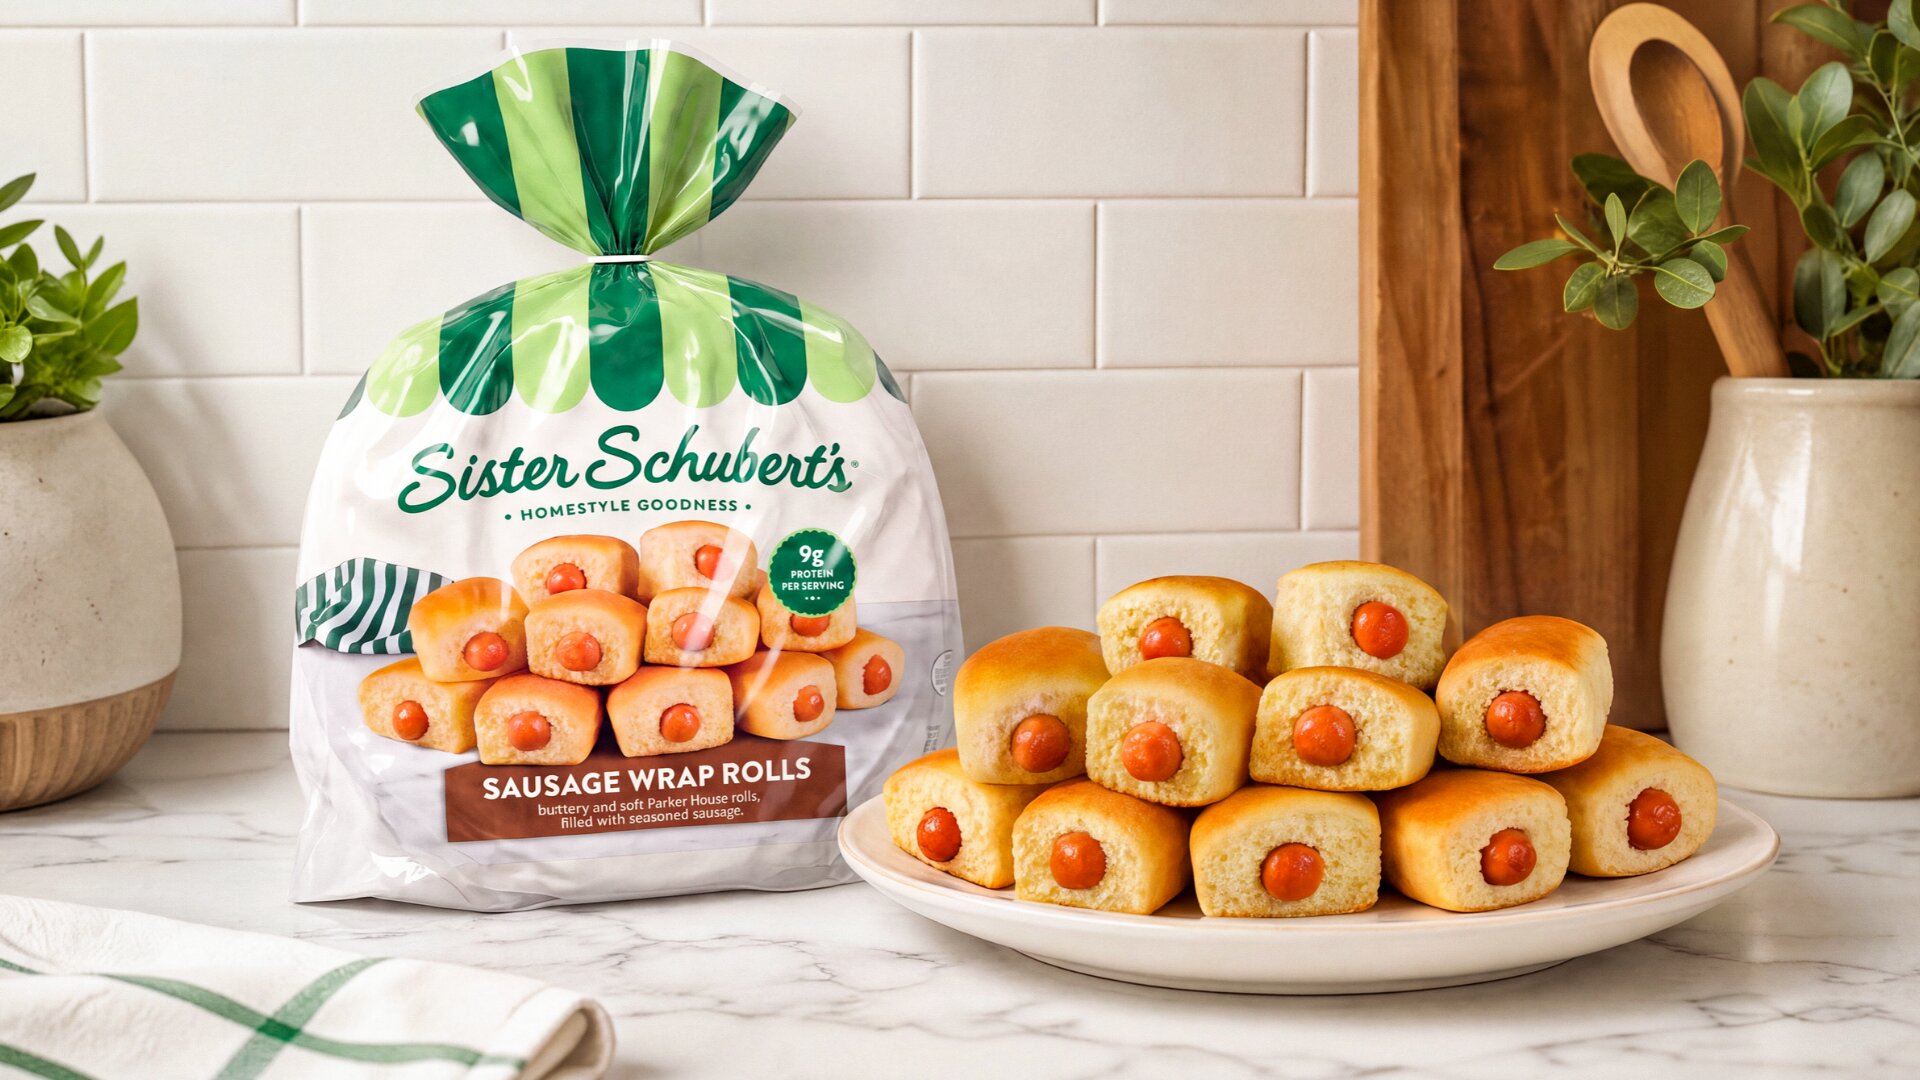
unfavorably impacted by the lapping of last year’s club channel pipeline fill for Chick-fil-A® sauces, reduced
sales of our Sister Schubert’s® dinner rolls in the club channel, and a comparison to the prior year’s rollout of
Texas Roadhouse® dinner rolls into traditional grocery chains. Note that Texas Roadhouse rolls remain a strong
performer in our portfolio, with Circana retail scanner data showing that sales were up 28.1% for the quarter and
76.3% for the fiscal year. In the Foodservice segment, reported net sales decreased 5.3% while Adjusted
Foodservice Net Sales, which exclude the non-core TSA sales, were nearly flat as gains for our leading national
chain restaurant accounts were offset by reduced sales to other chains and lower sales for our branded
Foodservice products.”
Fourth Quarter Results
Fourth quarter consolidated net sales decreased 2.2% to $465.0 million versus $475.4 million last year.
Excluding the non-core sales attributed to the TSA, Adjusted Consolidated Net Sales increased 0.4%. Our newly
acquired Bachan’s business added $15.4 million in net sales, or about 320 basis points of growth. Retail segment
net sales grew 0.9% to $243.6 million while the segment’s sales volume, measured in pounds shipped, declined
1.7%. Bachan’s accounted for 640 basis points of Retail segment net sales growth and 520 basis points of Retail
segment volume growth. In the Foodservice segment, net sales decreased 5.3% to $221.4 million while the
segment’s sales volume, measured in pounds shipped, declined 4.1%. Excluding the non-core TSA sales,
Foodservice segment net sales decreased 0.1% while the segment’s core sales volume improved 0.1%.
Consolidated gross profit increased $7.9 million to a fourth quarter record $114.0 million driven by our
cost savings programs. Gross profit margin increased 220 basis points to 24.5%. Adjusted Gross Margin, which
excludes all non-core TSA sales as those sales did not contribute meaningfully to gross profit, increased
approximately 160 basis points.
SG&A expenses increased $12.3 million to $74.3 million, which includes a $10.5 million increase in
acquisition-related costs in addition to $1.6 million in incremental noncash amortization expense for intangible
assets attributed to Bachan’s. Excluding these items, SG&A expenses were nearly flat as incremental core SG&A
expenses attributed to Bachan’s were offset by cost reductions elsewhere.
The $18.0 million Restructuring, Impairment and Other line item primarily reflects the benefit of an $18.5
million gain on the sale of our property in Milpitas, California, the former location of the sauce and dressing
facility that we closed in fiscal 2026. Restructuring and impairment charges of $5.1 million in the prior-year
quarter included $4.5 million in charges attributed to the closure of the Milpitas plant.
Consolidated operating income increased $18.8 million to $57.7 million as favorably impacted by the
gain on the Milpitas property sale and higher gross profit, partially offset by the increase in SG&A expenses
attributed to the acquisition-related costs and incremental amortization expense for Bachan’s.
Interest expense totaled $1.8 million in the current year versus no interest expense last year, as a portion
of the Bachan’s acquisition purchase price was financed with a $200 million term loan.
MORE. . .
PAGE 3 / THE MARZETTI COMPANY REPORTS FOURTH QUARTER AND FISCAL YEAR RESULTS
Net income increased $15.8 million to $48.3 million, or $1.76 per diluted share, versus $32.5 million, or
$1.18 per diluted share, last year. In the current-year quarter, income reported on the Restructuring, Impairment
and Other line item increased net income by $18.1 million, or $0.66 per diluted share; acquisition-related SG&A
costs reduced net income by $8.5 million, or $0.31 per diluted share; and the incremental noncash amortization
expense for the Bachan’s intangible assets decreased net income by $1.2 million, or $0.05 per diluted share. In
the prior-year quarter, restructuring and impairment charges reduced net income by $4.0 million, or $0.15 per
diluted share, while acquisition-related SG&A costs reduced net income by $0.4 million, or $0.01 per diluted
share. Resulting Adjusted Diluted EPS was $1.46 in the current-year quarter, versus $1.34 last year.
Fiscal Year Results
For the fiscal year ended June 30, 2026, net sales increased 1.1% to $1.93 billion compared to $1.91
billion a year ago. Net income for the fiscal year totaled $191.6 million, or $6.98 per diluted share, versus the
prior-year amount of $167.3 million, or $6.07 per diluted share. The fiscal 2026 results include a net income
benefit of $16.6 million, or $0.60 per diluted share, from income reported on the Restructuring, Impairment and
Other line-item, driven by the proceeds from the sale of our property in Milpitas, California. Fiscal 2026 SG&A
costs also include acquisition-related expenses that reduced net income by $11.3 million, or $0.41 per diluted
share, in addition to incremental noncash amortization expense for intangible assets attributed to the Bachan’s
acquisition that reduced net income by $1.2 million, or $0.05 per diluted share. The fiscal 2025 results include a
noncash settlement charge attributed to the termination of the company’s legacy pension plans that reduced net
income by $10.8 million, or $0.39 per diluted share. In addition, the fiscal 2025 results included restructuring and
impairment charges that reduced net income by $4.0 million, or $0.15 per diluted share, and acquisition-related
SG&A expenditures that reduced net income by $2.9 million, or $0.11 per diluted share. Resulting Adjusted
Diluted EPS was $6.83 in the current year, versus $6.72 last year.
Fiscal 2026 cash flows from operating activities increased $22.3 million to a record $283.8 million. In
addition, as part of our ongoing commitment to return value to our shareholders, the company increased its
regular cash dividend for the 63rd consecutive year in fiscal 2026 with the quarterly cash dividend paid on
December 31, 2025. During the fiscal year, the company paid cash dividends to shareholders totaling $108.8
million and repurchased $36.3 million of common stock.
Fiscal 2027 Outlook
Mr. Ciesinski commented, “Looking ahead to fiscal 2027, Retail segment sales will continue to benefit
from incremental sales attributed to the Bachan’s acquisition in addition to contributions from the new items we
recently launched or have planned for introduction for both our legacy brands and licensing program. In the
Foodservice segment, we expect sales to be supported by select quick-service restaurant customers in our mix of
national chain restaurant accounts. Note that external factors, including U.S. economic performance and
consumer behavior, may impact the topline growth for both segments in the coming year. We also continue to
monitor the impact of the Cyclospora outbreak on product demand and sales. With respect to our input costs, in
aggregate we anticipate a moderate level of inflation in fiscal 2027 that we plan to offset through inflationary
pricing and our cost savings programs as we remain focused on continued margin improvement.”
MORE. . .
PAGE 4 / THE MARZETTI COMPANY REPORTS FOURTH QUARTER AND FISCAL YEAR RESULTS
Conference Call on the Web
The company’s fourth quarter and fiscal year-end conference call is scheduled for this morning,
August 25, at 10:00 a.m. ET. Access to a live webcast and subsequent replay of the call is available through a
link on the company’s website at investors.marzetticompany.com.
About the Company
The Marzetti Company is a manufacturer and marketer of specialty food products for the retail and
foodservice channels.
Forward-Looking Statements
We desire to take advantage of the “safe harbor” provisions of the Private Securities Litigation Reform Act of 1995
(the “PSLRA”). This news release contains various “forward-looking statements” within the meaning of the PSLRA and
other applicable securities laws. Such statements can be identified by the use of the forward-looking words “anticipate,”
“estimate,” “project,” “believe,” “intend,” “plan,” “expect,” “hope” or similar words. These statements discuss future
expectations; contain projections regarding future developments, operations or financial conditions; or state other forwardlooking information. Such statements are based upon assumptions and assessments made by us in light of our experience and
perception of historical trends, current conditions, expected future developments; and other factors we believe to be
appropriate. These forward-looking statements involve various important risks, uncertainties and other factors, many of
which are beyond our control, which could cause our actual results to differ materially from those expressed in the forwardlooking statements. Some of the key factors that could cause actual results to differ materially from those expressed in the
forward-looking statements include:
•
•
•
•
•
•
•
•
•
•
•
•
•
•
•
•
•
•
•
•
•
•
•
•
•
the ability to successfully integrate the acquired Bachan’s business and achieve operational and financial
performance objectives;
changes in demand for our products, which may result from changes in consumer behavior or loss of brand
reputation or customer goodwill;
significant shifts in consumer demand and disruptions to our employees, communities, customers, supply chains,
production planning, operations, and production processes resulting from the impacts of epidemics, pandemics or
similar widespread public health concerns and foodborne outbreaks;
efficiencies in plant operations and our overall supply chain network;
geopolitical events that could create unforeseen business disruptions and impact the cost or availability of raw
materials and energy;
inflationary pressures resulting in higher input costs;
adverse changes in freight, energy or other costs of producing, distributing or transporting our products;
fluctuations in the cost and availability of ingredients and packaging;
the reaction of customers or consumers to pricing actions we take to offset inflationary costs;
price and product competition;
changes in our cash flow or use of cash in various business activities;
the success and cost of new product development efforts;
the lack of market acceptance of new products;
the impact of customer store brands on our branded retail volumes;
the impact of any laws and regulatory matters affecting our food business, including any additional requirements
imposed by the federal, state or local government;
adverse changes in trade policies, including increased tariffs, retaliatory trade measures, or other trade
restrictions;
dependence on key personnel and changes in key personnel;
adequate supply of labor for our manufacturing facilities;
stability of labor relations;
the extent to which good-fitting business acquisitions are identified, acceptably integrated, and achieve operational
and financial performance objectives;
dependence on a wide array of critical third parties to support our operations, including contract manufacturers,
distributors, logistics providers and IT vendors;
cyber-security incidents, information technology disruptions, and data breaches;
the potential for loss of larger programs or key customer relationships;
capacity constraints that may affect our ability to meet demand or may increase our costs;
failure to maintain or renew license agreements;
MORE. . .
PAGE 5 / THE MARZETTI COMPANY REPORTS FOURTH QUARTER AND FISCAL YEAR RESULTS
•
•
•
•
•
•
the possible occurrence of product recalls or other defective or mislabeled product costs;
maintenance of competitive position with respect to other manufacturers;
the outcome of any litigation or arbitration;
the effect of consolidation of customers within key market channels;
changes in estimates in critical accounting judgments; and
risks related to other factors described under “Risk Factors” in other reports and statements filed by us with the
Securities and Exchange Commission, including without limitation our Annual Report on Form 10-K and Quarterly
Reports on Form 10-Q (available at www.sec.gov).
Forward-looking statements speak only as of the date they are made, and we undertake no obligation to update such
forward-looking statements, except as required by law. Management believes these forward-looking statements to be
reasonable; however, you should not place undue reliance on statements that are based on current expectations.