Download as PDF October 22, 2026
Related Documents
- Q3 net revenue of $218.1 million, up 29% sequentially and up 72% year over year
- Infrastructure business up 210% year over year reflecting accelerated adoption of optical AI data center products
CARLSBAD, Calif.--(BUSINESS WIRE)-- MaxLinear, Inc. (Nasdaq: MXL), a leading provider of radio frequency (RF), analog, digital and mixed-signal integrated circuits, today announced financial results for the third quarter ended September 30, 2026.
Third Quarter Financial Summary
($ in thousands, except per share amounts)
| GAAP | |||||||||||||||||
| Three Months Ended | |||||||||||||||||
| September 30, 2026 | June 30, 2026 | September 30, 2025 | Q/Q | Y/Y | |||||||||||||
| Net revenue | $ | 218,057 | $ | 168,847 | $ | 126,459 | 29 | % | 72 | % | |||||||
| Gross Margin | 58.7 | % | 57.8 | % | 56.9 | % | 90 bps | 180 bps | |||||||||
| Operating Expenses | $ | 97,843 | $ | 101,848 | $ | 113,190 | (4 | )% | (14 | )% | |||||||
| Operating Margin | 13.9 | % | (2.5 | )% | (32.7 | )% | 1,640 bps | 4,660 bps | |||||||||
| Diluted Net Income (Loss) Per Share | $ | 0.30 | $ | 0.02 | $ | (0.52 | ) | 1400 | % | 158 | % | ||||||
| Non-GAAP | |||||||||||||||||
| Three Months Ended | |||||||||||||||||
| September 30, 2026 | June 30, 2026 | September 30, 2025 | Q/Q | Y/Y | |||||||||||||
| Gross Margin | 60.0 | % | 59.5 | % | 59.1 | % | 50 bps | 90 bps | |||||||||
| Operating Expenses | $ | 66,515 | $ | 62,798 | $ | 59,546 | 6 | % | 12 | % | |||||||
| Operating Margin | 29.5 | % | 22.3 | % | 12.1 | % | 720 bps | 1,740 bps | |||||||||
| Diluted Net Income Per Share | $ | 0.62 | $ | 0.35 | $ | 0.14 | 77 | % | 343 | % |
Management Commentary
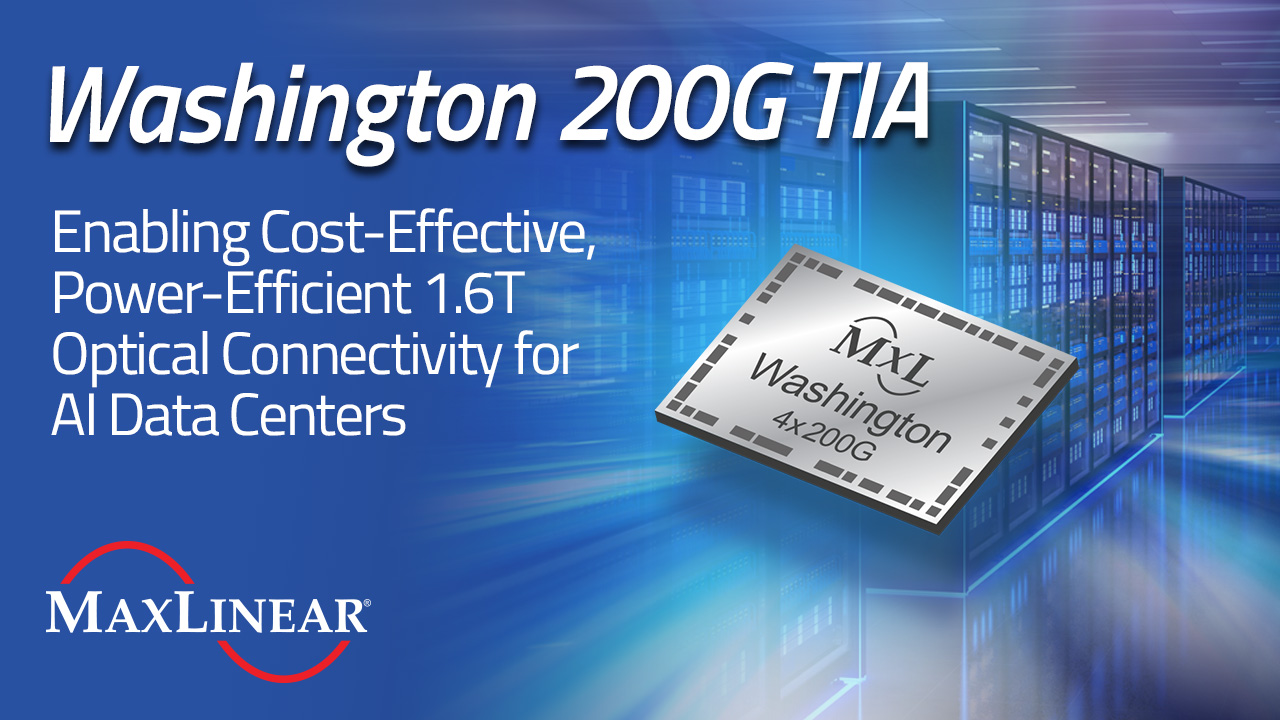
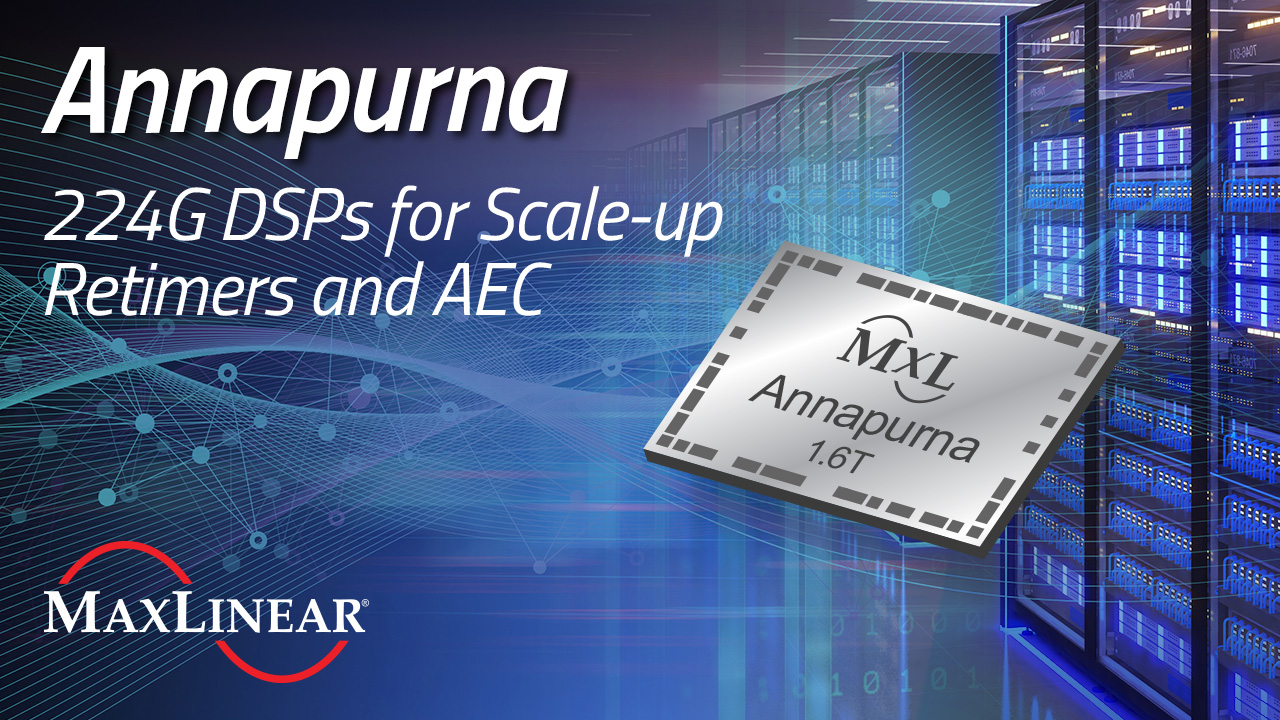
“Our Q3 results underscore the significant growth inflection underway across MaxLinear’s overall business. We delivered 72% year-over-year revenue growth, including 210% growth year over year in AI datacenter-centric infrastructure revenue,” said Kishore Seendripu, Chairman and Chief Executive Officer of MaxLinear. “Strong momentum in our optical AI data center business reflects the volume ramp of our Keystone PAM4 DSP platform, as well as the strength of our expanding infrastructure portfolio and customer activity centered around our Rushmore and Annapurna product families of 1.6T-capable optical and electrical products. These solutions enable a broad range of emerging AI data center architectures. With the convergence of multiple growth drivers fueling our data center-focused business, new product introductions expanding our footprint and content, our relentless focus on innovation, operational excellence, and disciplined execution, we believe MaxLinear is well-positioned to deliver sustained growth, expanding profitability, and long-term value for our shareholders.”
Credit Agreement
MaxLinear today announced that it has amended its existing Credit Agreement with Wells Fargo and other lenders to increase the amounts available under the revolving credit facility by $70 million to $200 million. Additional details regarding the amended Credit Agreement are described in the Company’s Quarterly Report on Form 10-Q for the quarter ended September 30, 2026, filed with the SEC.
Fourth Quarter 2026 Business Outlook
The Company estimates the following (in millions):
| GAAP | Non-GAAP ****(except for revenue) | |||
| Revenue | $240 - $260 | $240 - $260 | ||
| Gross Margin | 58.0% - 61.0% | 59.0% - 62.0% | ||
| Operating Expenses | $96 - $101 | $65 - $70 | ||
| Interest and Other Expense, Net | $3.5 - $4.3 | $3.5 - $4.3 | ||
| Income Tax Provision (Benefit) | $(1.5) | $1.5 | ||
| Fully Diluted Share Count | 99.7 | 99.7 |
Webcast and Conference Call
MaxLinear will host its third quarter financial results conference call today, October 22, 2026 at 1:30 p.m. Pacific Time (4:30 p.m. Eastern Time). To access this call, dial US toll free: 1-877-407-3109 / International: 1-201-493-6798. A live webcast of the conference call will be accessible from the investor relations section of the MaxLinear website at https://investors.maxlinear.com and will be archived and available after the call at https://investors.maxlinear.com until November 5, 2026. A replay of the conference call will also be available until November 5, 2026 by dialing US toll free: 1-877-660-6853 / International: 1-201-612-7415 and Conference ID#: 13763079.
Cautionary Note Concerning Forward-Looking Statements
This press release contains forward-looking statements within the meaning of Section 27A of the Securities Act of 1933, as amended, and Section 21E of the Securities Exchange Act of 1934, as amended. Forward-looking statements can be identified by words such as “anticipate,” “believe,” “could,” “estimate,” “expect,” “intend,” “plan,” “project,” “target,” “seek,” “may,” “should,” “will,” “would” and similar references to future periods. Forward-looking statements include, among others, statements concerning our future financial performance (including our fourth quarter 2026, guidance); our potential for sustained growth and increasing profitability; anticipated growth in our optical data center and infrastructure businesses, including the ramp of our Keystone PAM4 DSP platform and the development, customer adoption, and anticipated availability of our Rushmore and Annapurna product families of 1.6T-capable optical and electrical products; customer engagement and demand trends; the timing and production ramp of new and existing products; settlement of bonus awards for our 2026 performance period; the amendment of our Credit Agreement, the increased commitments under our revolving credit facility, and our available borrowing capacity; and statements by our Chairman and CEO. These forward-looking statements involve known and unknown risks, uncertainties, and other factors that may cause actual results to differ materially from any results expressed or implied by the forward-looking statements. Forward-looking statements are based on management’s current, preliminary expectations and are subject to various risks and uncertainties, including, without limitation, risks relating to: our dependence on the ramp of our optical data center and related connectivity products and the concentration of our anticipated growth in a limited number of hyperscale customers and scale-up and scale-out AI-platform programs, and the risk that adoption, program timing, qualification, or demand for AI and data center infrastructure does not develop or continue as anticipated, including risks related to the sustainability of current AI-related capital expenditure levels by our hyperscale customers; our terminated merger with Silicon Motion and related arbitration and class action complaint and the risks related to potential payment of damages; the effect of intense and increasing competition; increased tariffs, export controls or imposition of additional trade barriers; impacts of global economic conditions; the cyclical nature of the semiconductor industry; a significant variance in our operating results and impact on volatility in our stock price, and our ability to sustain our current level of revenue, which has previously declined, and/or manage future growth effectively; escalating trade wars, military conflicts and other geopolitical and economic tensions among the countries in which we conduct business; international geopolitical and military conflicts; our ability to obtain or retain government authorization to export certain of our products or technology; the loss of, or a significant reduction in orders from major customers; legal proceedings or potential violations of regulations; information technology failures; a decrease in the average selling prices of our products; failure to penetrate new applications and markets; development delays and consolidation trends in our industry; inability to make substantial and productive research and development investments; delays or expenses caused by undetected defects or bugs in our products; substantial quarterly and annual fluctuations in our revenue and operating results; failure to timely develop and introduce new or enhanced products; order and shipment uncertainties and differences between our estimates of customer demand and product mix and our actual results; failure to accurately predict our future revenue and appropriately budget expenses; lengthy and expensive customer qualification processes; customer product plan cancellations; failure to maintain compliance with government regulations; failure to attract and retain qualified personnel; any adverse impact of rising interest rates on us, our customers, and our distributors and related demand; our indebtedness, including borrowings under our revolving credit facility, our ability to comply with applicable covenants, and the possibility that committed borrowing capacity may not be available when needed; risks related to compliance with privacy, data protection and cybersecurity laws and regulations; risks related to conforming our products to industry standards; risks related to business acquisitions and investments; claims of intellectual property infringement; our ability to protect our intellectual property; security vulnerabilities of our products; use of open source software in our products; failure to manage our relationships with, or negative impacts from, third parties, including our dependence on third-party semiconductor foundries and supply chain partners; and future decisions relating to our stock repurchase program. In addition to these risks and uncertainties, investors should review the risks and uncertainties contained in our filings with the SEC, including our Annual Report on Form 10-K for the fiscal year ended December 31, 2025, our Quarterly Report on Form 10-Q for the quarter ended September 30, 2026, and our Current Reports on Form 8-K. All forward-looking statements are based on the estimates, projections and assumptions of management as of October 22, 2026, and MaxLinear is under no obligation (and expressly disclaims any such obligation) to update or revise any forward-looking statements whether as a result of new information, future events, or otherwise.
Use of Non-GAAP Financial Measures
To supplement our unaudited consolidated financial statements presented on a basis consistent with GAAP, we disclose certain non-GAAP financial measures, including, but not limited to, non-GAAP gross profit, non-GAAP gross margin, non-GAAP operating expenses, non-GAAP operating expenses as a percentage of net revenue, non-GAAP income (loss) from operations, non-GAAP income (loss) from operations as percentage of revenue, non-GAAP income (loss) before income taxes, non-GAAP interest and other income (expense), non-GAAP income tax provision (benefit), non-GAAP net income (loss), non-GAAP basic and diluted earnings or income (loss) per share, and non-GAAP diluted share count. These supplemental measures exclude the effects of (i) stock-based compensation expense; (ii) accruals related to our performance-based bonus plans, which we intend to settle, or have settled, in shares of our common stock; (iii) amortization of purchased intangible assets; (iv) research and development funded by others; (v) acquisition and integration costs related to our acquisitions, if any, including costs incurred related to the termination of the previously pending (now terminated) merger with Silicon Motion; (vi) impairment losses, if any; (vii) severance and other restructuring charges, if any; (viii) other non-recurring interest and other income (expenses), net, attributable to acquisitions; and (ix) non-cash income tax benefits and expenses. Non-GAAP financial measures are not meant to be considered in isolation or as a substitute for the comparable GAAP financial measures. Non-GAAP financial measures are subject to limitations and should be read only in conjunction with the company’s consolidated financial statements prepared in accordance with GAAP. Non-GAAP financial measures do not have any standardized meaning and are therefore unlikely to be comparable to similarly titled measures presented by other companies. We believe that these non-GAAP measures have limitations in that they do not reflect all of the amounts associated with our GAAP results of operations. We compensate for the limitations of non-GAAP financial measures by relying upon GAAP results to gain a complete picture of our performance.
We believe that non-GAAP financial measures can provide useful information to both management and investors by excluding certain non-cash and other one-time expenses that we believe are not indicative of our core operating results. Among other uses, our management uses non-GAAP measures to compare our performance relative to forecasts and strategic plans and to benchmark our performance externally against competitors. In addition, management’s incentive compensation will be determined in part using these non-GAAP measures because we believe non-GAAP measures better reflect our core operating performance.
The following are explanations of each type of adjustment that we incorporate into non-GAAP financial measures:
Stock-based compensation expense relates to equity incentive awards granted to our employees, directors, and consultants. Our equity incentive plans are important components of our employee incentive compensation arrangements and are reflected as expenses in our GAAP results. Stock-based compensation expense has been and will continue to be a significant recurring expense for MaxLinear. While we include the dilutive impact of equity awards in weighted average shares outstanding, the expense associated with stock-based awards reflects a non-cash charge that we exclude from non-GAAP net income or loss.
Performance-based equity consists of accruals related to our executive and non-executive bonus programs and have been excluded from our non-GAAP net income or loss for all periods reported. Bonus payments for the 2025 performance periods were settled through the issuance of shares of common stock under our equity incentive plans in February 2026. We currently expect that a substantial portion of bonus awards under our fiscal 2026 program will be settled in common stock in the first quarter of fiscal 2027.
Expenses incurred in relation to acquisitions and other include amortization of purchased intangible assets resulting from acquisitions, acquisition and integration costs primarily consisting of professional and consulting fees, including costs incurred related to the terminated merger with Silicon Motion, and professional fees and expenses incurred in relation to certain intellectual property litigation.
Research and development funded by others represents proceeds received under contracts for jointly funded R&D projects to develop technology that may be commercialized into a product in the future. Initially such proceeds may not yet be recognized in GAAP results if, pursuant to contract terms, the Company may be required to repay all or a portion of the funds provided by the other party under certain conditions. Management believes it is not probable that it will trigger such conditions. Once such conditions have been resolved, the proceeds are recognized in GAAP results, and accordingly, reversed from non-GAAP results.
Restructuring charges incurred are related to our restructuring plans which eliminate redundancies and primarily include severance and restructuring costs related to impairment of leased right-of-use assets or from exiting certain facilities and cancellation of contracts.
Other expense includes accretion of discounts on obligations recorded as a result of abandoned leased facilities for which we continue to be obligated to pay but from which we will receive no future benefit.
Income tax benefits and expense adjustments are those that do not affect cash income taxes payable.
Reconciliations of non-GAAP measures for the historic periods disclosed in this press release appear below. Because of the inherent uncertainty associated with our ability to project certain future charges, particularly stock-based compensation and related tax effects and potential impairments, we are unable to predict such charges or their probable significance without unreasonable effort. Accordingly, in reliance on the exception provided by Item 10(e)(1)(i)(B) of Regulation S-K, we have not provided a reconciliation for non-GAAP guidance provided for the fourth quarter 2026.
About MaxLinear, Inc.
MaxLinear, Inc. (Nasdaq:MXL) is a leading provider of radio frequency (RF), analog, digital and mixed-signal integrated circuits for access and connectivity, wired and wireless infrastructure, and industrial and multi-market applications. MaxLinear is headquartered in Carlsbad, California. For more information, please visit www.maxlinear.com .
MXL is MaxLinear’s registered trademark. Other trademarks appearing herein are the property of their respective owners.
| MAXLINEAR, INC.UNAUDITED GAAP CONSOLIDATED STATEMENTS OF OPERATIONS(in thousands, except per share data) | |||||||||||||||||||
| Three Months Ended | Nine Months Ended | ||||||||||||||||||
| September 30, 2026 | June 30, 2026 | September 30, 2025 | September 30, 2026 | September 30, 2025 | |||||||||||||||
| Net revenue | $ | 218,057 | $ | 168,847 | $ | 126,459 | $ | 524,092 | $ | 331,205 | |||||||||
| Cost of net revenue | 89,987 | 71,184 | 54,558 | 219,475 | 143,948 | ||||||||||||||
| Gross profit | 128,070 | 97,663 | 71,901 | 304,617 | 187,257 | ||||||||||||||
| Operating expenses: | |||||||||||||||||||
| Research and development | 60,642 | 56,033 | 54,252 | 169,837 | 156,908 | ||||||||||||||
| Selling, general and administrative | 36,947 | 45,751 | 47,674 | 125,155 | 117,624 | ||||||||||||||
| Restructuring charges | 254 | 64 | 11,264 | 792 | 24,723 | ||||||||||||||
| Total operating expenses | 97,843 | 101,848 | 113,190 | 295,784 | 299,255 | ||||||||||||||
| Income (loss) from operations | 30,227 | (4,185 | ) | (41,289 | ) | 8,833 | (111,998 | ) | |||||||||||
| Interest income | 465 | 474 | 874 | 1,572 | 2,550 | ||||||||||||||
| Interest expense | (2,692 | ) | (2,269 | ) | (2,649 | ) | (7,158 | ) | (7,665 | ) | |||||||||
| Other income (expense), net | 170 | (570 | ) | (324 | ) | (279 | ) | (5,978 | ) | ||||||||||
| Total other income (expense), net | (2,057 | ) | (2,365 | ) | (2,099 | ) | (5,865 | ) | (11,093 | ) | |||||||||
| Income (loss) before income taxes | 28,170 | (6,550 | ) | (43,388 | ) | 2,968 | (123,091 | ) | |||||||||||
| Income tax provision (benefit) | (732 | ) | (8,310 | ) | 2,097 | 17,443 | (1,307 | ) | |||||||||||
| Net income (loss) | $ | 28,902 | $ | 1,760 | $ | (45,485 | ) | $ | (14,475 | ) | $ | (121,784 | ) | ||||||
| Net income (loss) per share: | |||||||||||||||||||
| Basic | $ | 0.32 | $ | 0.02 | $ | (0.52 | ) | $ | (0.16 | ) | $ | (1.41 | ) | ||||||
| Diluted | $ | 0.30 | $ | 0.02 | $ | (0.52 | ) | $ | (0.16 | ) | $ | (1.41 | ) | ||||||
| Shares used to compute net income (loss) per share: | |||||||||||||||||||
| Basic | 90,816 | 90,043 | 87,186 | 89,497 | 86,368 | ||||||||||||||
| Diluted | 97,714 | 97,333 | 87,186 | 89,497 | 86,368 | ||||||||||||||
| MAXLINEAR, INC.UNAUDITED RECONCILIATION OF NON-GAAP ADJUSTMENTS(in thousands, except per share data) | |||||||||||||||||||
| Three Months Ended | Nine Months Ended | ||||||||||||||||||
| September 30, 2026 | June 30, 2026 | September 30, 2025 | September 30, 2026 | September 30, 2025 | |||||||||||||||
| GAAP gross profit | $ | 128,070 | $ | 97,663 | $ | 71,901 | $ | 304,617 | $ | 187,257 | |||||||||
| Stock-based compensation | 123 | 130 | 164 | 404 | 601 | ||||||||||||||
| Performance-based equity | 84 | 84 | 136 | 223 | 247 | ||||||||||||||
| Amortization of purchased intangible assets | 2,528 | 2,529 | 2,582 | 7,639 | 7,746 | ||||||||||||||
| Non-GAAP gross profit | 130,805 | 100,406 | 74,783 | 312,883 | 195,851 | ||||||||||||||
| GAAP gross margin | 58.7 | % | 57.8 | % | 56.9 | % | 58.1 | % | 56.5 | % | |||||||||
| Non-GAAP gross margin | 60.0 | % | 59.5 | % | 59.1 | % | 59.7 | % | 59.1 | % | |||||||||
| GAAP operating expenses | 97,843 | 101,848 | 113,190 | 295,784 | 299,255 | ||||||||||||||
| Stock-based compensation | (19,702 | ) | (27,348 | ) | (21,347 | ) | (66,927 | ) | (56,934 | ) | |||||||||
| Performance-based equity | (9,093 | ) | (9,214 | ) | (11,111 | ) | (26,902 | ) | (23,719 | ) | |||||||||
| Amortization of purchased intangible assets | (206 | ) | (207 | ) | (350 | ) | (619 | ) | (1,533 | ) | |||||||||
| Acquisition and integration and other costs | (2,073 | ) | (2,217 | ) | (9,572 | ) | (10,815 | ) | (16,860 | ) | |||||||||
| Research and development funded by others | — | — | — | (500 | ) | (1,000 | ) | ||||||||||||
| Restructuring charges | (254 | ) | (64 | ) | (11,264 | ) | (792 | ) | (24,723 | ) | |||||||||
| Non-GAAP operating expenses | 66,515 | 62,798 | 59,546 | 189,229 | 174,486 | ||||||||||||||
| GAAP income (loss) from operations | 30,227 | (4,185 | ) | (41,289 | ) | 8,833 | (111,998 | ) | |||||||||||
| Total non-GAAP adjustments | 34,063 | 41,793 | 56,526 | 114,821 | 133,363 | ||||||||||||||
| Non-GAAP income from operations | 64,290 | 37,608 | 15,237 | 123,654 | 21,365 | ||||||||||||||
| GAAP operating margin | 13.9 | % | (2.5 | )% | (32.7 | )% | 1.7 | % | (33.8 | )% | |||||||||
| Non-GAAP operating margin | 29.5 | % | 22.3 | % | 12.1 | % | 23.6 | % | 6.5 | % | |||||||||
| GAAP interest and other income (expense), net | (2,057 | ) | (2,365 | ) | (2,099 | ) | (5,865 | ) | (11,093 | ) | |||||||||
| Non-recurring interest and other income (expense), net | 41 | 62 | 298 | 207 | 689 | ||||||||||||||
| Non-GAAP interest and other income (expense), net | (2,016 | ) | (2,303 | ) | (1,801 | ) | (5,658 | ) | (10,404 | ) | |||||||||
| GAAP income (loss) before income taxes | 28,170 | (6,550 | ) | (43,388 | ) | 2,968 | (123,091 | ) | |||||||||||
| Total non-GAAP adjustments | 34,104 | 41,855 | 56,824 | 115,028 | 134,052 | ||||||||||||||
| Non-GAAP income before income taxes | 62,274 | 35,305 | 13,436 | 117,996 | 10,961 | ||||||||||||||
| GAAP income tax provision (benefit) | (732 | ) | (8,310 | ) | 2,097 | 17,443 | (1,307 | ) | |||||||||||
| Adjustment for non-cash tax benefits/expenses | 2,232 | 9,310 | (797 | ) | (13,943 | ) | 2,747 | ||||||||||||
| Non-GAAP income tax provision | 1,500 | 1,000 | 1,300 | 3,500 | 1,440 | ||||||||||||||
| GAAP net income (loss) | 28,902 | 1,760 | (45,485 | ) | (14,475 | ) | (121,784 | ) | |||||||||||
| Total non-GAAP adjustments before income taxes | 34,104 | 41,855 | 56,824 | 115,028 | 134,052 | ||||||||||||||
| Less: total tax adjustments | 2,232 | 9,310 | (797 | ) | (13,943 | ) | 2,747 | ||||||||||||
| Non-GAAP net income | $ | 60,774 | $ | 34,305 | $ | 12,136 | $ | 114,496 | $ | 9,521 | |||||||||
| Shares used in computing GAAP and non-GAAP basic net income per share | 90,816 | 90,043 | 87,186 | 89,497 | 86,368 | ||||||||||||||
| Shares used in computing GAAP diluted net income (loss) per share | 97,714 | 97,333 | 87,186 | 89,497 | 86,368 | ||||||||||||||
| Dilutive common stock equivalents | — | — | 671 | 5,484 | 600 | ||||||||||||||
| Shares used in computing non-GAAP diluted net income per share | 97,714 | 97,333 | 87,857 | 94,981 | 86,968 | ||||||||||||||
| Non-GAAP basic net income per share | $ | 0.67 | $ | 0.38 | $ | 0.14 | $ | 1.28 | $ | 0.11 | |||||||||
| Non-GAAP diluted net income per share | $ | 0.62 | $ | 0.35 | $ | 0.14 | $ | 1.21 | $ | 0.11 | |||||||||
| MAXLINEAR, INC.UNAUDITED GAAP CONSOLIDATED STATEMENTS OF CASH FLOWS(in thousands) | |||||||||||||||||||
| Three Months Ended | Nine Months Ended | ||||||||||||||||||
| September 30, 2026 | June 30, 2026 | September 30, 2025 | September 30, 2026 | September 30, 2025 | |||||||||||||||
| Operating Activities | |||||||||||||||||||
| Net income (loss) | $ | 28,902 | $ | 1,760 | $ | (45,485 | ) | $ | (14,475 | ) | $ | (121,784 | ) | ||||||
| Adjustments to reconcile net income (loss) to cash provided by (used in) operating activities: | |||||||||||||||||||
| Amortization and depreciation | 8,853 | 9,011 | 8,990 | 26,983 | 27,572 | ||||||||||||||
| Amortization of debt issuance costs and accretion of discount on debt and leases | 479 | 425 | 477 | 1,318 | 1,478 | ||||||||||||||
| Stock-based compensation | 19,824 | 27,479 | 21,511 | 67,330 | 57,535 | ||||||||||||||
| Deferred income taxes | (3,059 | ) | (10,231 | ) | 275 | 11,843 | (6,080 | ) | |||||||||||
| Loss on disposal of property and equipment | 490 | 200 | 261 | 690 | 1,161 | ||||||||||||||
| Reduction in the carrying amount of leased right-of-use assets | 1,721 | 1,795 | 1,848 | 5,336 | 5,632 | ||||||||||||||
| Impairment of leased right-of-use assets | — | — | — | 233 | 427 | ||||||||||||||
| (Gain) loss on extinguishment of lease liabilities | 3 | (328 | ) | — | (325 | ) | — | ||||||||||||
| (Gain) loss on foreign currency and other | (148 | ) | 466 | 211 | 99 | 5,672 | |||||||||||||
| Excess tax (benefits) deficiencies on stock-based awards | (1,886 | ) | (11,585 | ) | 1,931 | (12,501 | ) | 4,205 | |||||||||||
| Changes in operating assets and liabilities: | |||||||||||||||||||
| Accounts receivable, net | (22,344 | ) | (10,182 | ) | 52,884 | (27,259 | ) | 32,530 | |||||||||||
| Inventory | (8,232 | ) | (19,651 | ) | (298 | ) | (35,618 | ) | 4,014 | ||||||||||
| Prepaid expenses and other assets | (45,667 | ) | (14,763 | ) | 1,173 | (68,168 | ) | 5,653 | |||||||||||
| Accounts payable, accrued expenses and other current liabilities | 4,634 | 18,251 | (40,139 | ) | 3,925 | (15,546 | ) | ||||||||||||
| Accrued compensation | 7,262 | 11,690 | 15,047 | 28,473 | 26,896 | ||||||||||||||
| Accrued price protection liability | (825 | ) | 3,660 | (5,681 | ) | 3,874 | (9,562 | ) | |||||||||||
| Lease liabilities | (2,543 | ) | (2,748 | ) | (2,928 | ) | (8,028 | ) | (8,705 | ) | |||||||||
| Other long-term liabilities | (1,054 | ) | (440 | ) | 47 | (1,383 | ) | (1,885 | ) | ||||||||||
| Net cash provided by (used in) operating activities | (13,590 | ) | 4,809 | 10,124 | (17,653 | ) | 9,213 | ||||||||||||
| Investing Activities | |||||||||||||||||||
| Purchases of property and equipment | (5,940 | ) | (2,338 | ) | (5,729 | ) | (9,662 | ) | (8,890 | ) | |||||||||
| Purchases of intangible assets | (3,708 | ) | (810 | ) | (1,012 | ) | (5,373 | ) | (7,219 | ) | |||||||||
| Funding of convertible notes receivable | — | — | — | (2,000 | ) | — | |||||||||||||
| Net cash used in investing activities | (9,648 | ) | (3,148 | ) | (6,741 | ) | (17,035 | ) | (16,109 | ) | |||||||||
| Financing Activities | |||||||||||||||||||
| Proceeds from borrowings under revolving credit facility | 40,000 | 20,000 | — | 60,000 | — | ||||||||||||||
| Repayment of borrowings under revolving credit facility | — | (20,000 | ) | — | (20,000 | ) | — | ||||||||||||
| Proceeds from funding arrangement | — | 2,000 | — | 8,000 | — | ||||||||||||||
| Payment of debt issuance costs | — | (479 | ) | — | (479 | ) | — | ||||||||||||
| Net proceeds from issuance of common stock, net of costs | — | 3,804 | 27 | 3,804 | 2,167 | ||||||||||||||
| Minimum tax withholding paid on behalf of employees for restricted stock units | (94 | ) | (3,716 | ) | (12 | ) | (7,532 | ) | (2,213 | ) | |||||||||
| Net cash provided by (used in) financing activities | 39,906 | 1,609 | 15 | 43,793 | (46 | ) | |||||||||||||
| Effect of exchange rate changes on cash, cash equivalents and restricted cash | (536 | ) | 530 | (388 | ) | (653 | ) | 602 | |||||||||||
| Increase (decrease) in cash, cash equivalents and restricted cash | 16,132 | 3,800 | 3,010 | 8,452 | (6,340 | ) | |||||||||||||
| Cash, cash equivalents and restricted cash at beginning of period | 93,732 | 89,932 | 110,253 | 101,412 | 119,603 | ||||||||||||||
| Cash, cash equivalents and restricted cash at end of period | $ | 109,864 | $ | 93,732 | $ | 113,263 | $ | 109,864 | $ | 113,263 | |||||||||
| MAXLINEAR, INC.UNAUDITED GAAP CONDENSED CONSOLIDATED BALANCE SHEETS(in thousands) | ||||||||
| September 30, 2026 | June 30, 2026 | September 30, 2025 | ||||||
| Assets | ||||||||
| Current assets: | ||||||||
| Cash and cash equivalents | $ | 81,085 | $ | 64,814 | $ | 111,859 | ||
| Short-term restricted cash | 1,359 | 1,492 | 1,380 | |||||
| Accounts receivable, net | 73,381 | 51,037 | 52,934 | |||||
| Inventory | 113,722 | 105,490 | 86,329 | |||||
| Prepaid expenses and other current assets | 121,648 | 75,829 | 31,630 | |||||
| Total current assets | 391,195 | 298,662 | 284,132 | |||||
| Long-term restricted cash | 27,420 | 27,426 | 24 | |||||
| Property and equipment, net | 41,276 | 41,207 | 50,865 | |||||
| Leased right-of-use assets | 18,095 | 19,724 | 14,624 | |||||
| Intangible assets, net | 44,046 | 43,780 | 52,066 | |||||
| Goodwill | 318,588 | 318,588 | 318,588 | |||||
| Deferred tax assets | 65,419 | 62,361 | 74,764 | |||||
| Other long-term assets | 10,390 | 10,823 | 13,070 | |||||
| Total assets | $ | 916,429 | $ | 822,571 | $ | 808,133 | ||
| Liabilities and stockholders’ equity | ||||||||
| Current liabilities | $ | 176,421 | $ | 168,124 | $ | 183,551 | ||
| Long-term lease liabilities | 13,776 | 15,465 | 12,133 | |||||
| Long-term debt | 164,062 | 123,926 | 123,461 | |||||
| Other long-term liabilities | 29,161 | 30,216 | 24,261 | |||||
| Stockholders’ equity | 533,009 | 484,840 | 464,727 | |||||
| Total liabilities and stockholders’ equity | $ | 916,429 | $ | 822,571 | $ | 808,133 |
View source version on businesswire.com: https://www.businesswire.com/news/home/20261022237641/en/
MaxLinear, Inc. Investor Relations Contact:
Leslie Green
[email protected]
Source: MaxLinear, Inc.
Released October 22, 2026
© 2026 MaxLinear. All Rights Reserved.
 Share
 Post
 Share
 Share
 Share
 Share
 Share
 Email