Skip to main content Source Our Company Signal blog Official Microsoft Blog Command Line Microsoft On The Issues Asia Canada Europe, Middle East and Africa Latin America The Code of Us What's new AI Innovation Digital Transformation Sustainability…
Skip to main content

Source
Our Company
Signal blog
Official Microsoft Blog
Command Line
Microsoft On The Issues
Asia
Canada
Europe, Middle East and Africa
Latin America
The Code of Us
What's new
AI
Innovation
Digital Transformation
Sustainability
Security
Work & Life
Diversity & Inclusion
Unlocked
More
Our Company Signal blog
Official Microsoft Blog
Command Line
Microsoft On The Issues
Asia
Canada
Europe, Middle East and Africa
Latin America
The Code of Us
What's new
AI
Innovation
Digital Transformation
Sustainability
Security
Work & Life
Diversity & Inclusion
Unlocked
All Microsoft
Software
PCs & Devices
Entertainment
Business
Developer & IT
Other
View Sitemap
Cancel
Search

By builders, for builders.
A Microsoft publication
Search articles
Deep Dive
Share
in
r
x
f
Nine engineers, 1,211 pull requests in a day: Lessons from building Copilot Cowork
Nine engineers, 1,211 pull requests in a day: Lessons from building Copilot Cowork
Plus a case study where we put everything together by moving our runtime from Python to Rust while live.
By Bas Brekelmans
Partner Software Engineer, Microsoft
2026.11.02
Listen to article
1×
0.75×1×Normal1.25×1.5×2×
Listen to article25:28
0:00 / 25:28
1×
Error: Unable to generate audio.
In January of this year, a small team at Microsoft set out to build Copilot Cowork
, an agentic execution layer that performs multi-step workflows on a user’s behalf. That result brings the powerful AI-assisted tools and capabilities developers have today to everyday knowledge workers, all with Work IQ
, Microsoft 365 security and governance, cloud execution, and Microsoft’s multi-model architecture.
This is the story of how the team took Copilot Cowork from an empty repo to worldwide GA in about four and a half months, then moved its runtime from Python to Rust while it was live. Agents wrote most of the code. Ways of working changed along the way, and the practices other teams can adapt to build like a frontier development team: moving fast while keeping reliability, security, and cost in view.
On October 21, nine engineers merged 1,211 pull requests into the main branch of the Copilot Cowork
backend. That number would have sounded absurd to the team in January, when a handful of us made the first commit to an empty repo.
Agents wrote most of the code, but engineers remained responsible for defining the work and judging the results. Our small team wrote clearer specs, set architecture and security boundaries, and focused its review on higher-risk changes, production impact, and cases where checks or reviewers disagreed. Automated checks and agent reviewers examined every change. Agents could propose changes, but they could not decide what was allowed to happen.
We didn’t plan on working this way. But every few weeks, the agents got better, part of our process stopped working, and we adapted.
Six practices emerged from those changes. They cover how we specify work, run agents within clear boundaries, test our checks, preserve what the team learns, shape the codebase for parallel work, and set limits on automated loops. They aren’t a recipe for matching our PR count. They are lessons other teams can adapt to build like a frontier development team while keeping reliability, security, and cost in view.
We’ll end with the project that puts those practices to the test together: moving the live runtime from Python to Rust.
Lesson 1: Write the spec before the code
The first commit was made on January 13. From the start, agents wrote the code.
In the first weeks, we learned that the agent was rarely what slowed us down. The bottleneck was not knowing exactly what we wanted. A vague request got us code that looked reasonable, survived a quick read, and then did the wrong thing. Fixing it took longer than writing a proper request would have in the first place.
So we adopted a rule that still stands today: no code without a markdown spec written first. The spec covers three things:
- What the change does
- How we’ll know it works
- What it must not break
A good spec saves far more time than it costs upfront. But a weak one leads to rework a few days later. The faster agents became at implementation, the more important it became for us to be precise about intent, requirements, and what good looked like.
Many of our specs start out spoken. Someone talks through a feature, and an agent turns that into a first draft of the spec, which the human then edits. I think this did more for our speed than any single model upgrade.
We launched Copilot Cowork to our first enterprise customers in the Frontier program
on March 30.
Lesson 2: Run narrow agents inside clear boundaries
The next step was running more than one agent at a time. Each works in its own copy of the repo, on one task, from one spec. One agent became five, and five became dozens.
Merged PRs per month went from 257 in January to 2,754 in May. Our busiest week before GA had 783.
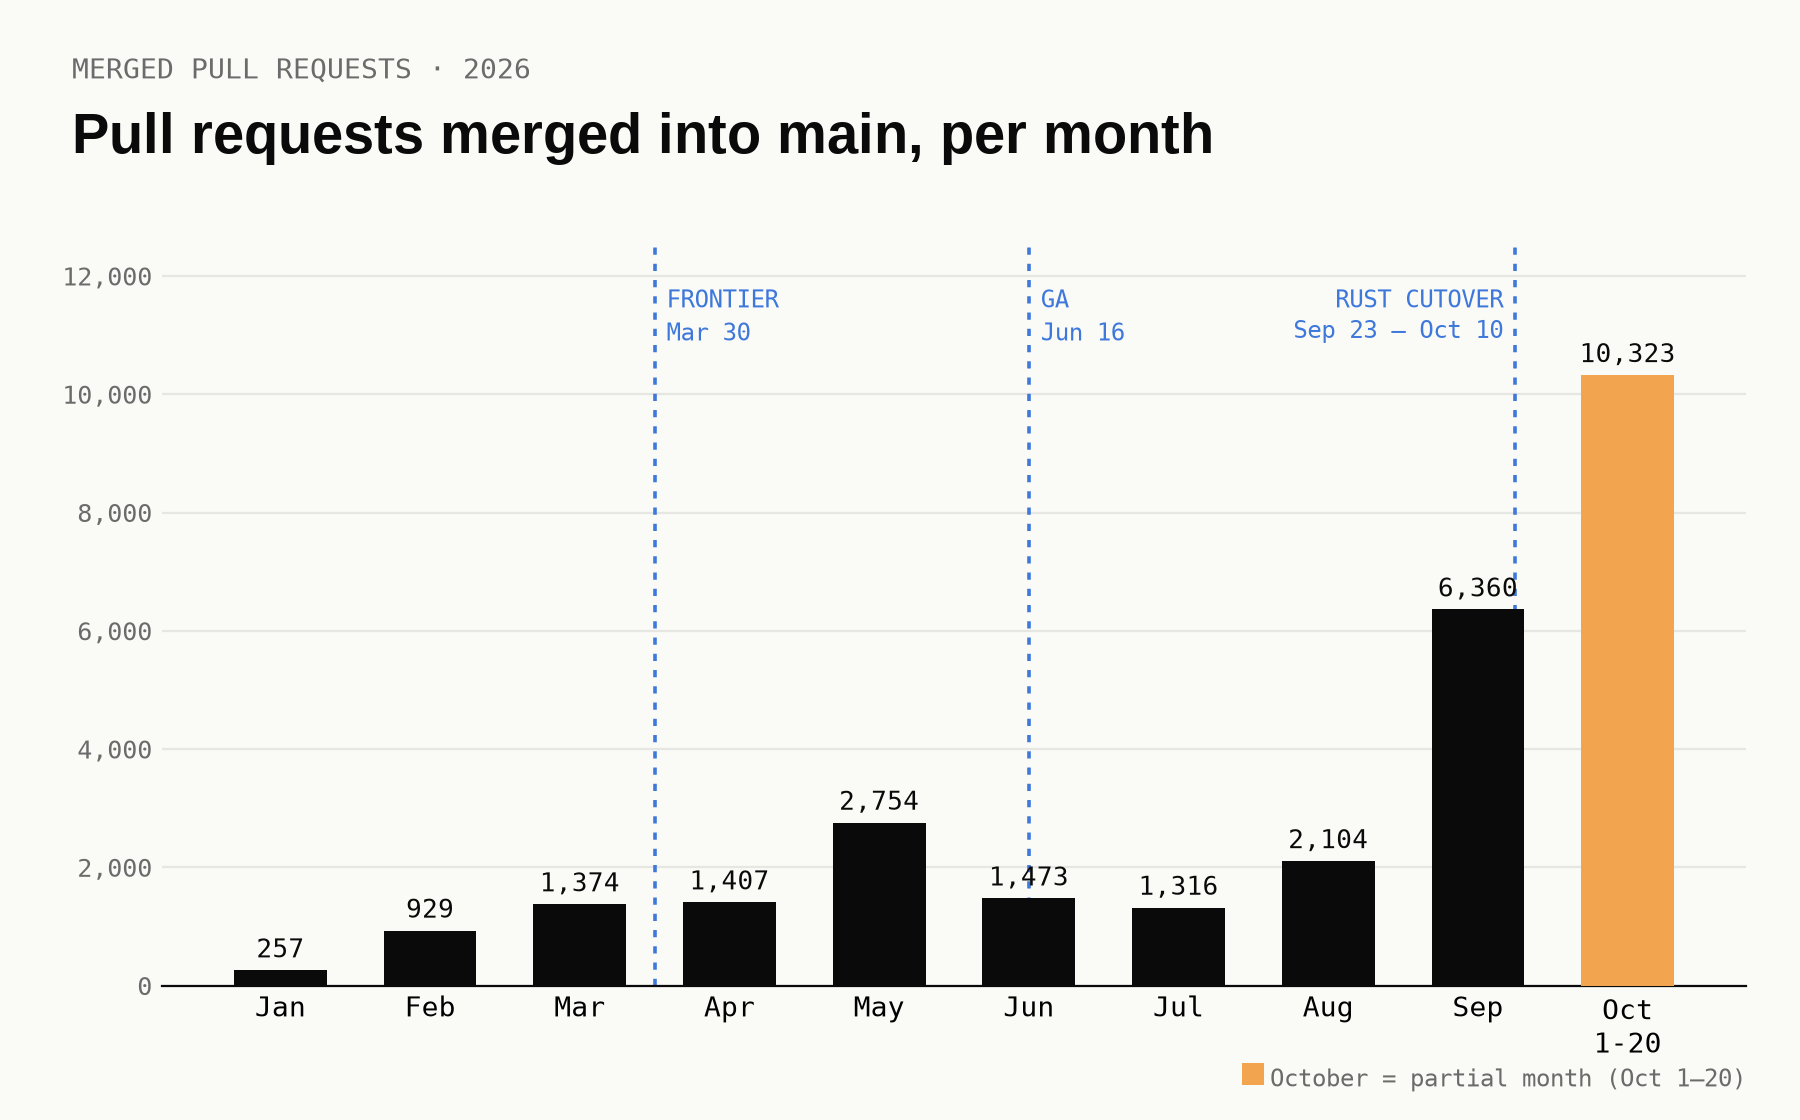
Figure A. Pull requests merged into main per month in 2026, with Frontier (March 30), GA (June 16), and the Rust cutover (September 23 – October 10) marked. October covers the 1st through the 20th.
Parallel work went better than we expected for two reasons:
- Narrow tasks: An agent with one well-defined task makes fewer mistakes than one asked to do a lot at once.
- Picking the model per task: We treated model choice as a quality-and-cost tradeoff, not a race to use the cheapest model. Some tasks warranted stronger reasoning; for others, a faster, less expensive model gave us the right balance.
In Copilot Cowork, the model runs in a container without user credentials. A trusted host outside the container handles identity, policy, approvals, and tools, and every Microsoft 365 operation goes through the host.
We didn’t want to limit what the agent could attempt, because a heavily restricted agent isn’t very useful)
. With our architecture, the model can plan and ask for anything, and the host decides what actually happens.
That separation lets us increase the number of agents working in parallel without giving the model credentials or direct authority over operations. The host still applied identity, policy, approvals, and audit at the point of execution.
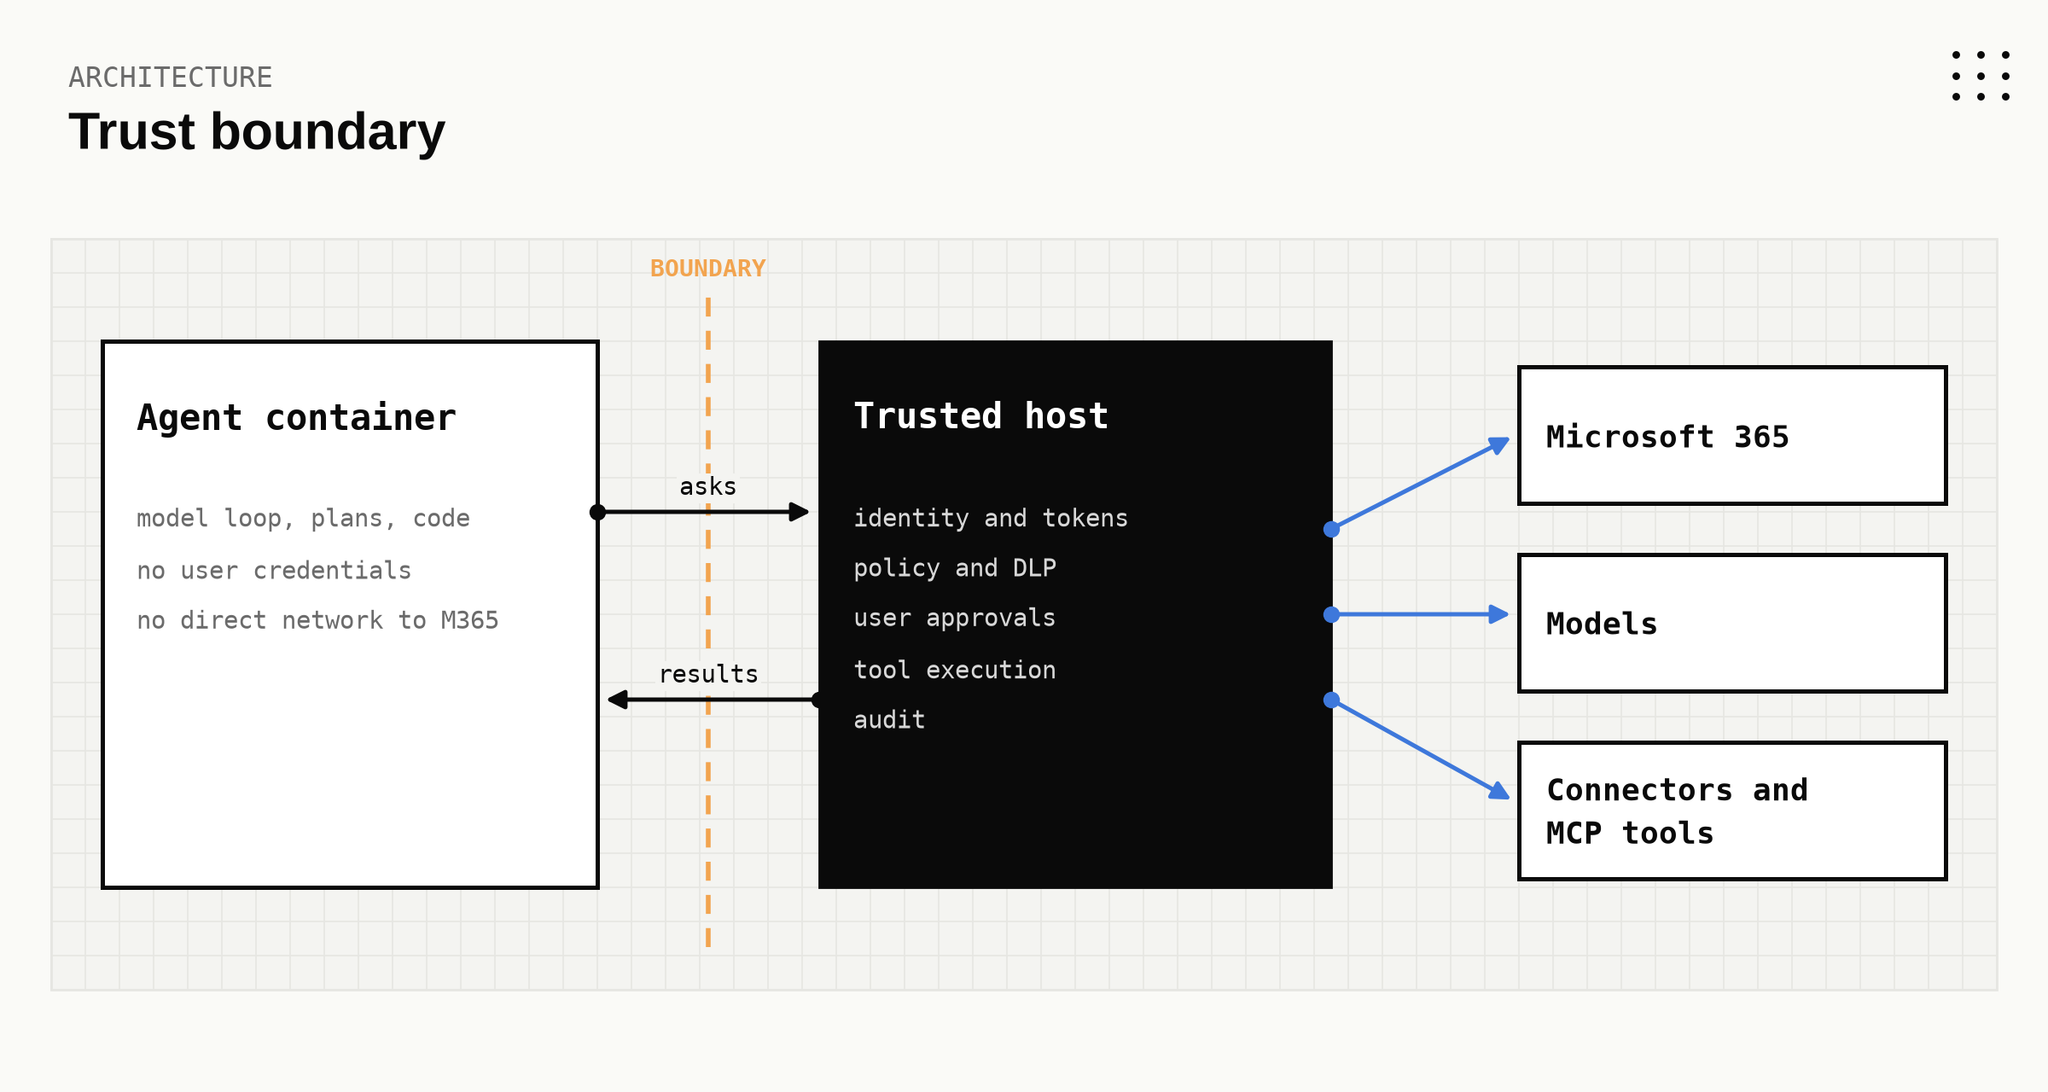
Figure B. The agent container holds no user credentials and has no direct network path to Microsoft 365. Every request crosses the boundary to the trusted host, which owns identity, policy, approvals, tool execution, and audit.
Building that in at the start was much easier than adding it later would’ve been. It also helped in a way we didn’t plan for. The agent only talks to the host through a defined interface, so we could later replace the entire host without changing the agent—which we did when we migrated to Rust.
We reached worldwide general availability on June 16, about four and a half months after the first commit, with several models and 16 plugins.
Lesson 3: Make checks prove they checked something
With agents writing most of the code, nine people couldn’t read every change, and waiting for a human review was becoming the slowest step for every PR.
Several engineers each built their own review bot, modeled on how they review code themselves, and the bots competed. When one bot caught a problem another had missed, the bot that missed it got a new rule. Over time, each reviewer built up a large set of rules learned from its own misses. Each one has now been through at least10,000 generations; in each generation, the reviewer runs reviews, then reflects on what it missed and gets better at reviewing code.
Today, a useful first review usually arrives within several minutes of a pull request being opened. On a sample of recent merged PRs, the median was about four and a half minutes.
Slower, more specialized passes follow:
- One walks the call graph, looking for code that isn’t wired up and for tests that would still pass if the change were reverted
- One looks at operational problems like restart safety, metrics, and stale docs
- One reads every changed file end to end
- One checks behavior against the code being replaced
The author gets quick feedback while the change is still fresh, and the detailed reading still happens.
Of course, reviewer agents can still miss things. Once, a group of reviewer agents read a change in one of the most sensitive parts of the product. Each had been told to try to break it, and none found a problem. People on the team then read the same diff and found four blocking issues, all of which were fixed before it merged.
Fast first feedback was useful, but it wasn’t permission to skip judgment. We kept agentic review as the first check and added at least one human check for critical changes. We made it clear which findings could block a merge.
We also split findings into two tiers:
- Blocking: Correctness, security, data loss, or a new mechanism with no test that would catch it breaking.
- Advisory: Everything else. The author either fixes it or replies, and it doesn’t force another round of review.
Another rule came from a check that couldn’t fail. We keep a size limit on the instruction files agents read, because every extra byte costs tokens on every run. The limit was exceeded, and the check that enforced it stayed green the whole time.
The script piped the check’s output through tail. A shell pipeline returns the exit code of its last command, and that was tail, which always succeeded:
Copy ``` # The pipeline's exit code is tail's, so this always passes lint-size-check | tail -1 # Keep the check's own exit code and print it lint-size-check > out.txt 2>&1; rc=$?; echo "lint rc=$rc"; cat out.txt; [ "$rc" -eq 0 ] || exit 1 ```
Once we went looking, we found the same problem in other places:
- A formatting check that was handed an empty list of files, so it checked nothing and passed
- A list of changed files that came back empty as soon as the work was committed
We wrote a two-part rule:
- Every check reports how many files it checked
- Every new check comes with a test that makes it fail on purpose
I think this matters more with agents than without them. Agents keep working until the checks pass, so if a check can pass without testing anything, an agent will eventually find that path.
Lesson 4: Put what the team learns in the repo
By August, the same mistakes kept coming back. Each agent session started without any memory of the previous one, so we moved the team’s rules into the repo:
- Instruction files at the root and in each component
- A directory of rule files on specific topics
Now, every agent reads the relevant files when it starts work. When something goes wrong, the fix usually includes a new or updated rule. There are about 30 rule files now, and the oldest dates from August 6.
One early rule was about merge conflicts. At a few hundred merges a day, almost none of our conflicts were in actual logic. They were in files every branch appended a line to: registries, lists, generated files, and documents with a “last updated” line. Instead of asking people to resolve conflicts more carefully, we changed the files:
- Registries became one file per entry instead of a long list
- Generated files are regenerated after a merge, never merged by hand
- Values that change on every pull request, like dates and counts, are no longer committed
Lesson 5: Shape the codebase for parallel work
Agents also wrote most of the first Rust code in the repo, and they put things wherever it was easiest, which usually meant the biggest crate. At one point, the main runtime binary was about 290,000 lines, and splitting it up took a long time.
On August 20, we took stock of the Rust workspace:
- There were 86 crates, with a dependency chain 13 levels deep
- A change to the shared base crate forced a rebuild of 43 of the 63 crates
- The API crate had grown to 134,000 lines and was also where everything got wired together
- About 12,000 lines of business logic sat in the binary itself, because circular dependencies between implementation crates left nowhere else to put it
For a team running many agents in parallel, that structure was a problem. Most changes touched the same few crates, rebuilt most of the workspace, and conflicted with each other.
We fixed it with a strict rule about roles. Every crate is one of four kinds:
- Contract (types and interfaces)
- Kit (shared helpers with no internal dependencies)
- Implementation
- Binary
Implementations may depend on contracts and kits but not on other implementations. Only binaries depend on implementations, and binaries contain wiring code only. When one implementation needs something from another, that dependency goes through a contract.
New code gets no exceptions and no allowlists. Each exception we had granted in the past had been used to justify the next one.
The cleanup ran as a program of 401 work items with 2,225 dependencies between them, and at the peak, 40 to 44 items were ready at once. We grouped work into batches that never touched the same files, so parallel agents wouldn’t conflict. We even split the gate’s own list of temporary exceptions into one file per crate. Otherwise, a single wave of about 20 agents would all have edited the same file. The engineer who owned the program made decisions at set checkpoints, and agents did most of the implementation.
The CI gate started out as a report. Then it became a ratchet, where the allowed number of exceptions could only go down. The results:
- Dependencies from one implementation to another on the exception list went from 216 on August 22 to zero on October 7.
- The maximum dependency depth the gate allows went from 10 to three.
- The number of crates went from 86 to about 176.
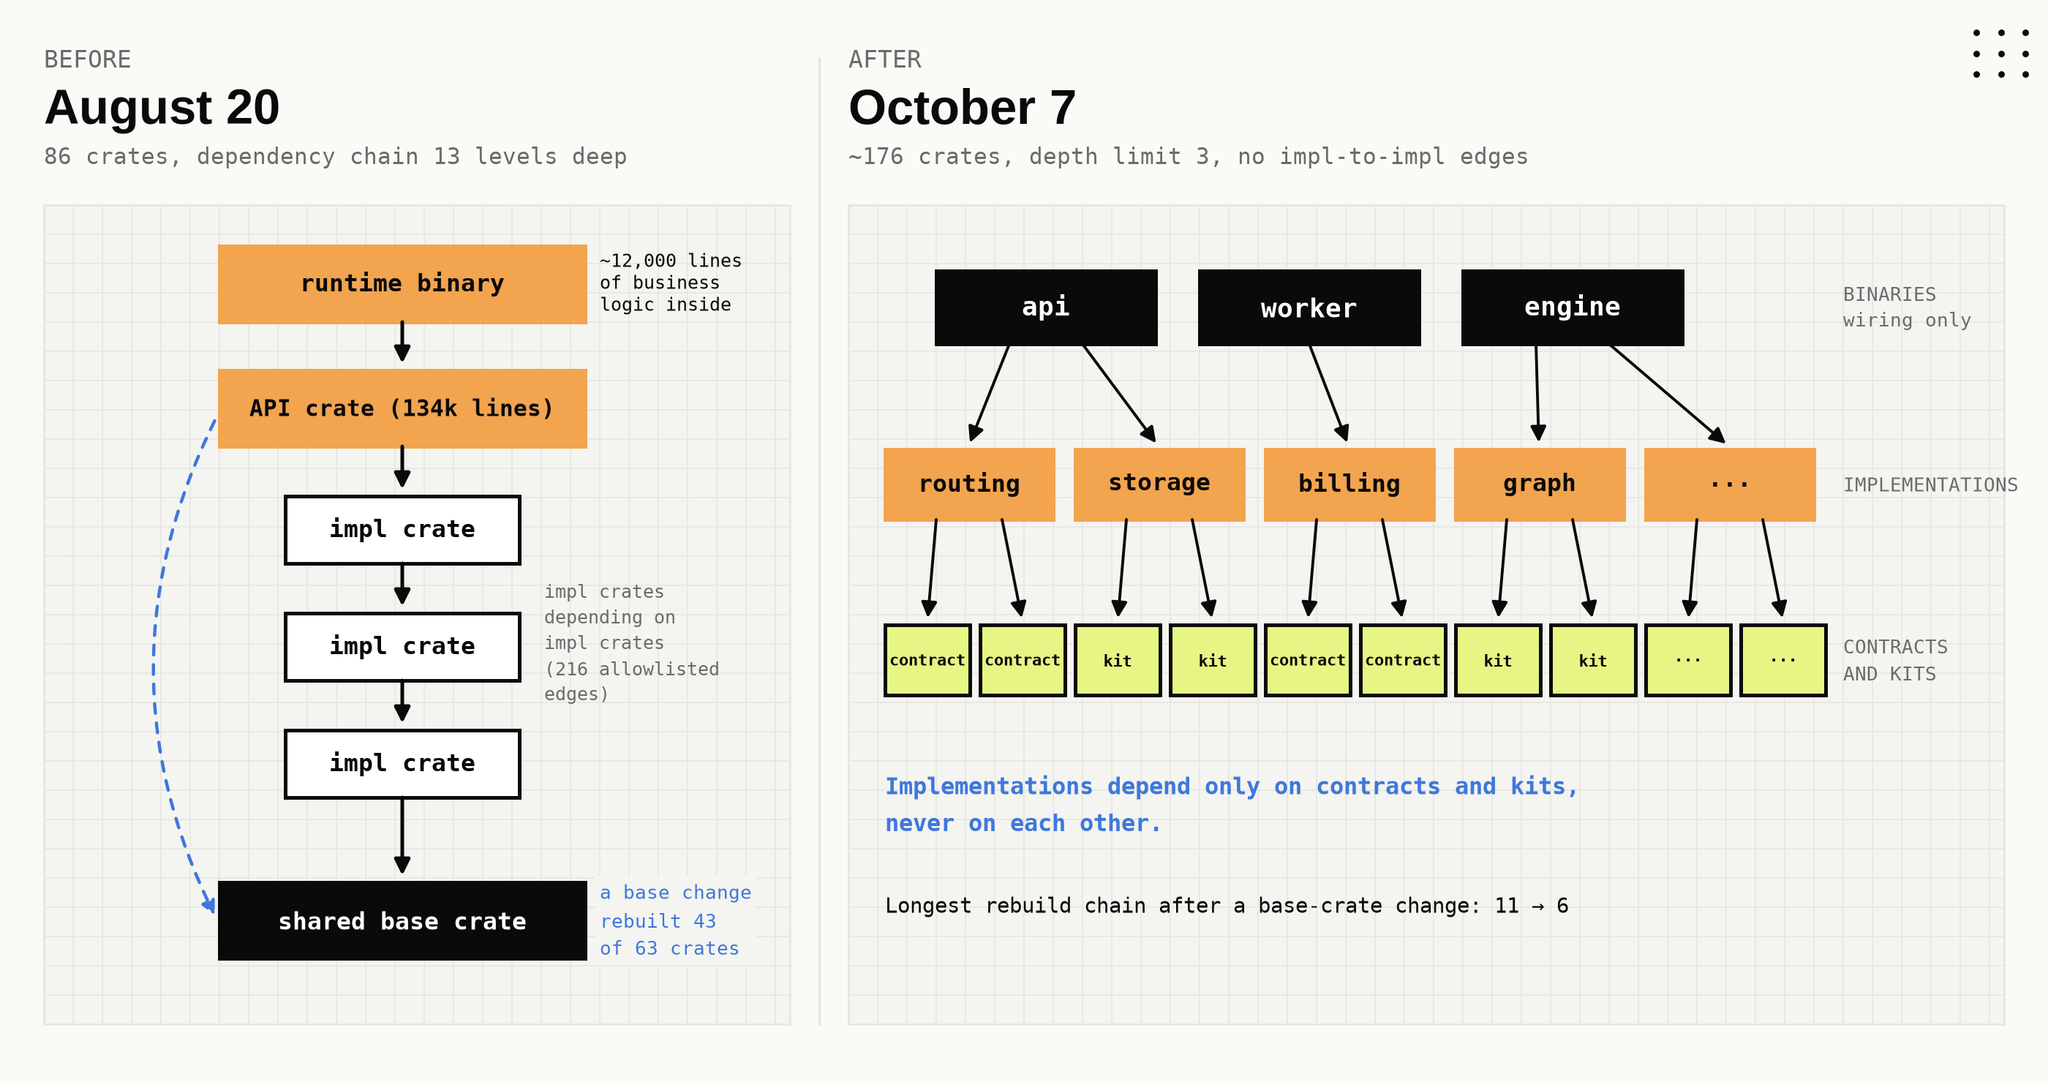
Figure C. The Rust workspace before (August 20) and after (October 7). Before: one deep chain, with business logic in the binary and implementation crates depending on each other. After: binaries only wire things together, and implementations depend only on contracts and kits.
The build-time gains were smaller than we had predicted. Our compile cache already hit about 99% of the time on pull request builds, so the run-to-run variation in build time was bigger than the improvement. What we could measure was structural. After a change to a base crate, the longest chain of crates that must be rebuilt in sequence went from 11 to 3. This is now used to drive further speed improvements and prevent compilation time from increasing linearly with the size of the codebase.
Lesson 6: Give automated loops targets and limits
For most of this year, the loop was manual: a person prompted an agent, read the result, and decided what to do next. More of our work now runs as automated loops. A harness gets one measurable target and keeps working until it reaches it or runs out of attempts. People choose the target, decide what must not get worse, and keep the final say on anything that reaches production.
Test speed
The clearest example is a harness whose target is the time CI spends running tests. It opens two kinds of pull requests:
- Changes that make a slow test faster
- Removals of tests whose behavior another test already covers
Its pull requests only merge if CI’s own timing data shows the touched tests at least 5% faster. A review step also compares every assertion against the original, so a faster test can’t be one that checks less. About 300 of these PRs have merged since mid-September. Across them, the touched test files went from roughly 17,700 seconds of CI time to about 1,700.
Document quality
We ran a series of passes, each of which changed the skill that generates documents. Each pass was judged by comparing its output with the previous version on a fixed set of tasks. A pass was kept only if all three of these held:
- It won more comparisons than it lost
- The lowest 10% of scores didn’t get worse
- No hard check started failing
If one of those criteria wasn’t met, it was reverted. Three of 10 passes were kept. Some passes won the head-to-head comparisons and were still rejected, because their weakest outputs had gotten worse. A person made the final decision to ship.
The factory: Production signals in, measured merges out
Our newest harness, which we call the factory, takes the long tail of engineering work as its input: an error cluster a release introduced, feedback that points at a tool, a main build that broke an hour ago, a file that grew past its size budget. Each one is small. Together they arrive faster than people can pick them up. Deterministic rules turn those signals into work items, so nobody files tickets, and we don’t trust a model to raise the alarm. The harness does not need access to customer content to improve the system; it reproduces issues using the logs and the user’s feedback as context.
Each item starts from a production number—for example, 2,148 rejected payloads across 688 conversations—and includes an acceptance check that the harness runs itself and a test that fails before the change. The item then goes through the stages a person would follow: research, a design, a build, and a pull request. Every stage that matters has a critic running on a different model family from the agent it checks.
Before a pull request opens, the harness reverts the fix and runs the new tests again. If a test still passes without the fix, it isn’t considered evidence, and the change doesn’t go out. It’s the same rule as the one we wrote for our checks, applied to every change the harness makes.
Merging isn’t the finish line either. The harness follows each merged commit into a release and the first production ring, then checks whether the signal actually dropped on builds that contain the fix. If the problem comes back, it becomes a new work item.
In the week of October 12, 4,581 pull requests merged into main, about 650 a day, and a growing share of them came from the factory.
All of the factory’s state lives in one database, so any machine can pick up any run, and a crash loses a process, never a fact.
Every loop we run has four things decided before it starts:
- A written rule for when a change is kept and when it’s reverted
- A measure that isn’t allowed to get worse
- A limit on attempts (the agent that takes pull requests through to merge stops after 20 rounds or after hitting the same CI failure three times, whichever happens first)
- A list of actions that still need a person: deploying to production and changing configuration
Case study: Moving the runtime from Python to Rust
Python got us to GA quickly, and I don’t think we would’ve made the June date with anything else. At the scale we reached afterwards, though, it caused three problems:
- Event-loop stalls: Each Python process has one event loop. Under load, we measured stalls of up to 11.9 seconds, during which everything in that process waited, including lock renewals, so some turns lost their locks partway through.
- A hidden timeout: We found that 16.7% of session setups took exactly 5.000 seconds. That turned out to be a timeout firing, not real work.
- Memory: When the system ran out of memory, the process that got killed was almost always the Python one: 539 times in one week on a single cluster.
We first tried moving blocking work off the event loop. That helped, and it showed that the underlying limit was the single loop itself rather than any individual blocking call.
Each of the earlier changes played a part in the migration:
- The cutover had a written runbook and design records before any traffic moved
- Agents ported subsystems in parallel, and Rust commits went from about 200 in July to roughly 3,900 in September
- The flattened crate graph meant those ports mostly didn’t collide
But it was hard to know whether a port was correct. Reading Rust next to Python doesn’t scale, so we recorded what the Python did instead.
For each behavior we port, a small generator runs the real Python code over a set of inputs and records the results: response bodies, status codes, log lines, and storage writes. That output is a JSON file we call a fixture. The Rust test replays the fixture and has to match it exactly.
Nobody edits fixtures by hand. Every generator can also run in a check mode, which fails if the fixture no longer matches the Python. We have about 430 fixtures.
This is a small one, for the function that decides whether a turn is still running:
Copy ``` // fixture: written by running the Python, never edited by hand { "cases": [ { "has_pending_redelivery": false, "signal_routes_in_flight": 0, "awaiting_up_request_ids": [], "running_turn_request_id": "", "last_terminal_request_id": "", "expected": true }, ... 47 more ] } #[test] fn every_python_case_is_reproduced() { let fixture: Fixture = serde_json::from_str(FIXTURE).expect("fixture parses"); assert_eq!(fixture.cases.len(), 48, "the generator's full grid"); for case in fixture.cases { assert_eq!(turn_running(&case.inputs()), case.expected); } } ```
The test checks the number of cases before comparing them, because a replay over zero cases would also pass.
When the Python is deleted, its last fixture stays in the repo as the specification for the Rust code. Where the Rust is allowed to behave differently, the difference goes on a list of known gaps that can only get shorter.
We moved traffic one cluster at a time, behind flags that could switch back. We finished on October 10—the day after we deleted the Python.
| Date |
Step |
| September 23 |
First internal attempt, rolled back |
| September 24 |
Rust served its first production turns |
| October 9 |
Python runtime deleted: About 8,000 files and 4.9 million lines, including tests and generated code |
| October 10 |
Last cluster moved |
Time to first token on the first turn of a session dropped a lot. These numbers compare a Rust cluster with a Python cluster over the same 12-hour window in late September:
| Language |
p50 |
p90 |
| Python |
7.9 s |
14.5 s |
| Rust |
2.7 s |
6.2 s |
Not all of that benefit comes from Rust. The same change moved the agent loop out of the container, which was slow to start, and into the Rust service. I think that move accounts for a large part of the gain.
The event-loop stalls and the 5-second setups are gone. We haven’t measured cost per turn properly yet, so we’re not making any claim about cost.
Two things went wrong:
- Event ordering: Python had been delivering certain events in order without anyone ever specifying it, and the first Rust version didn’t. No fixture caught this, because nobody had thought to record ordering.
- A slow front door: The first Rust front door took about six times longer to acknowledge a new message, because it waited for the whole pickup before replying.
We fixed both.
What the six lessons add up to
The lesson isn’t to aim for our PR count. It’s to move human attention to the decisions and controls that matter more when code arrives faster. Most of our own time now goes into four decisions:
- What to build
- Where to draw the boundaries
- Which test proves a change works
- Whether a passing check means what it appears to mean
The Python-to-Rust migration tested these practices together. We could move quickly because we had specified the work, recorded behavior to check against, and moved traffic in steps we could reverse.
Some of these practices are especially useful when you can define what “done” means, changes arrive faster than people can review them, or you can compare a replacement system with one that is still running. But the broader lesson applies beyond those conditions: engineers didn’t step out of the process. They spent more time deciding what the boundaries are, where human review was essential, and what was ready for production. We’re exploring how agents can handle more of the routine merge workflow while preserving explicit human checkpoints for higher-stakes changes.
Try it yourself
You don’t need to start with dozens of agents.
Start with one check your team trusts: make it fail on purpose and confirm that it does. Then choose one bounded task, write down what success means and what must not break, and see what changes when an agent works within those limits.
Share
in
r
x
f
Nine engineers, 1,211 pull requests in a day: Lessons from building Copilot Cowork
Next Stop
### The check that catches agent failures can also train them
Deep Dive
In our second post on ThinkingBox, we look at expanded model evaluations, the price of dependable runs, and reinforcement learning on terminal-state rewards.
[ read ]
November 6, 2026
### Copilot to autopilot: Why no single safeguard is enough
Deep Dive
We designed a layered model that lets an AI agent resolve production network incidents on its own within defined identity, authorization, tooling, and human-approval boundaries.
[ read ]
October 13, 2026
Follow the systems work as it breaks and gets rebuilt. Subscribe for updates
© 2026 A Microsoft publication
English (United States)
Your Privacy Choices
Consumer Health Privacy
Sitemap
Contact Microsoft
Privacy
Terms of use
Trademarks
Safety & eco
Recycling
About our ads
Manage cookies
RSS
What's new
Microsoft Store
Education
Business
Developer & IT
Company
English (United States)
Your Privacy Choices Opt-Out Icon Your Privacy Choices
Consumer Health Privacy
 Read XBOX Insider · XBOX Insider Cloud Playtime Now Available to Test with XBOX Insiders
 Read XBOX Insider · XBOX Insider Available for XBOX Insiders: Mythic Achievements, One of our Most Player-Requested Features
 Read XBOX Insider · XBOX Insider XBOX Insiders Can Join the Chicken Invaders Collection Preview Today!






 Opens in a new tab Spotlight Spotlight · Explore Celebrating 40 Years of Bethesda Game Studios
 Read Return of XBOX · Return of XBOX XBOX Game Pass Is Coming to Eligible T-Mobile Customers
 Read Return of XBOX · Return of XBOX Hello from Seattle: XBOX FanFest Comes Home November 12




 10,661